AI Tools for Data Analysis — with Cursor
Learn to use Cursor for data analysis in these 30 minutes workshop series.
The 3 Workshops
1. Fundamentals — 30 min
Write better prompts using the prompt formula. Learn why specificity matters.
Learning Objectives
By the end of this workshop, you will know:
- How LLMs work and why tokens matter
- The prompt formula: context + task + constraints + format
- How to write focused, specific prompts that work
- Why conversation history affects your results
Time Breakdown:
| Time | Activity |
|---|---|
| 0–5 min | Key Idea: Tokens & Context |
| 5–12 min | The Prompt Formula |
| 12–25 min | Quick Try-Out in Cursor Chat |
| 25–30 min | Key Takeaways & Next Steps |
2. Data Analysis & Visualization — 30 min
Create charts using ggplot2. Build data visualization skills.
Learning Objectives
By the end of this workshop, you will be able to:
- How to describe visualizations to AI
- When to use bar plots, scatter plots, and box plots
- Generate ggplot2 code by talking to Cursor
- Build charts by specifying what you want, not syntax
Time Breakdown:
| Time | Activity |
|---|---|
| 0–2 min | Setup (load libraries, data) |
| 2–10 min | Chart 1: Bar Plot Tutorial |
| 10–18 min | Chart 2: Scatter Plot Tutorial |
| 18–28 min | Your Turn (pick & build one chart) |
| 28–30 min | Key Takeaways |
3. Building with AI — 30 min
Build a complete analysis workflow: load → clean → summarize → plot.
Learning Objectives
By the end of this workshop, you will be able to:
- How to use Cursor Chat for real data analysis
- Build a workflow from data loading to visualization
- Debug errors using AI conversation
- Iterate and improve code through prompts
Time Breakdown:
| Time | Activity |
|---|---|
| 0–5 min | Step 1: Load & Inspect Data |
| 5–10 min | Step 2: Clean Data |
| 10–15 min | Step 3: Summary Statistics |
| 15–25 min | Step 4: Create Visualization |
| 25–30 min | Debugging Tips & Next Steps |
What You Need
Cursor (Required)
- Free IDE from cursor.com
- Download and install (free tier should work great for now)
- Chat shortcut:
Cmd+L(Mac) orCtrl+L(Windows/Linux)
Data — Palmer Penguins Dataset
Preview of the data we’ll work with:
| species | island | bill_length_mm | bill_depth_mm | flipper_length_mm | body_mass_g | sex | year |
|---|---|---|---|---|---|---|---|
| Adelie | Torgersen | 39.1 | 18.7 | 181 | 3750 | male | 2007 |
| Adelie | Torgersen | 39.5 | 17.4 | 186 | 3800 | female | 2007 |
| Adelie | Torgersen | 40.3 | 18.0 | 195 | 3250 | female | 2007 |
| Chinstrap | Dream | 46.5 | 17.9 | 192 | 3500 | female | 2007 |
| Gentoo | Biscoe | 46.1 | 13.2 | 211 | 4500 | female | 2007 |
📊 344 rows × 8 columns 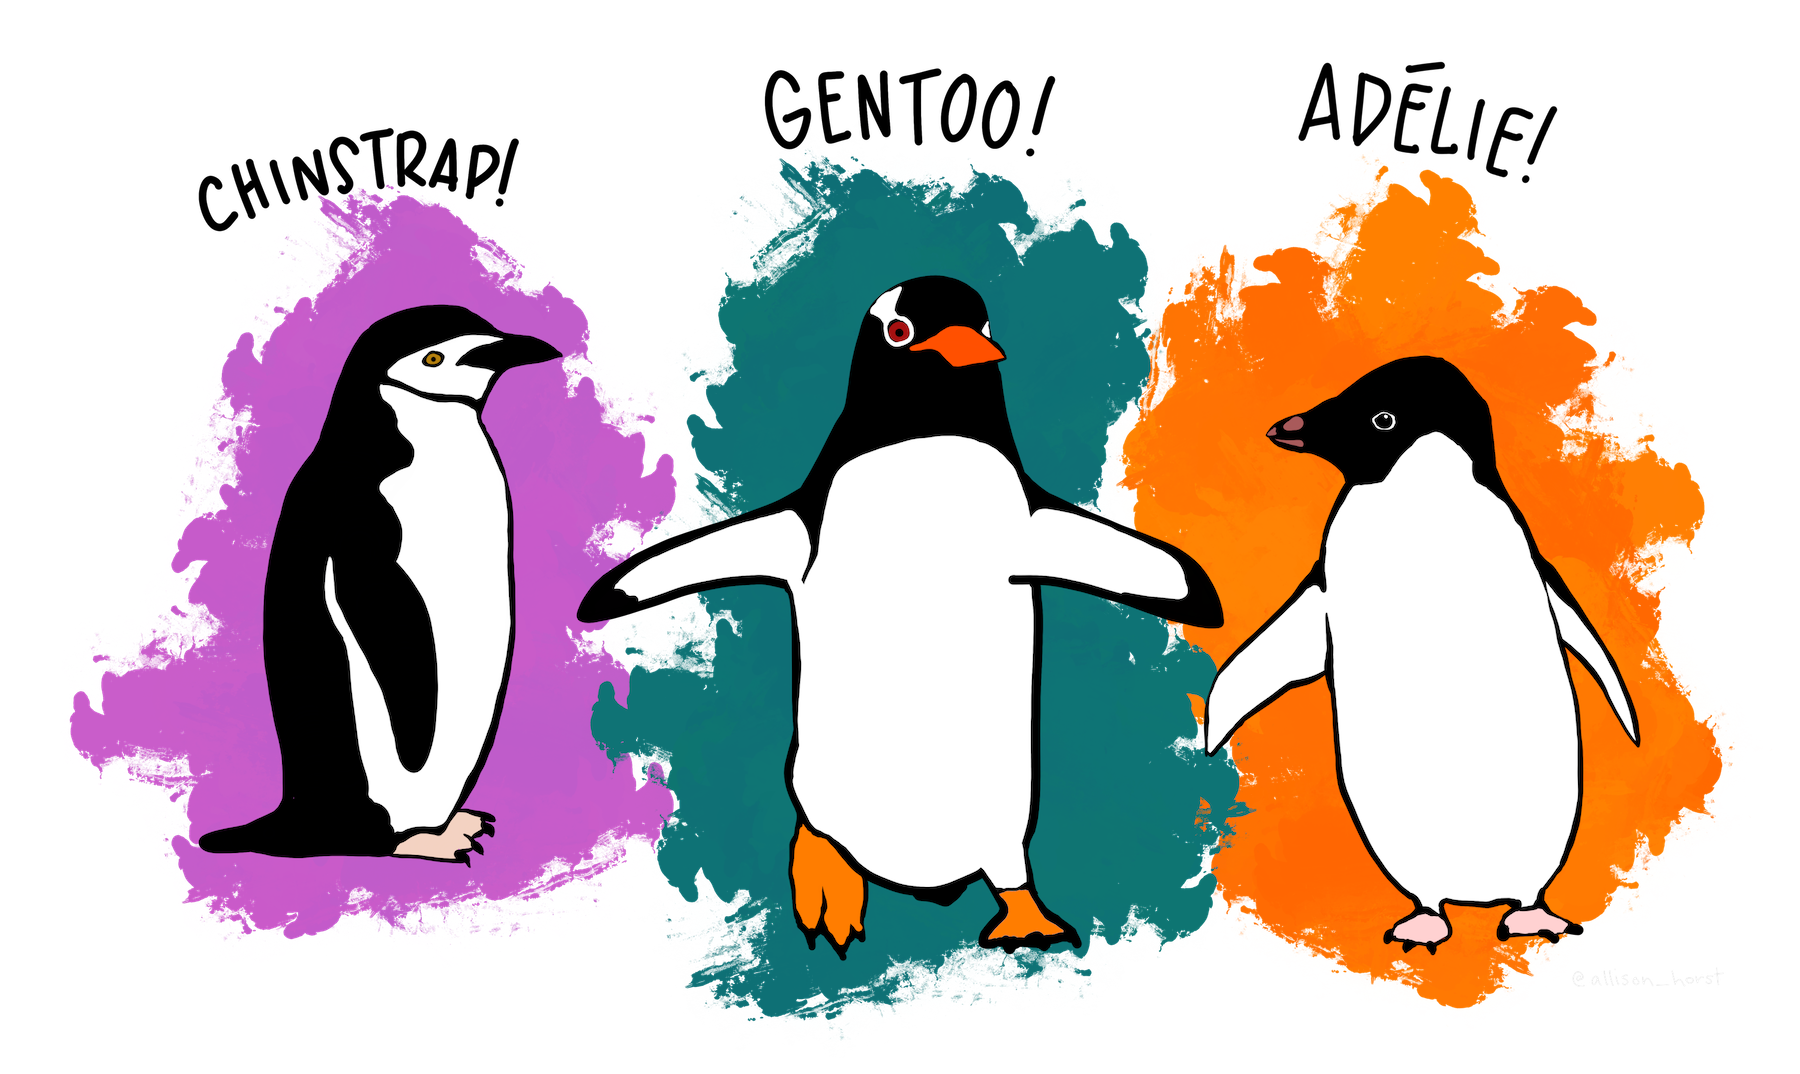
📚 Source: Palmer Penguins R Package — Learn more about the dataset
🎨 Artwork: Palmer Penguins Illustrations by @allison_horst
Quick Setup
![]()
- Download Cursor from cursor.com
- Install and open it
- Sign in with an account
- Press
Cmd+L(Mac) orCtrl+L(Windows) to open Chat - You’re ready to start!
Quick Start Workshops
- Pick Workshop 1: Fundamentals and spend 30 minutes on it
- Come back for Workshop 2: Data Analysis & Visualization when you’re ready
- Finish with Workshop 3: Building with AI
Each one builds on the previous, but you can jump around if you want.
Loading last updated date...