Animated and Interative plots
This code can take time to run, so we will go through it here instead of in RMarkdown.
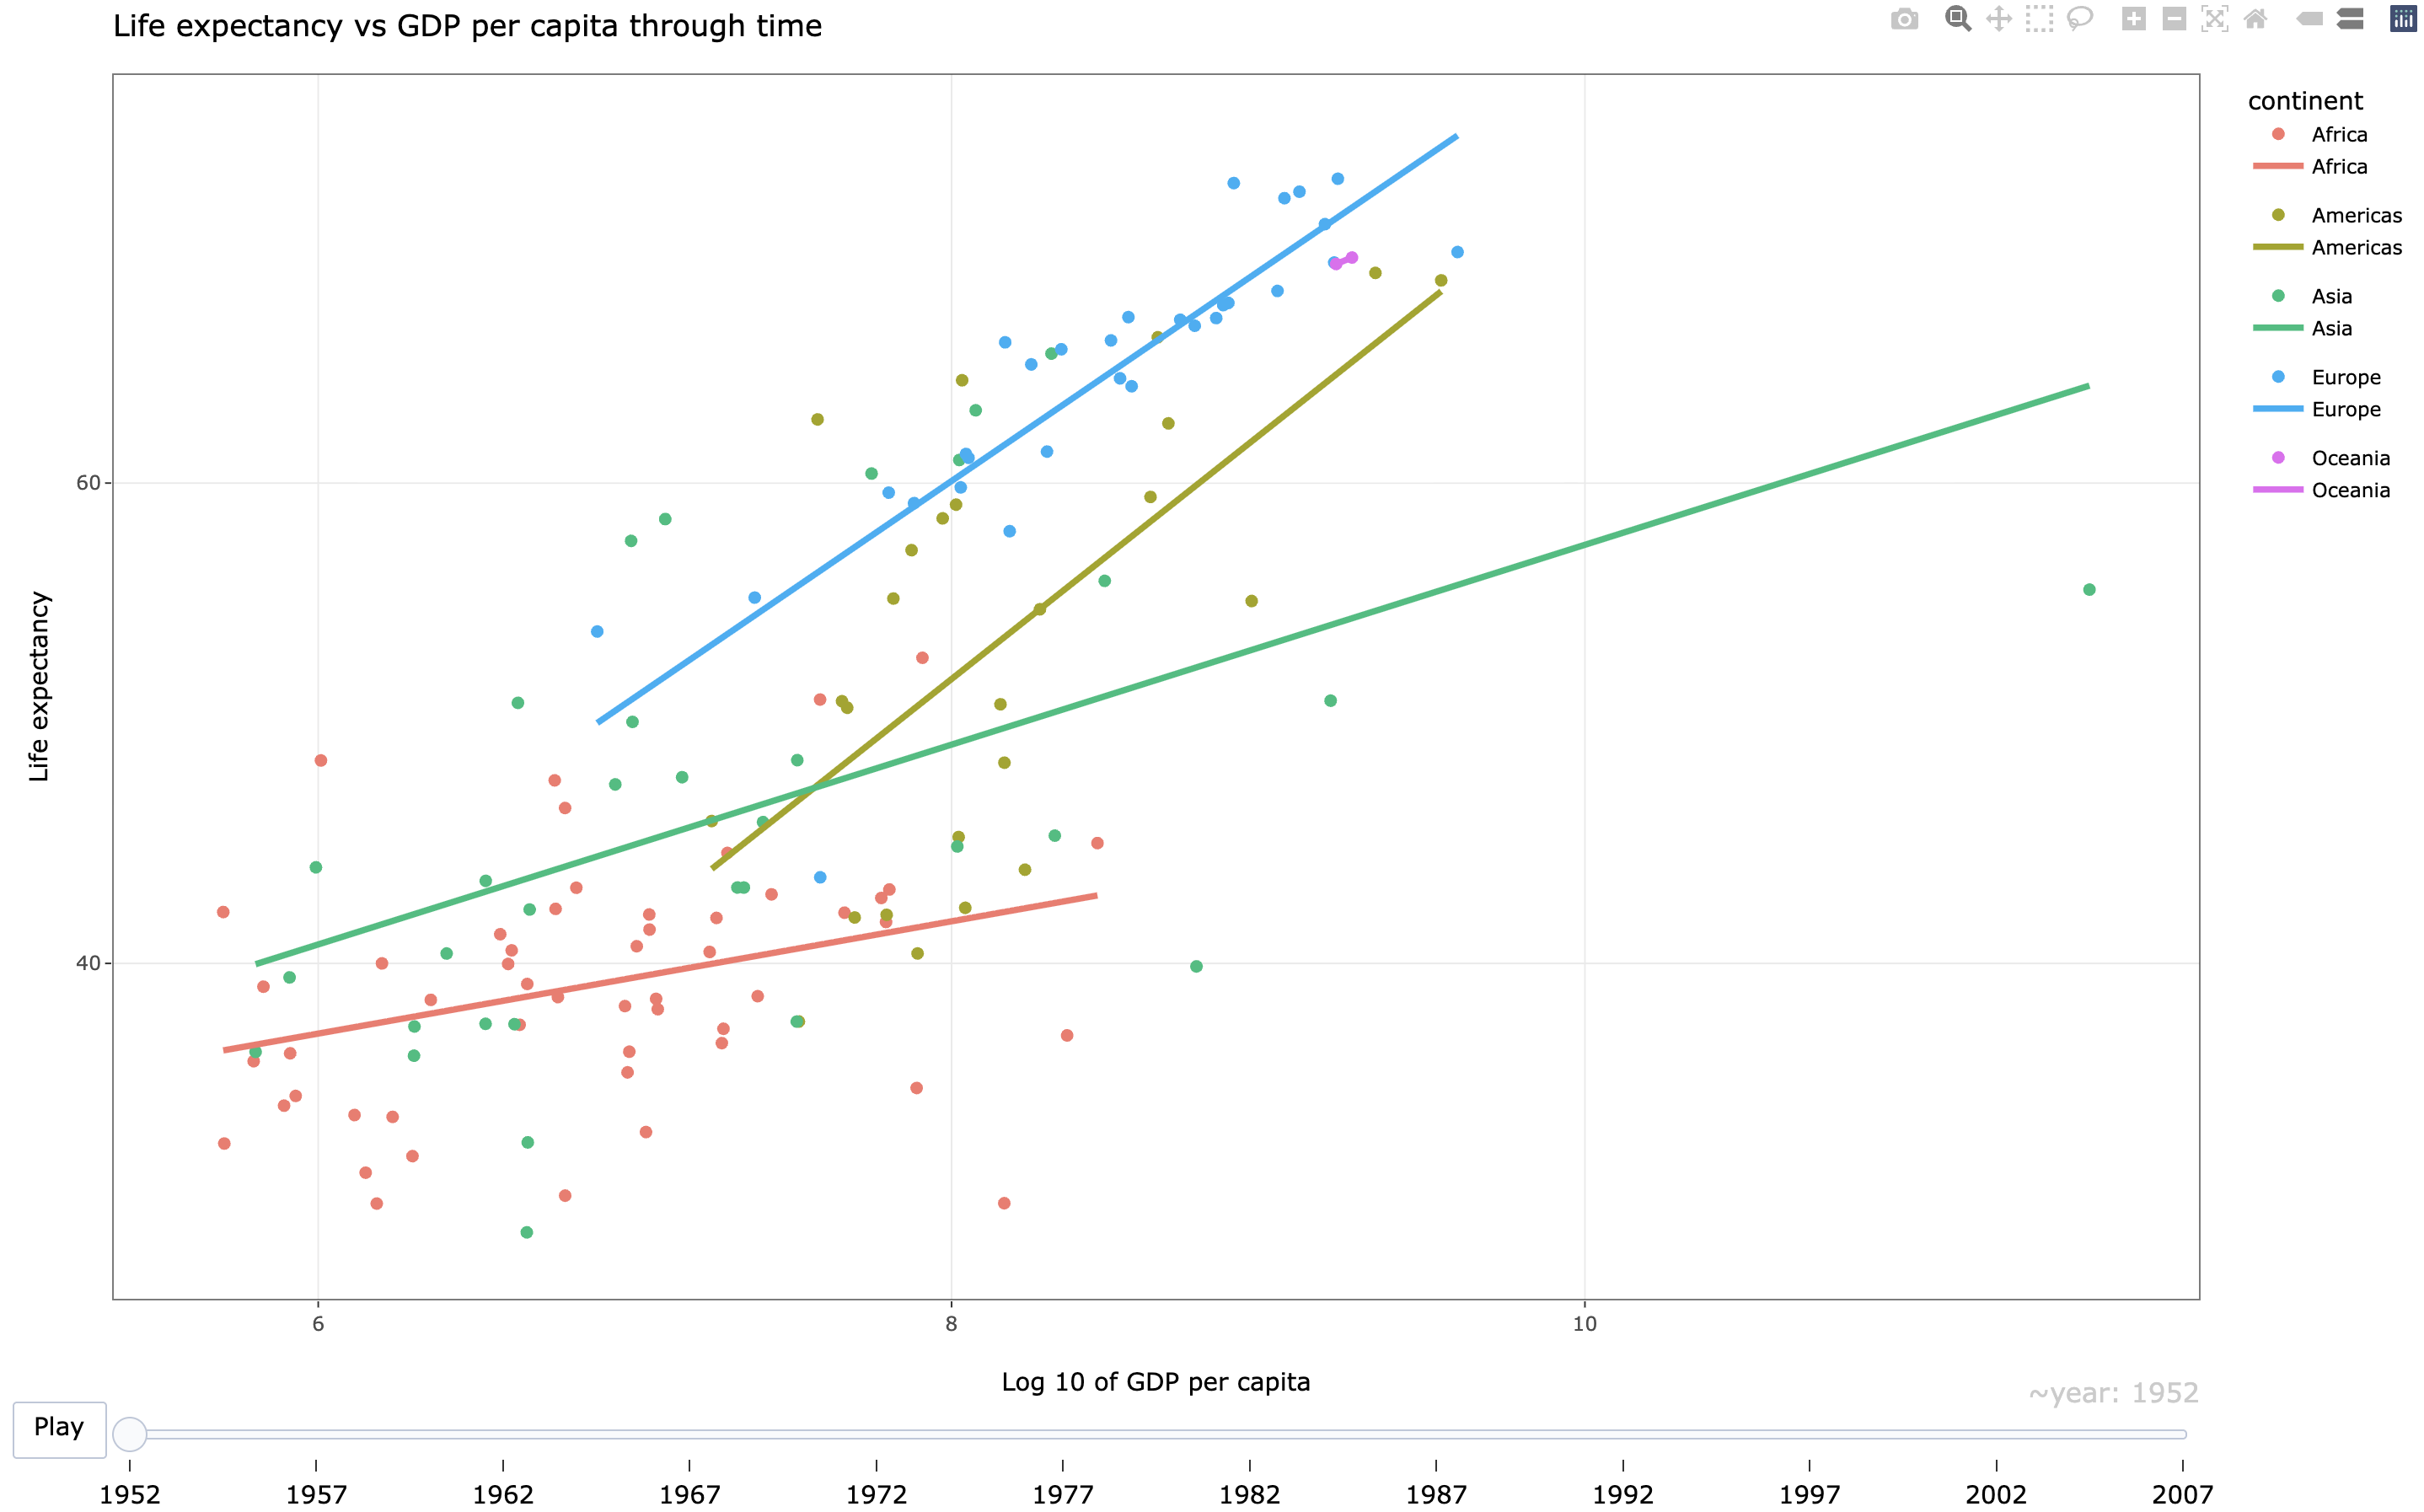
We are going to make a plot with a slider. This allows users to interact with the plot, which is very fun. If you want to learn more about this, you can check out our workshop on how to make RShiny
#Nice to have packages
library(gganimate) # package for producing gifs, extension of ggplot2
library(plotly)
library(gganimate)
library(gifski)
library(htmlwidgets)

## plot code
plot1 <- ggplot(aes(
  x = log(gdpPercap),
  y = lifeExp,
  frame = year
), #adding frame to aes
data = countries) +
  geom_point(aes(color = continent)) +
  labs(title = "Life expectancy vs GDP per capita through time",
       x = "Log 10 of GDP per capita",
       y = "Life expectancy") +
  geom_smooth(aes(color = continent), method = "lm", se = FALSE) +
  theme_bw()

ggplotly(plot1)

#save the object as an html file, using htmlwidget package
plotly1 <- ggplotly(plot1)
saveWidget(as_widget(plotly1), "plotly1.html")
Loading last updated date...