Practice adding another dataset
Practice what you’ve learned in this workshop by choosing a new dataset from Toronto’s open data portal to add to your web map. You will need to download the dataset in GeoJSON format, move it to your webmapping-workshop/Part2 folder, wrap it as a JavaScript variable, and add it as both a data source in the <head> element and as a data layer in your <script> element.
Take a moment to practice on your own. Reference the hints below if you get stuck.
1 For example, download Toronto Public Libraries from the Open Data Portal. (The newest dataset is called Library Branch General Information.)
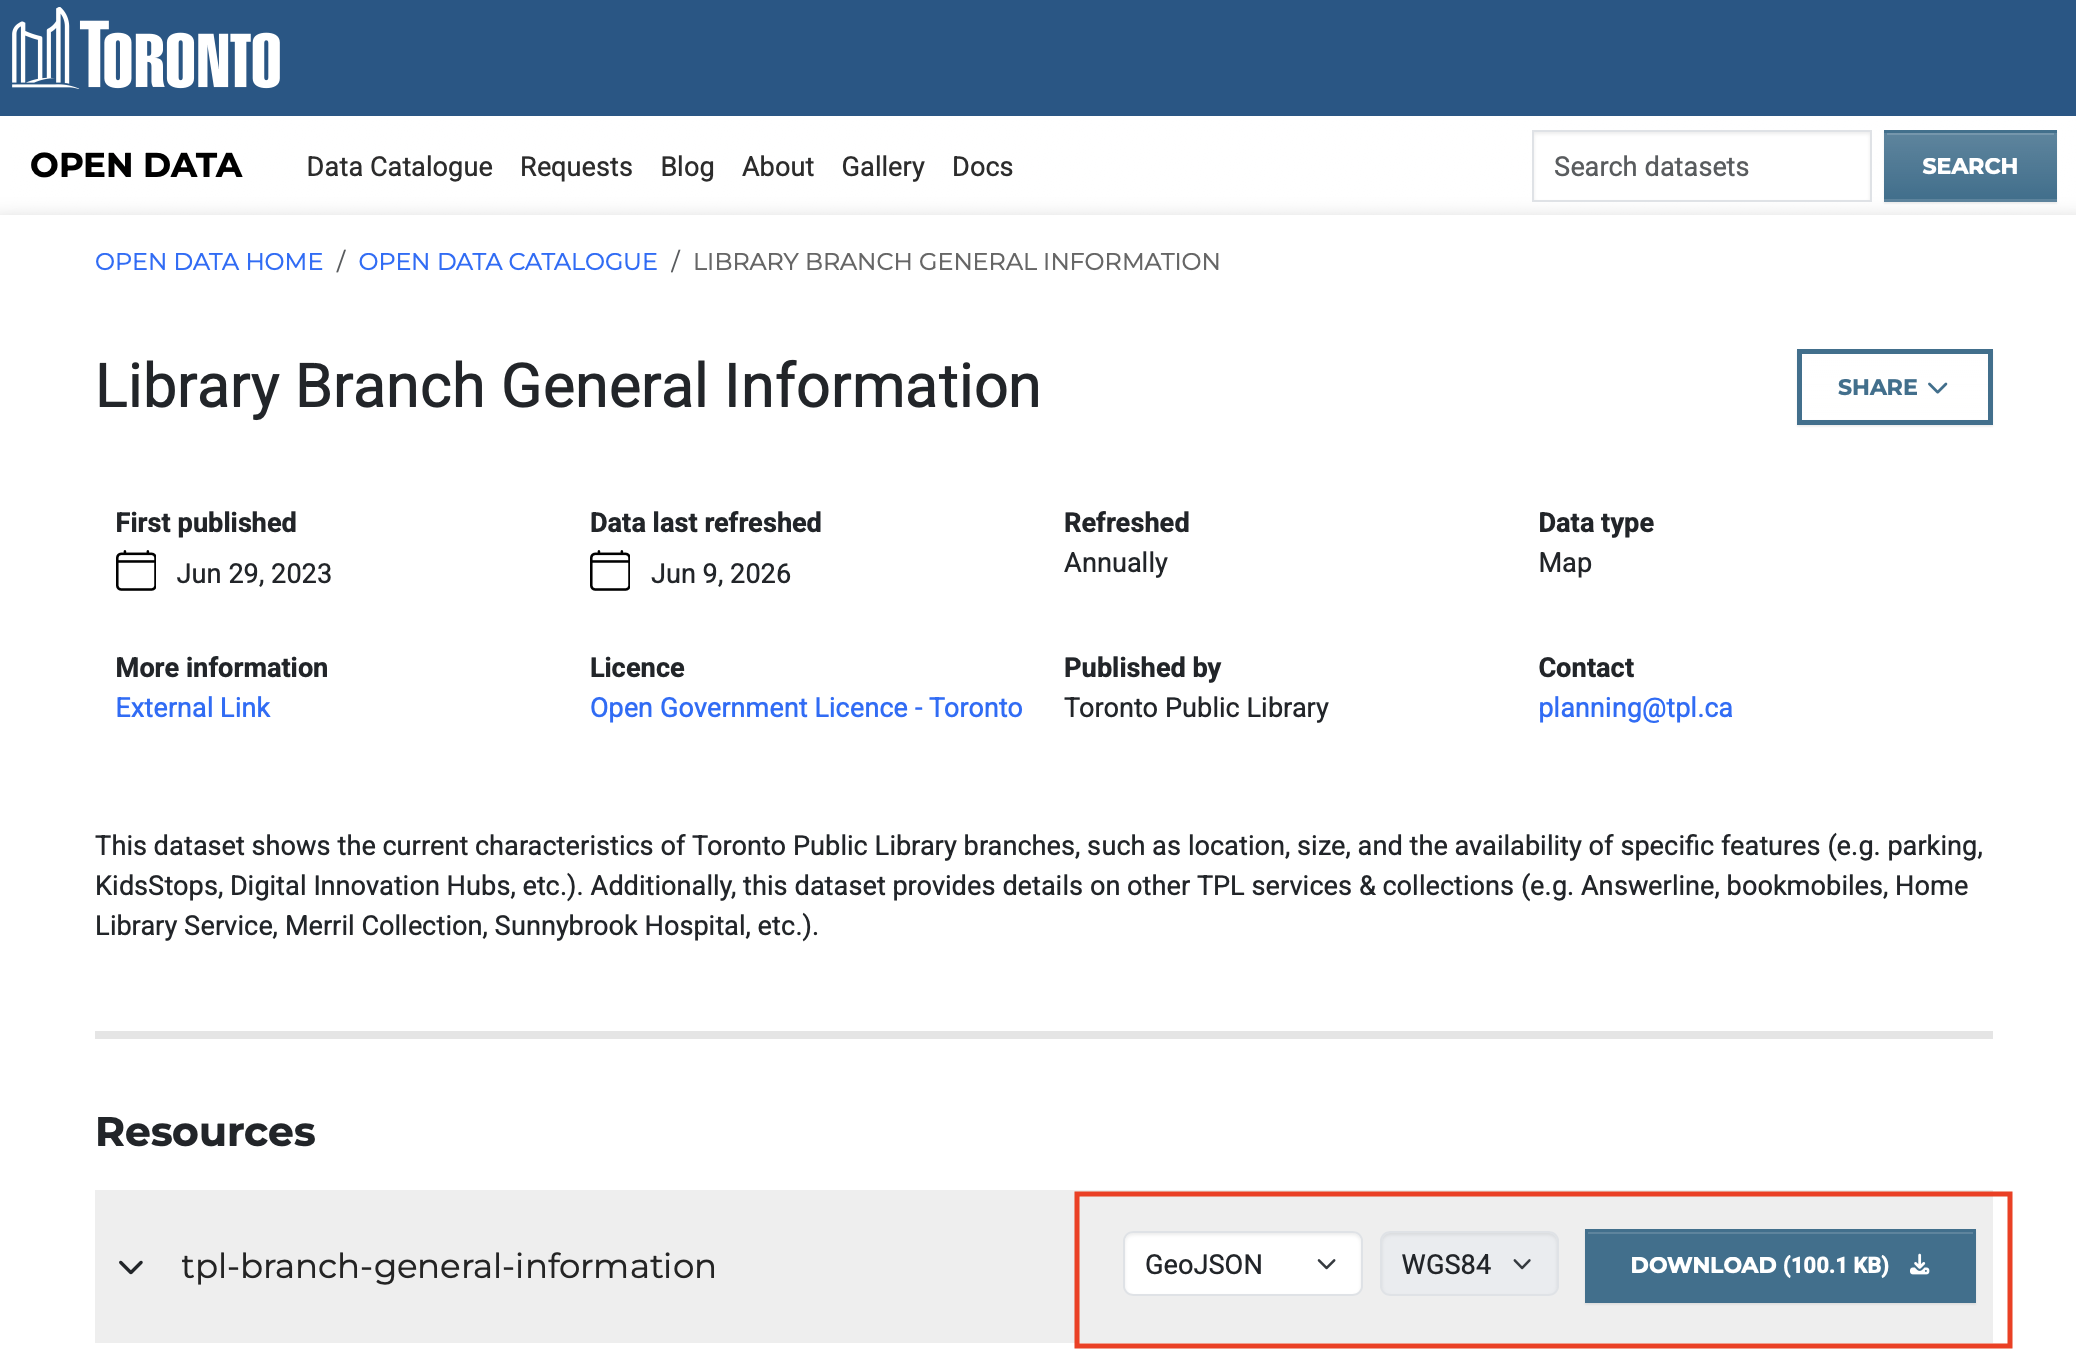
- Be sure to export the dataset in
GeoJSONformat and inWGS84, which happens to be the only available Coordinate Reference System anyway.
- Move the download file,
tpl-branch-general-information - 4326.geojson, to your workshop folder. It’s important your data be in the same folder of your web map’s HTML document.
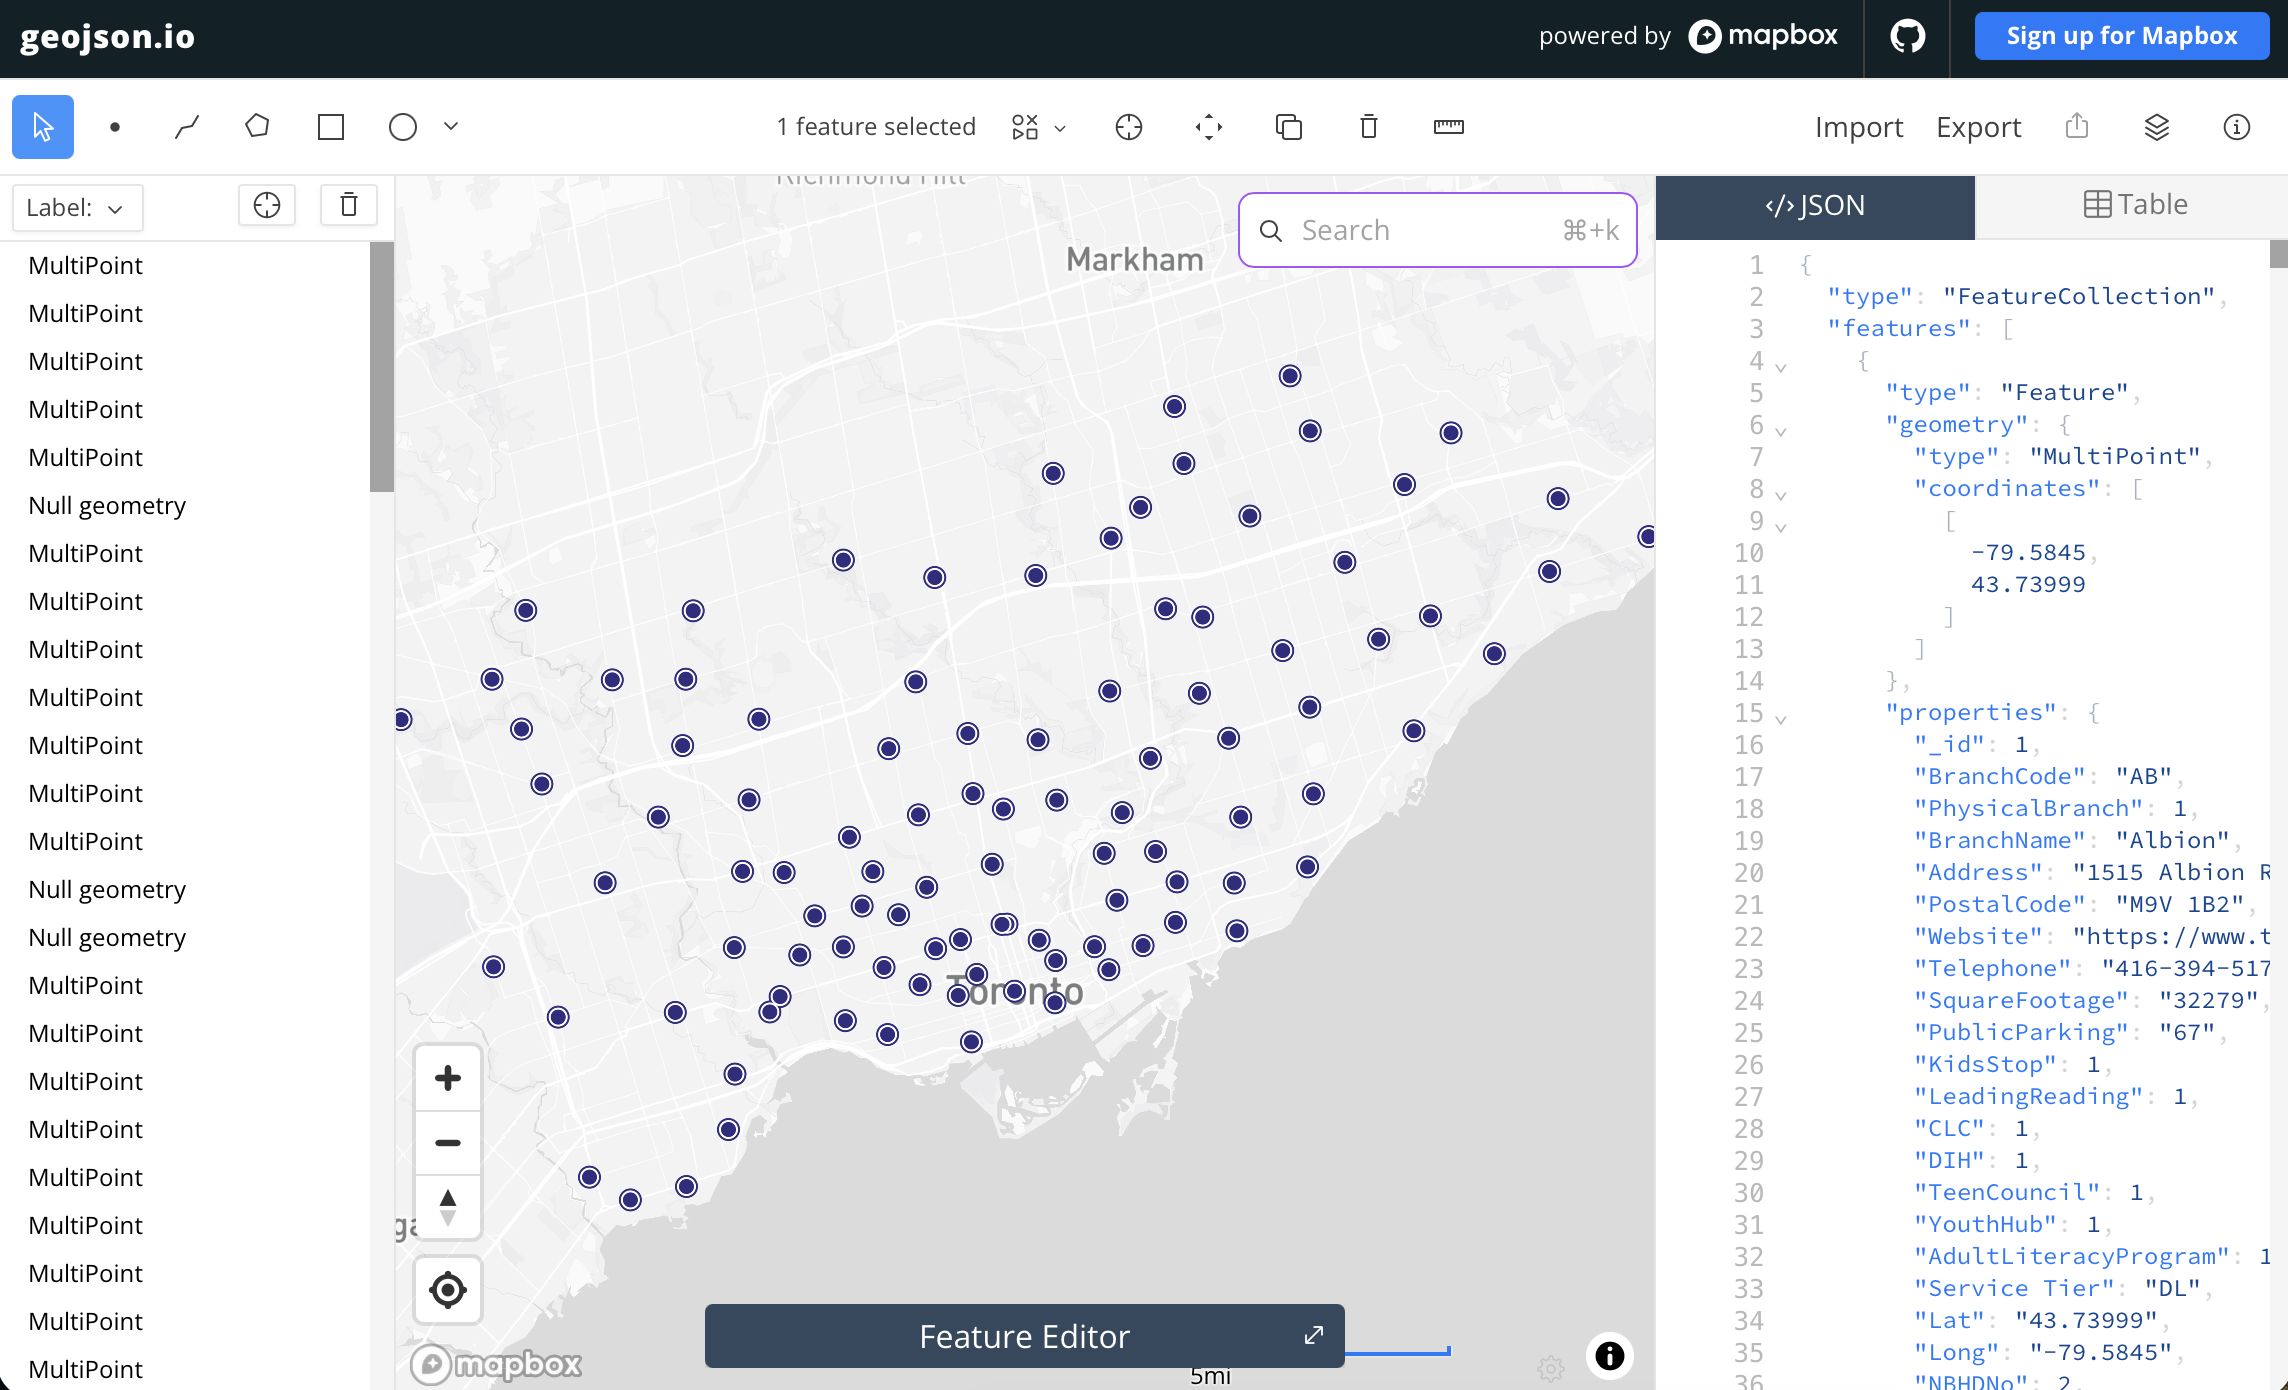
Remember, you can always quickly import your new dataset to geojson.io to check the dataset.
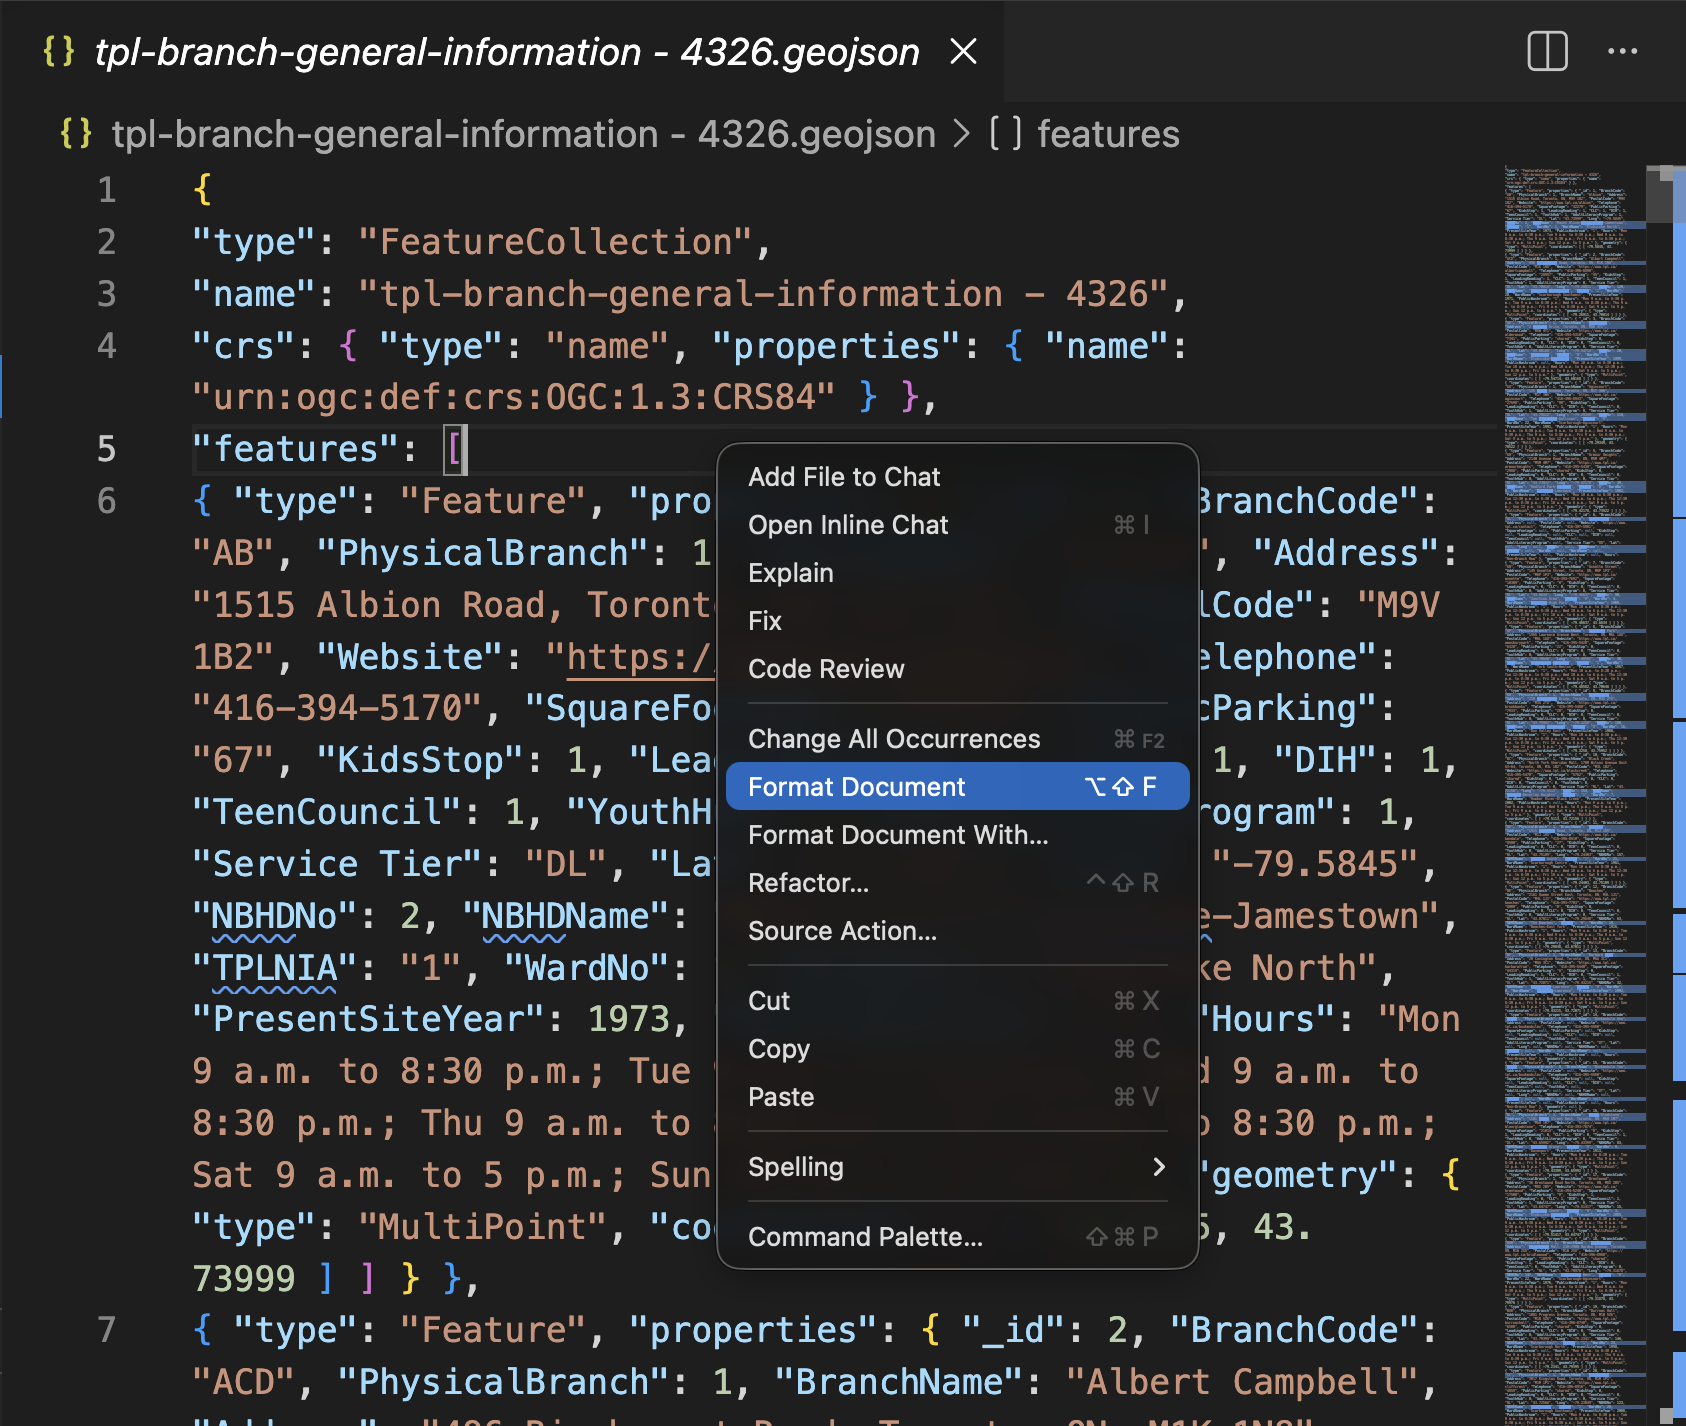
2 Open the dataset in VSCode. It will either appear in your Contents after you add it to your working folder, or you can right-click it from your computer and open it with VSCode.
- It will look like a wall of code. Right-click anywhere on the page and select “Format Document” to format it.
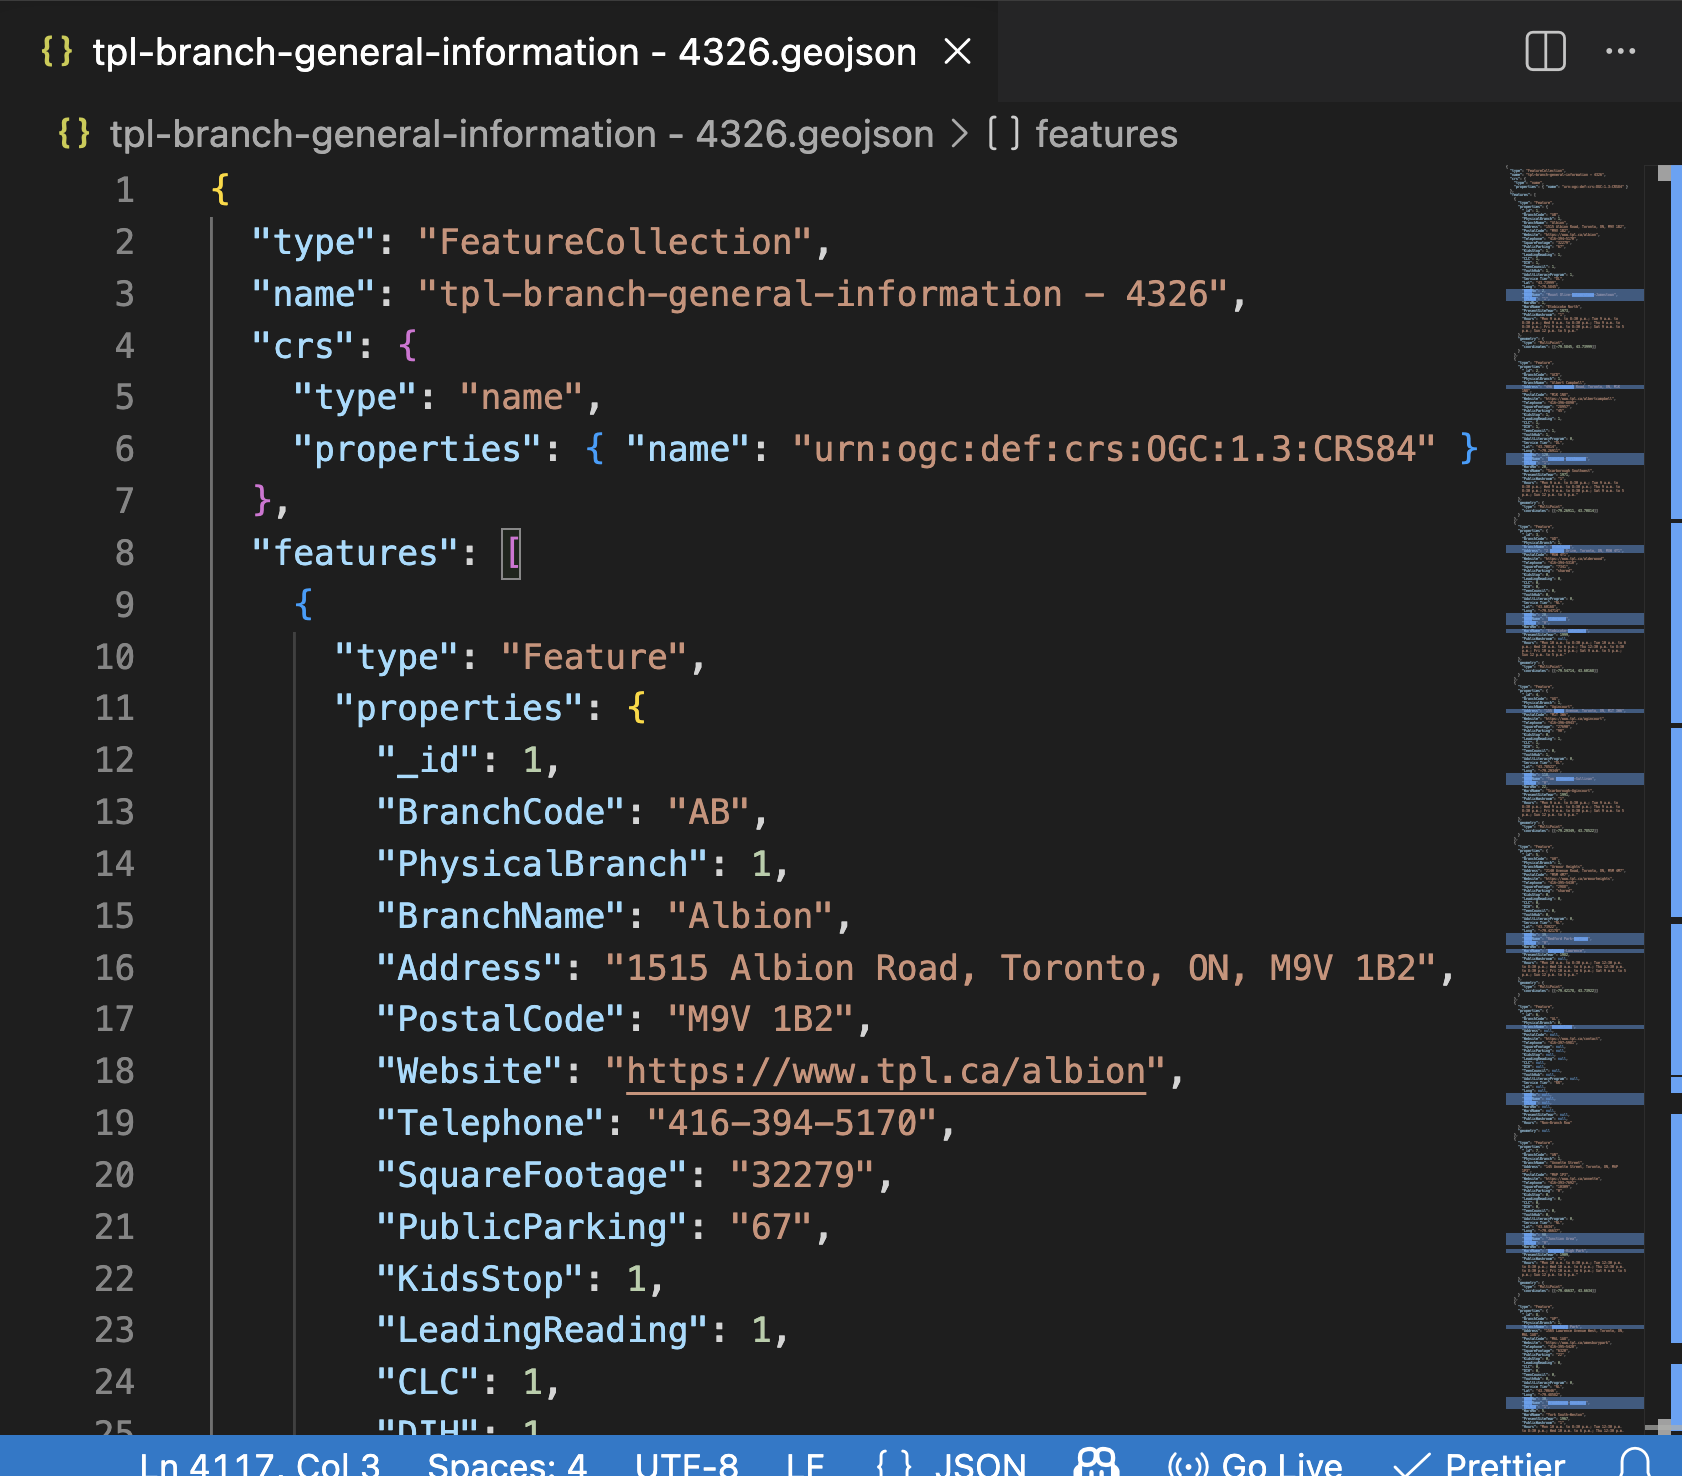
3 Now wrap it as the variable TPL by adding var TPL = in front of the entire dataset.
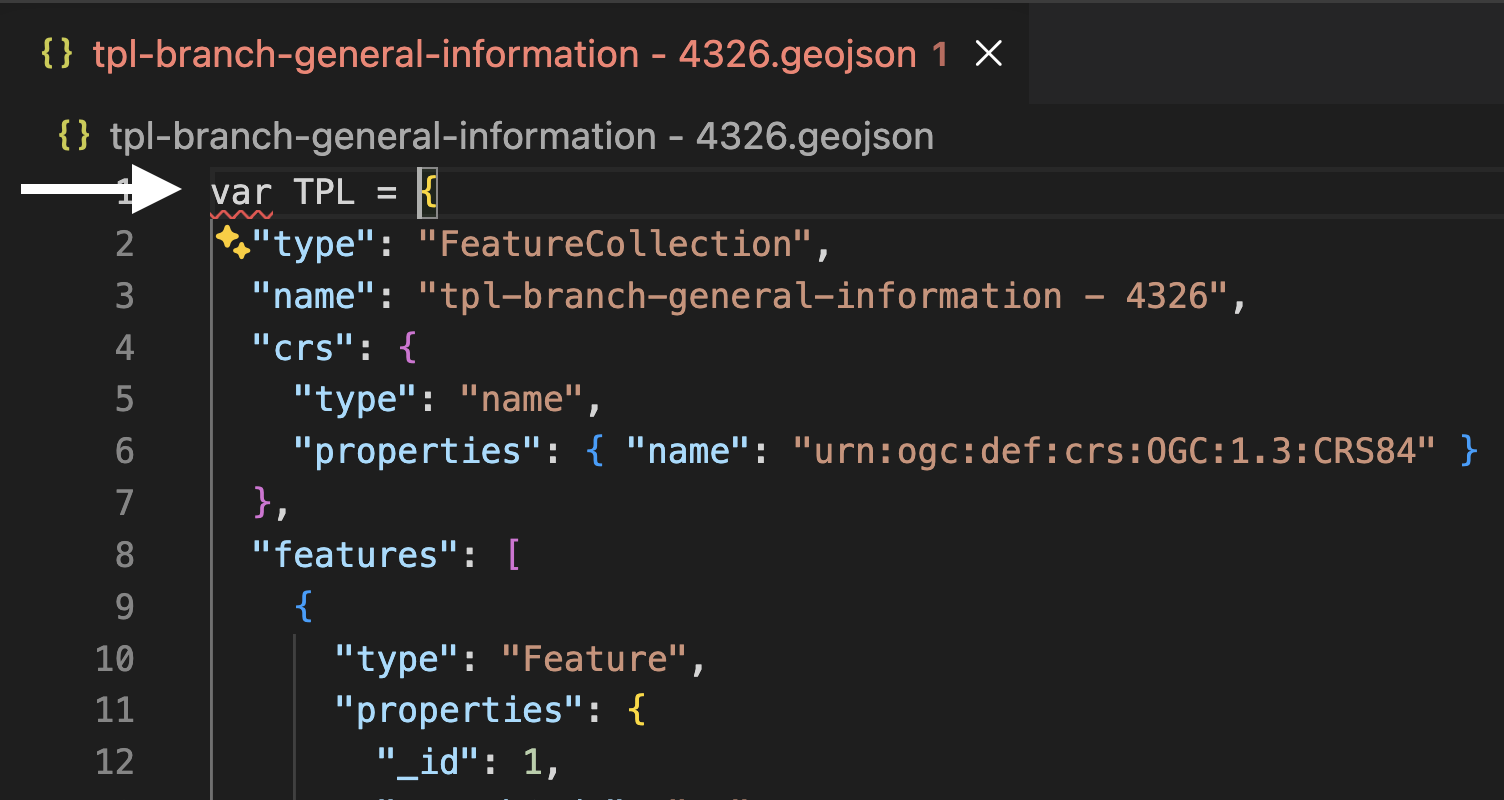
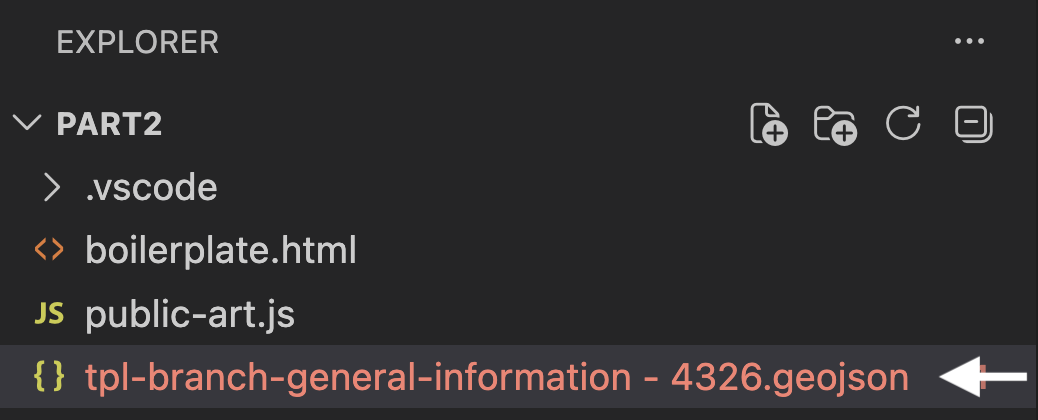
You’ll notice the name of the document becomes red, signifying there’s a syntax error somewhere in the document. There isn’t. Rather, you have formatted the document as JavaScript, but the file extension is still GeoJSON.
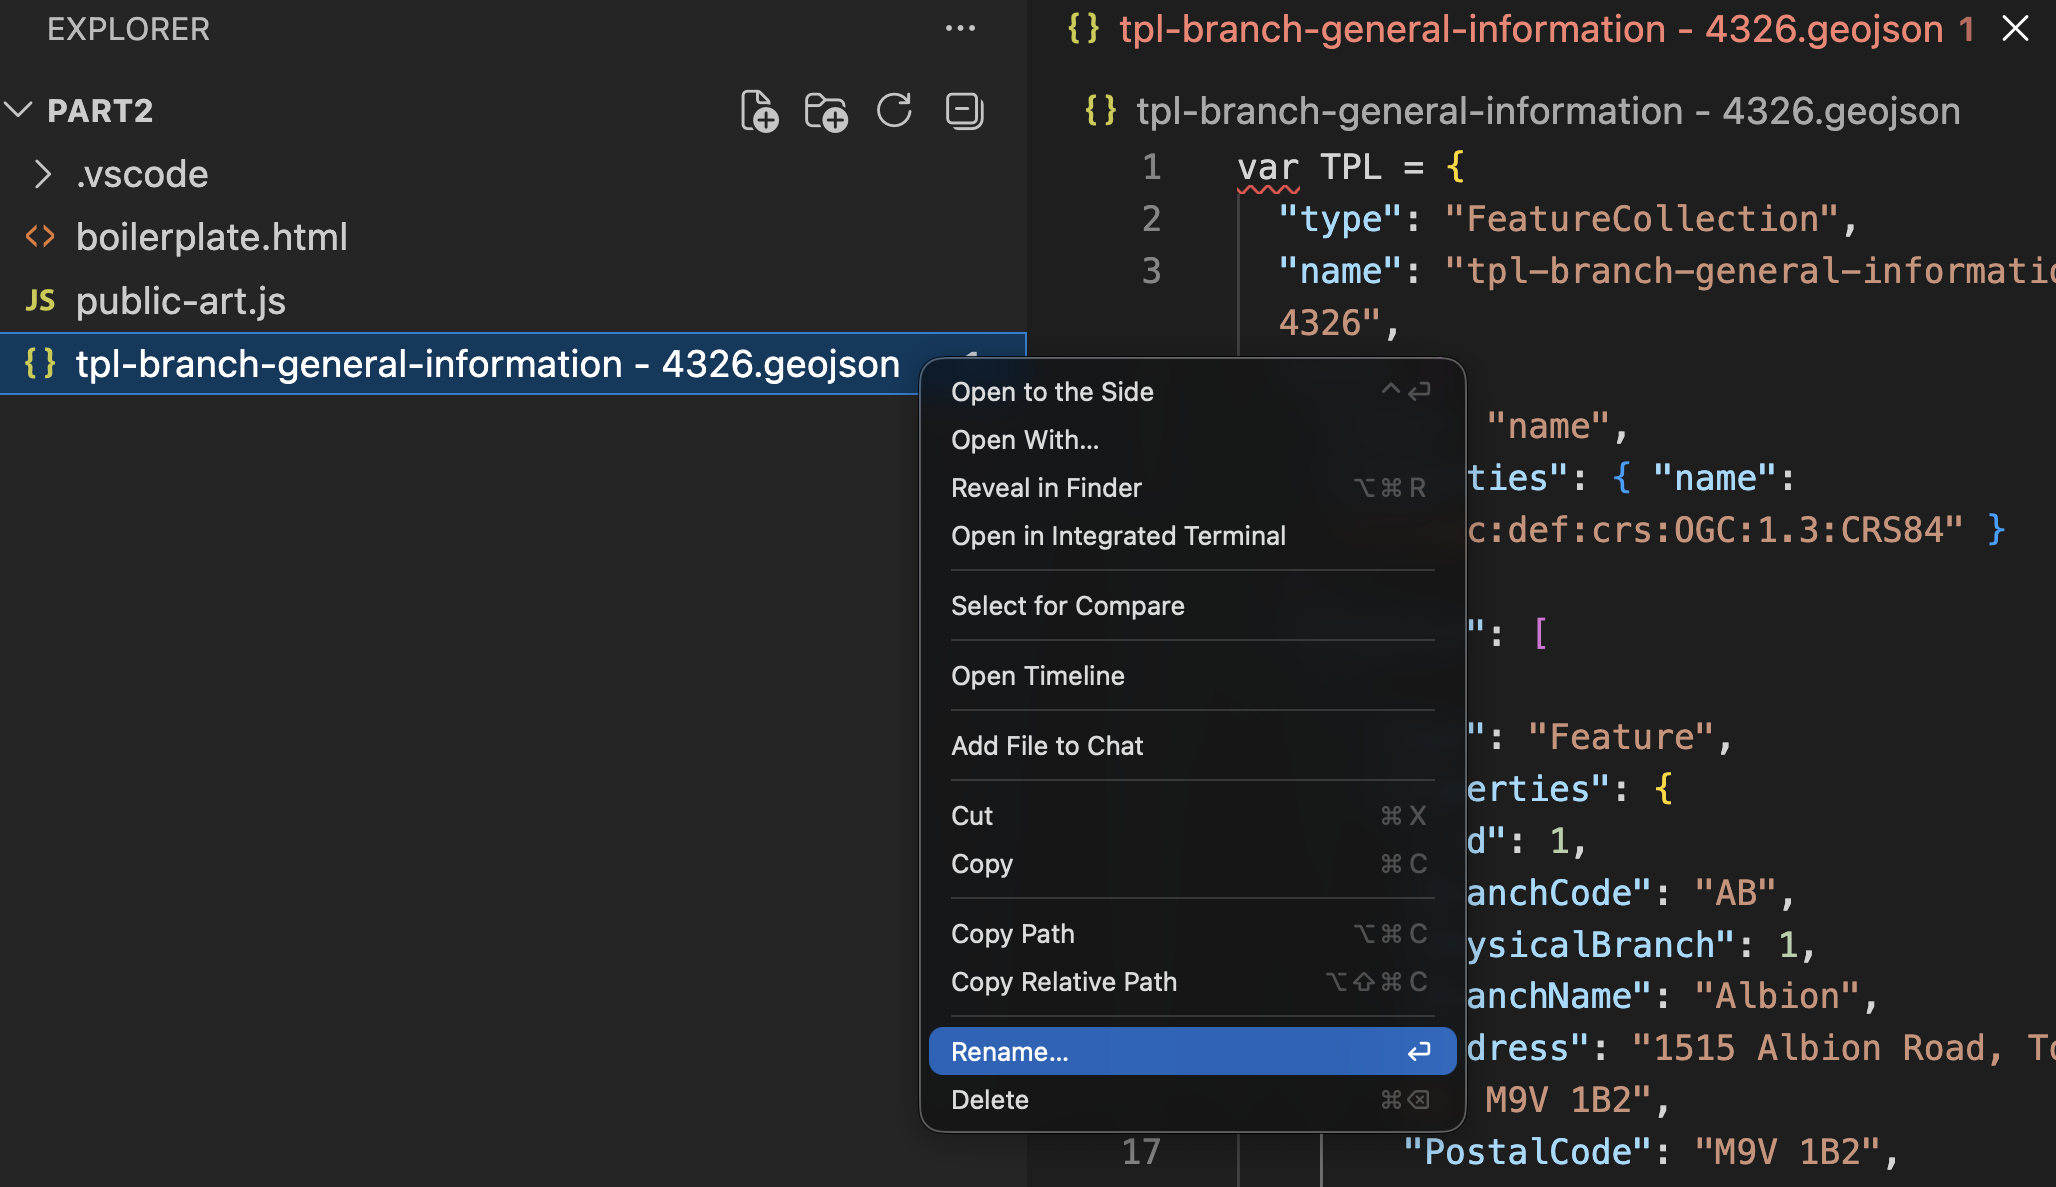
4 Rename the file with the proper extension: .js. You can do this by simply right-clicking the file in VSCode and choosing to rename it. Then simply replace the extension with .js.
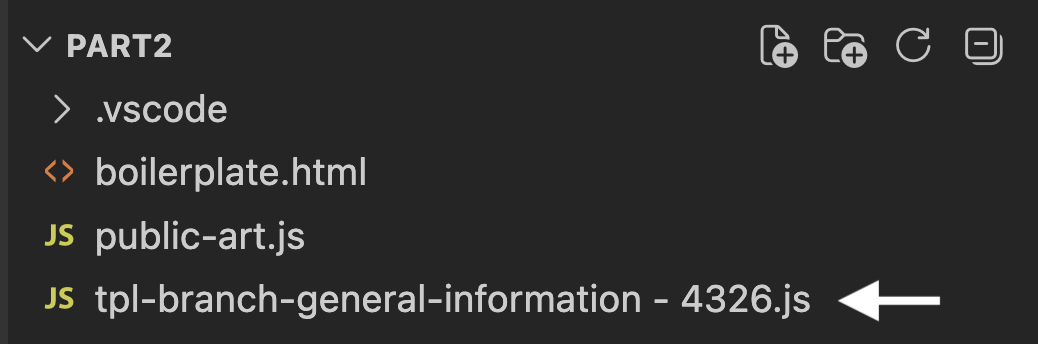
Everything should be in order now with no warnings.
5 Now, return to your boilerplate.html document in VS Code. In the <head> tag, add a line beneath your current data sources that directs your map to your libraries data:
<script src="./tpl-branch-general-information - 4326.js" charset="utf-8"></script>
6 Then, in the <script> tag of the body element, add a function to add your second data source as a layer:
L.geoJSON(TPL).addTo(mymap);
7 Save your HTML file and go to your Live Server. You should see your data layer added to the map.
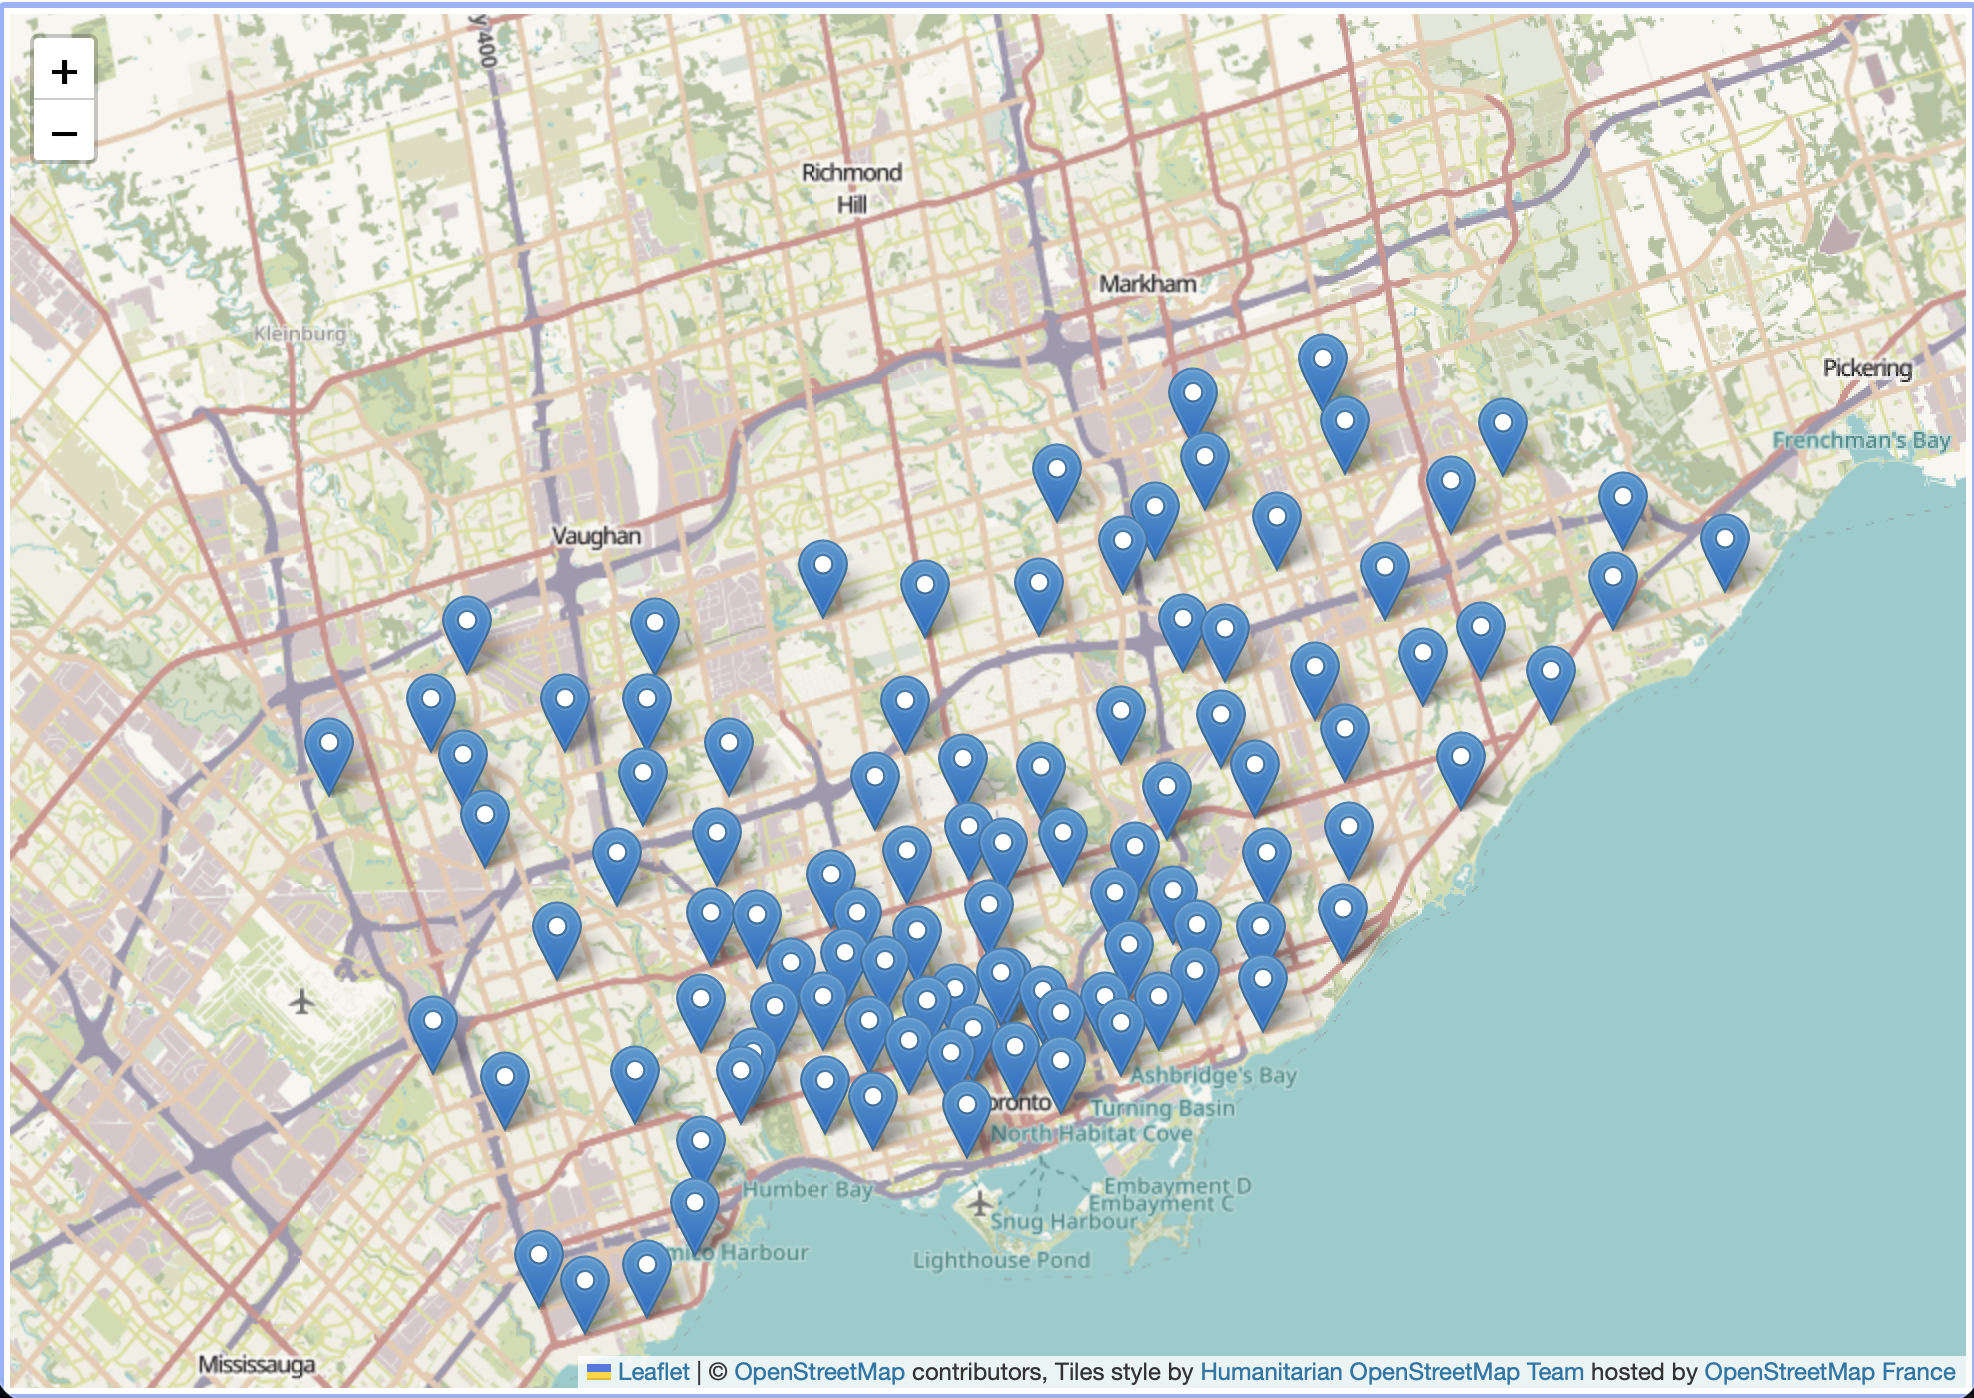
You can now experiment with adding pop-ups for the libraries.
Note about point data
If you are exporting point data in geoJSON format from QGIS, make sure to check in VSCode that the dataset is saved as type:points, and not type:multipoints. Pop-ups will disappear upon clustering unless the original dataset is type:points. If your data is type:multipoints for some reason, you can easily force it to become type:points by running the Centroids tool on your (already) point data inside QGIS.
Loading last updated date...