Next Steps
If this workshop has inspired you to expand your skills, try making another map on your own using data for a different location. This will clarify where you might have some gaps in understanding.
If you want to be able to share your Leaflet map via a link, just like the maps you made with Google MyMaps and uMap, the documentation below will guide you in hosting your Leaflet map with GitHub.
On this page:
Hosting a webmap with GitHub
As is, your webmap is a folder of files on your computer. You can open it locally, but no one else can access it unless you send them the folder to download to their own computer. This is where web hosting platforms come in. If you upload this folder to a cloud service then you can make the map viewable in web browsers anywhere with internet connection (and no access restrictions).
If you have a website and access to local server, that’s an option too. However, if not, GitHub is a low-barrier solution. GitHub is an internet hosting service that allows you to upload files into a repository, or project folder, where they can be shared and collaboratively tracked and edited by a team. This makes it quite popular amongst code developers. Conventionally, you’d work between your local computer and the web account, tracking changes as you go with git, a file control software. (See the Research Common’s introduction to git and GitHub for more.) However, we can work directly and exclusively from the web interface. The steps to host your dynamic on the web using GitHub are as follows:
- Create a free GitHub account
- Make a new repository
- Upload your data folder to the repository
- Create an index file
- Generate a GitHub page
Let’s take this step by step…
1. Create a Github account
Go to github.com and create a free Github account.
2. Make a new repository
Once you’ve made an account, go to Repositories.
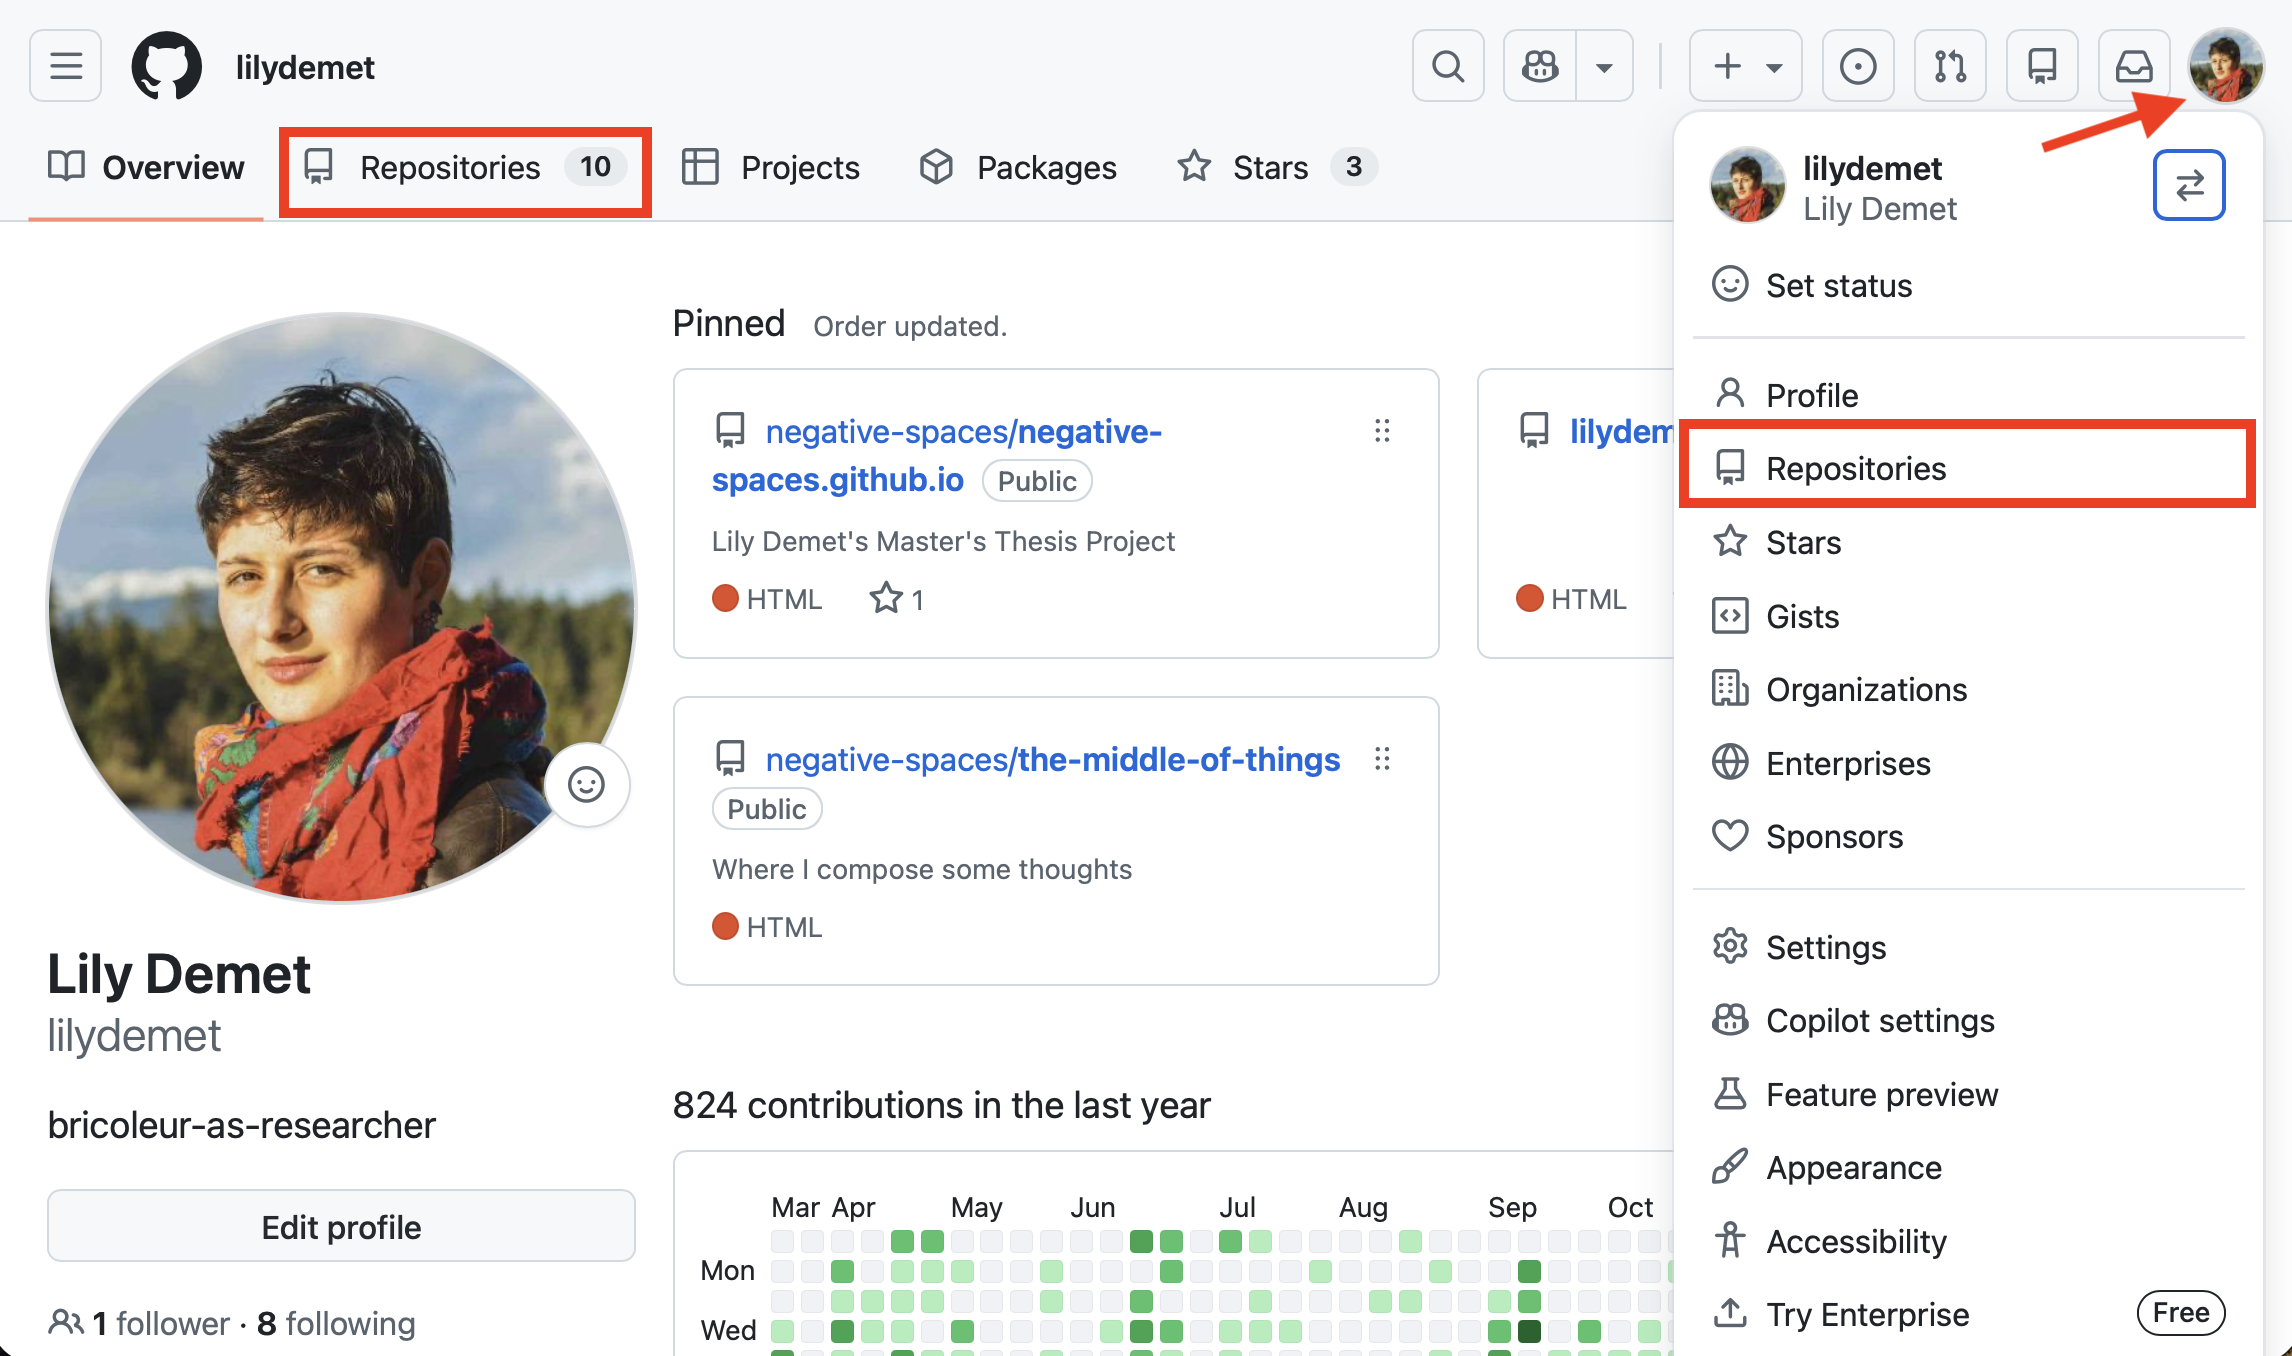
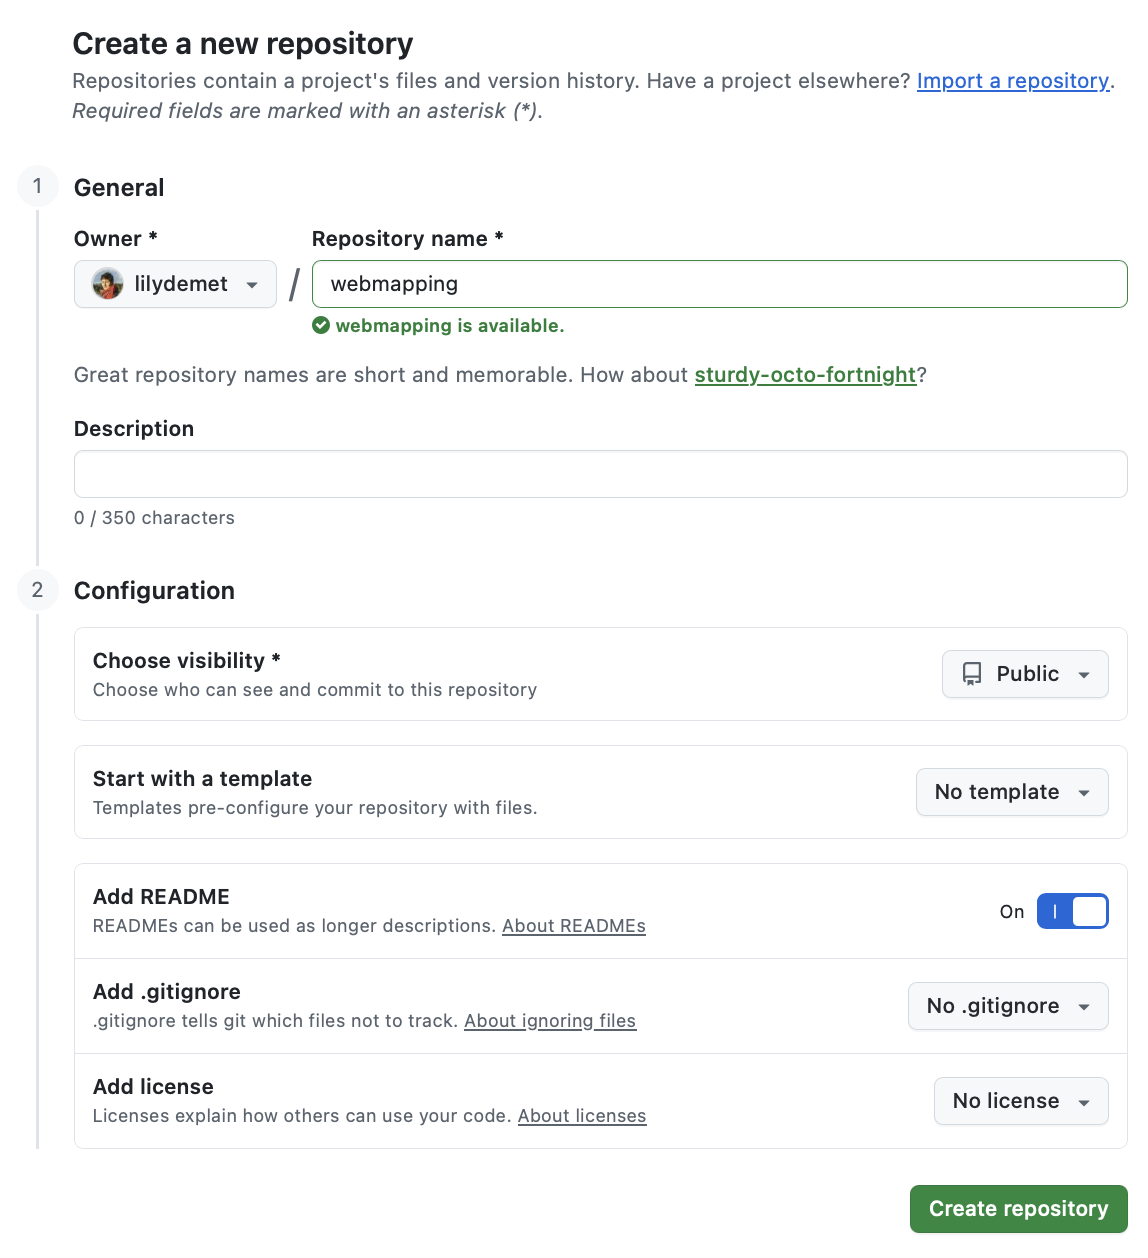
Create a new repository (also known as a “repo”). A repository is like a folder that contains a project.
- Call the repository
webmappingfollowed by your initials.
- Set the visibility to Public.
- Add a README.md. This is where you can give a brief description of what the project is, and credit your data sources.
- When working on your own projects, if you choose to set a license at this stage, ensure you have permissions to use all the data you do in the way you are licensing it. Never upload confidential datasets to a publicly visible Github repository.
- Scroll down to the bottom and Create repository.
3. Upload your webmap folder to your repository
IMPORTANT: We will be uploading the contents of the Leaflet-webmapping subfolder only.
- Drag and drop the contents of the
Leaflet-webmappingsubfolder.
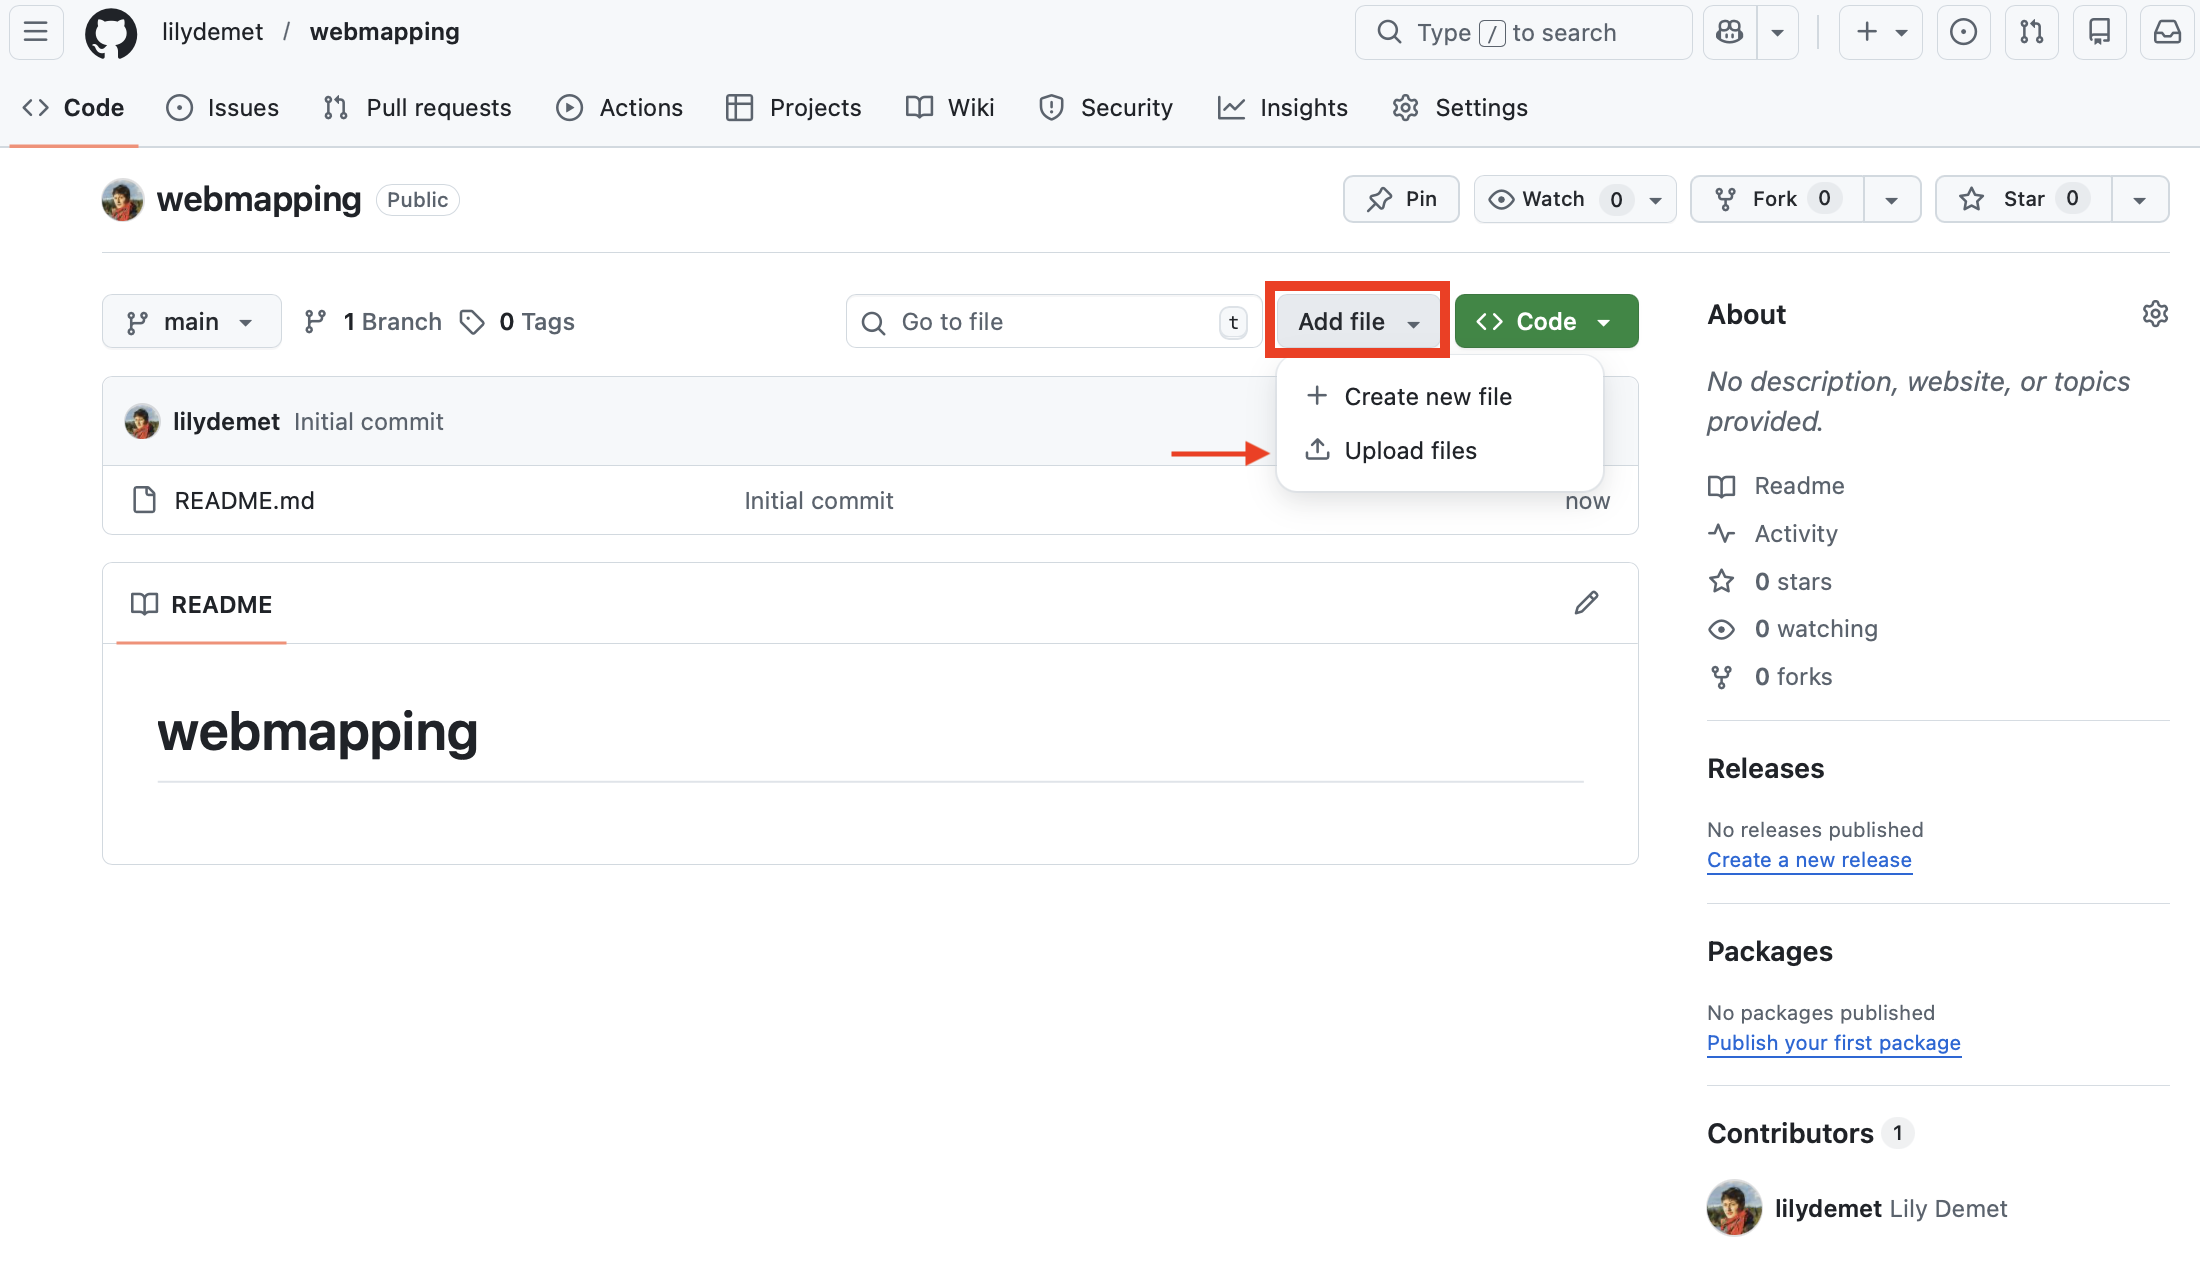
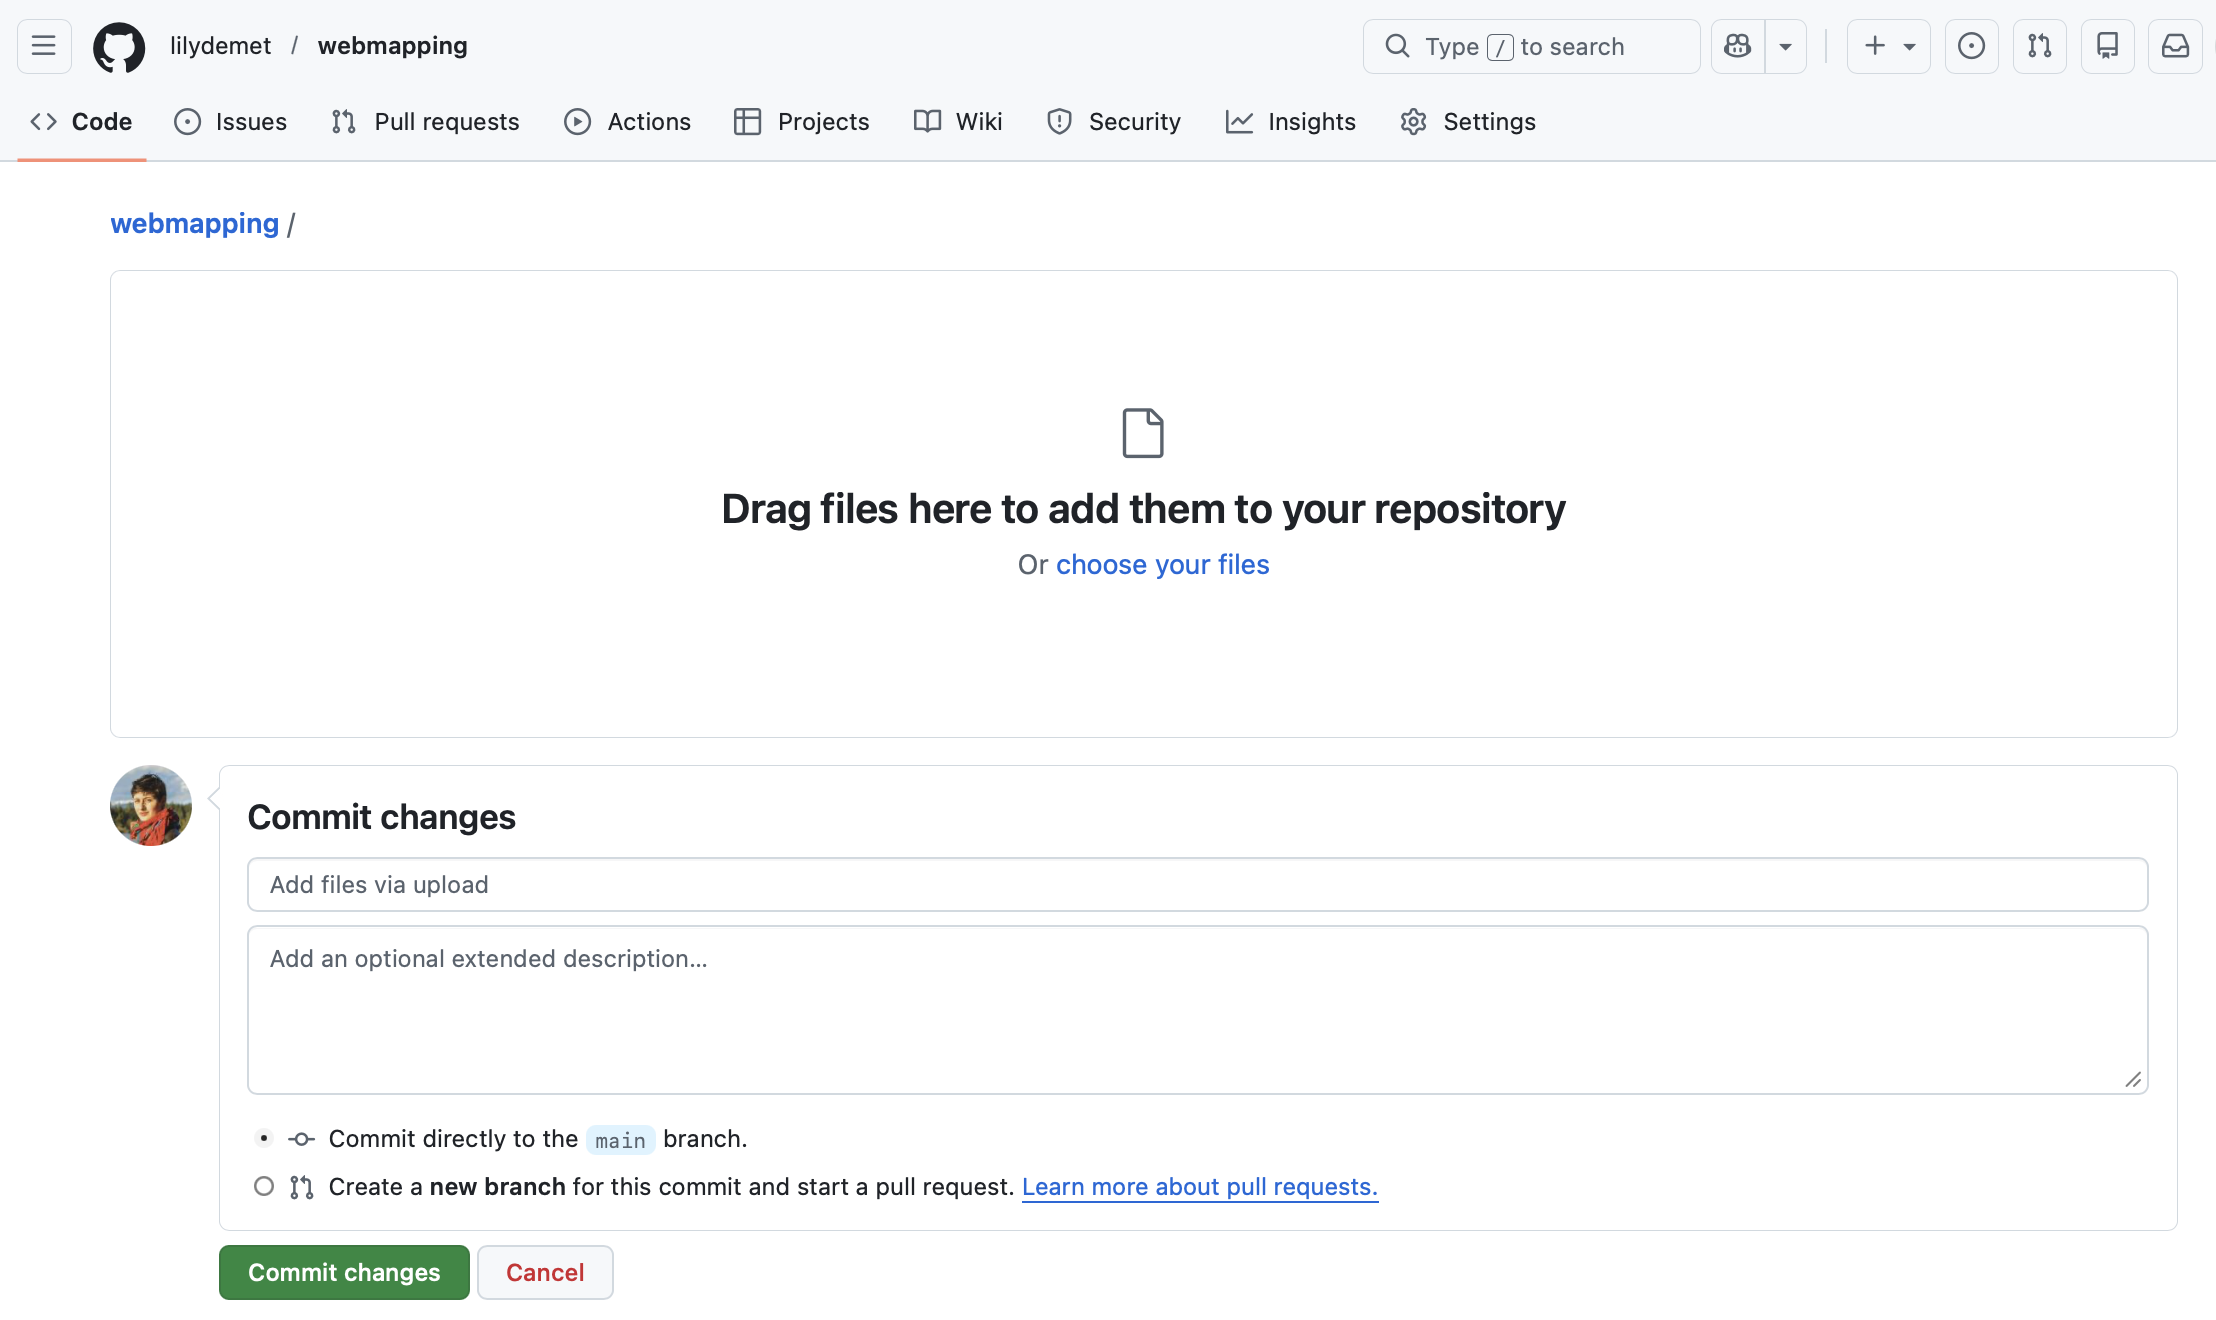
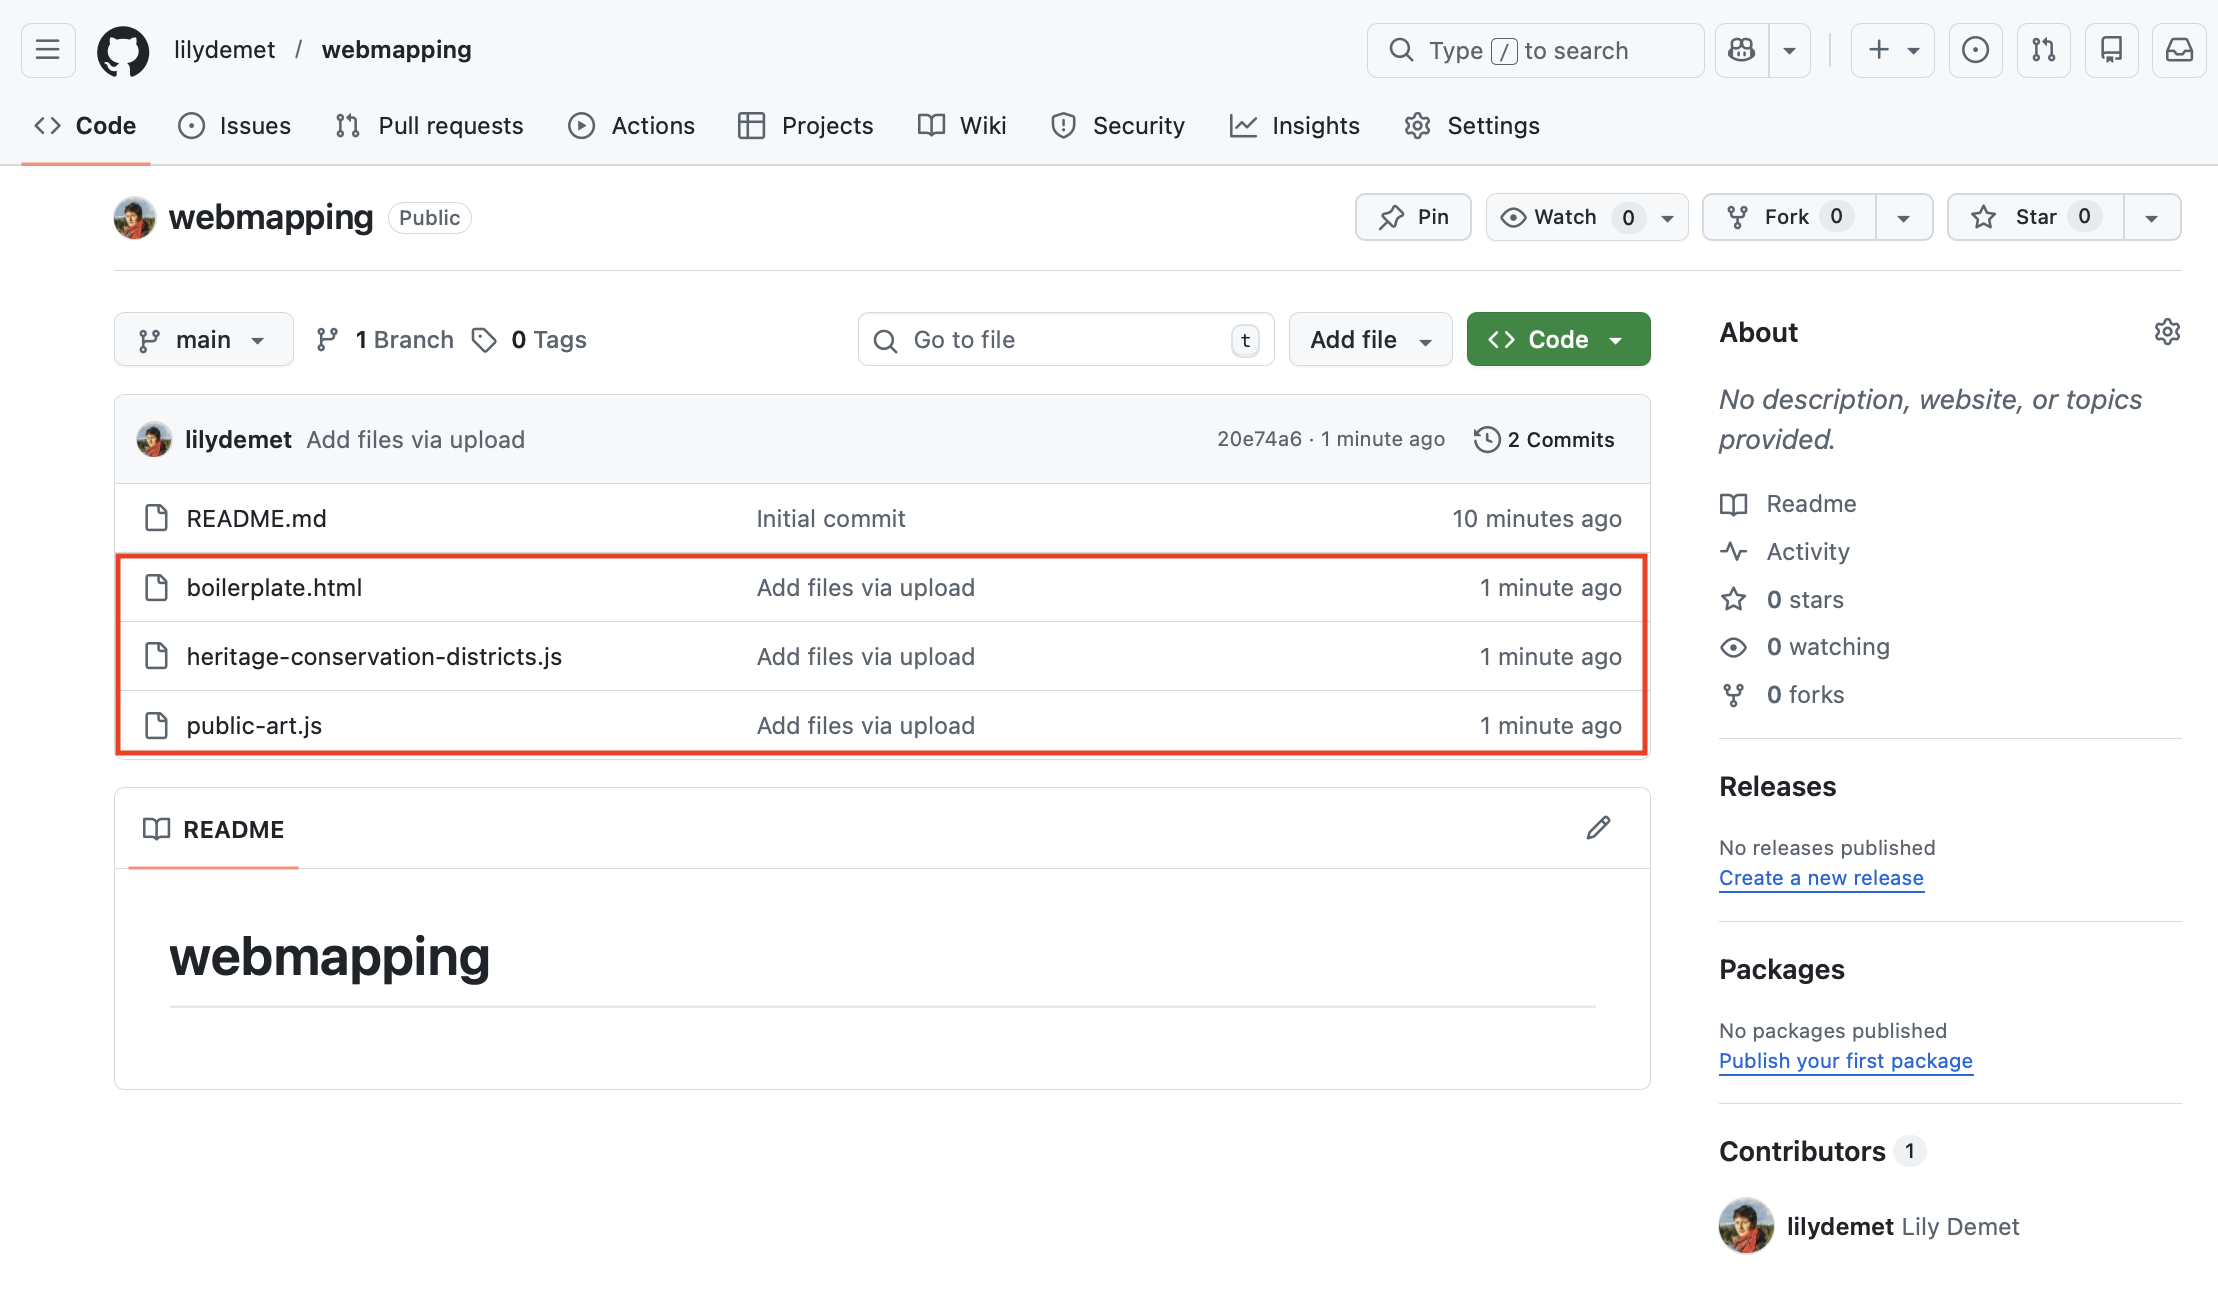
- Once uploaded, scroll down to bottom of screen and commit changes. The default message “Add files via upload” is fine.
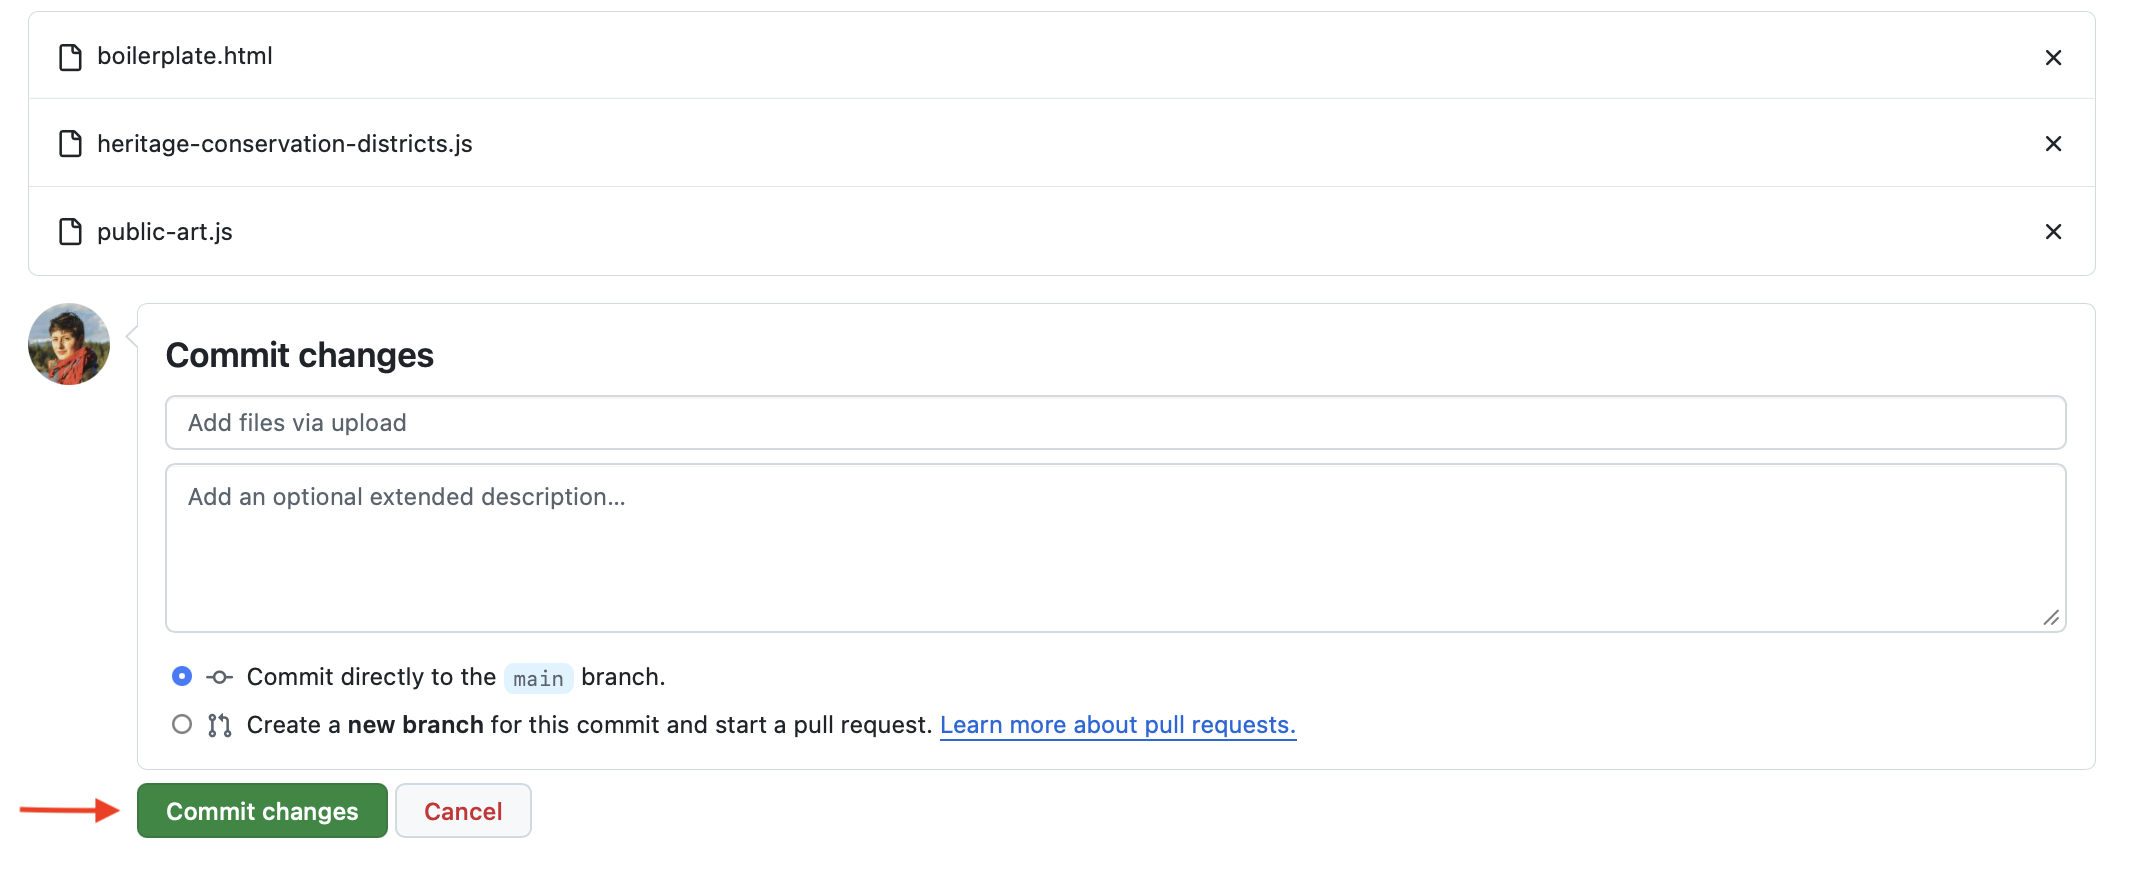
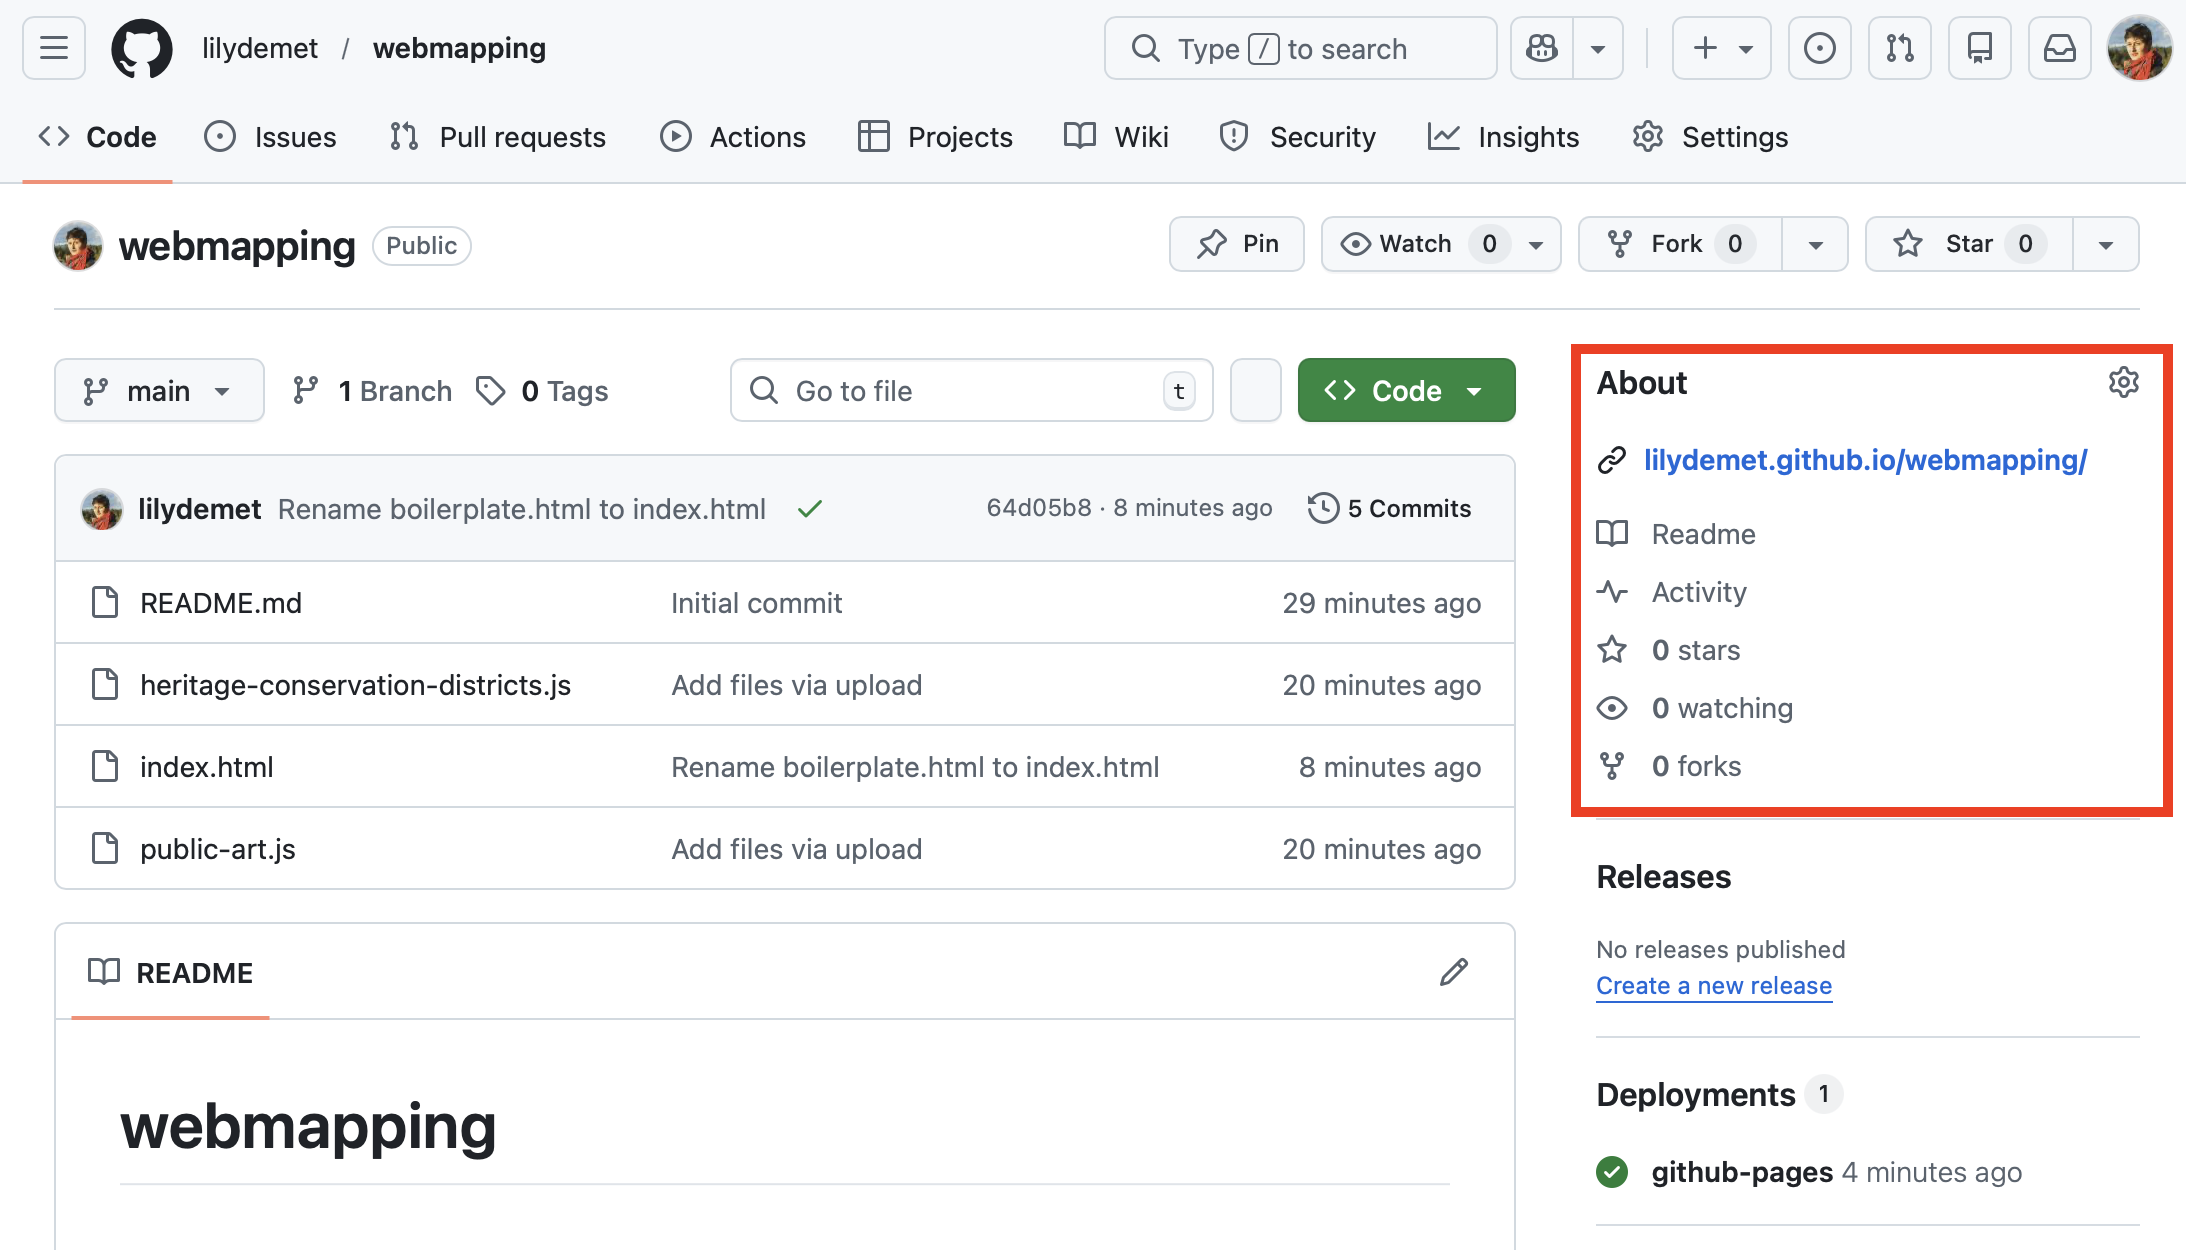
You should now see your file in your repository:
4. Create index file
Since you can upload all sorts of files and code documents to GitHub, in order for it to render your map as the default landing page when you generate a website from this repository, we need to rename boilerplate.html to index.html.
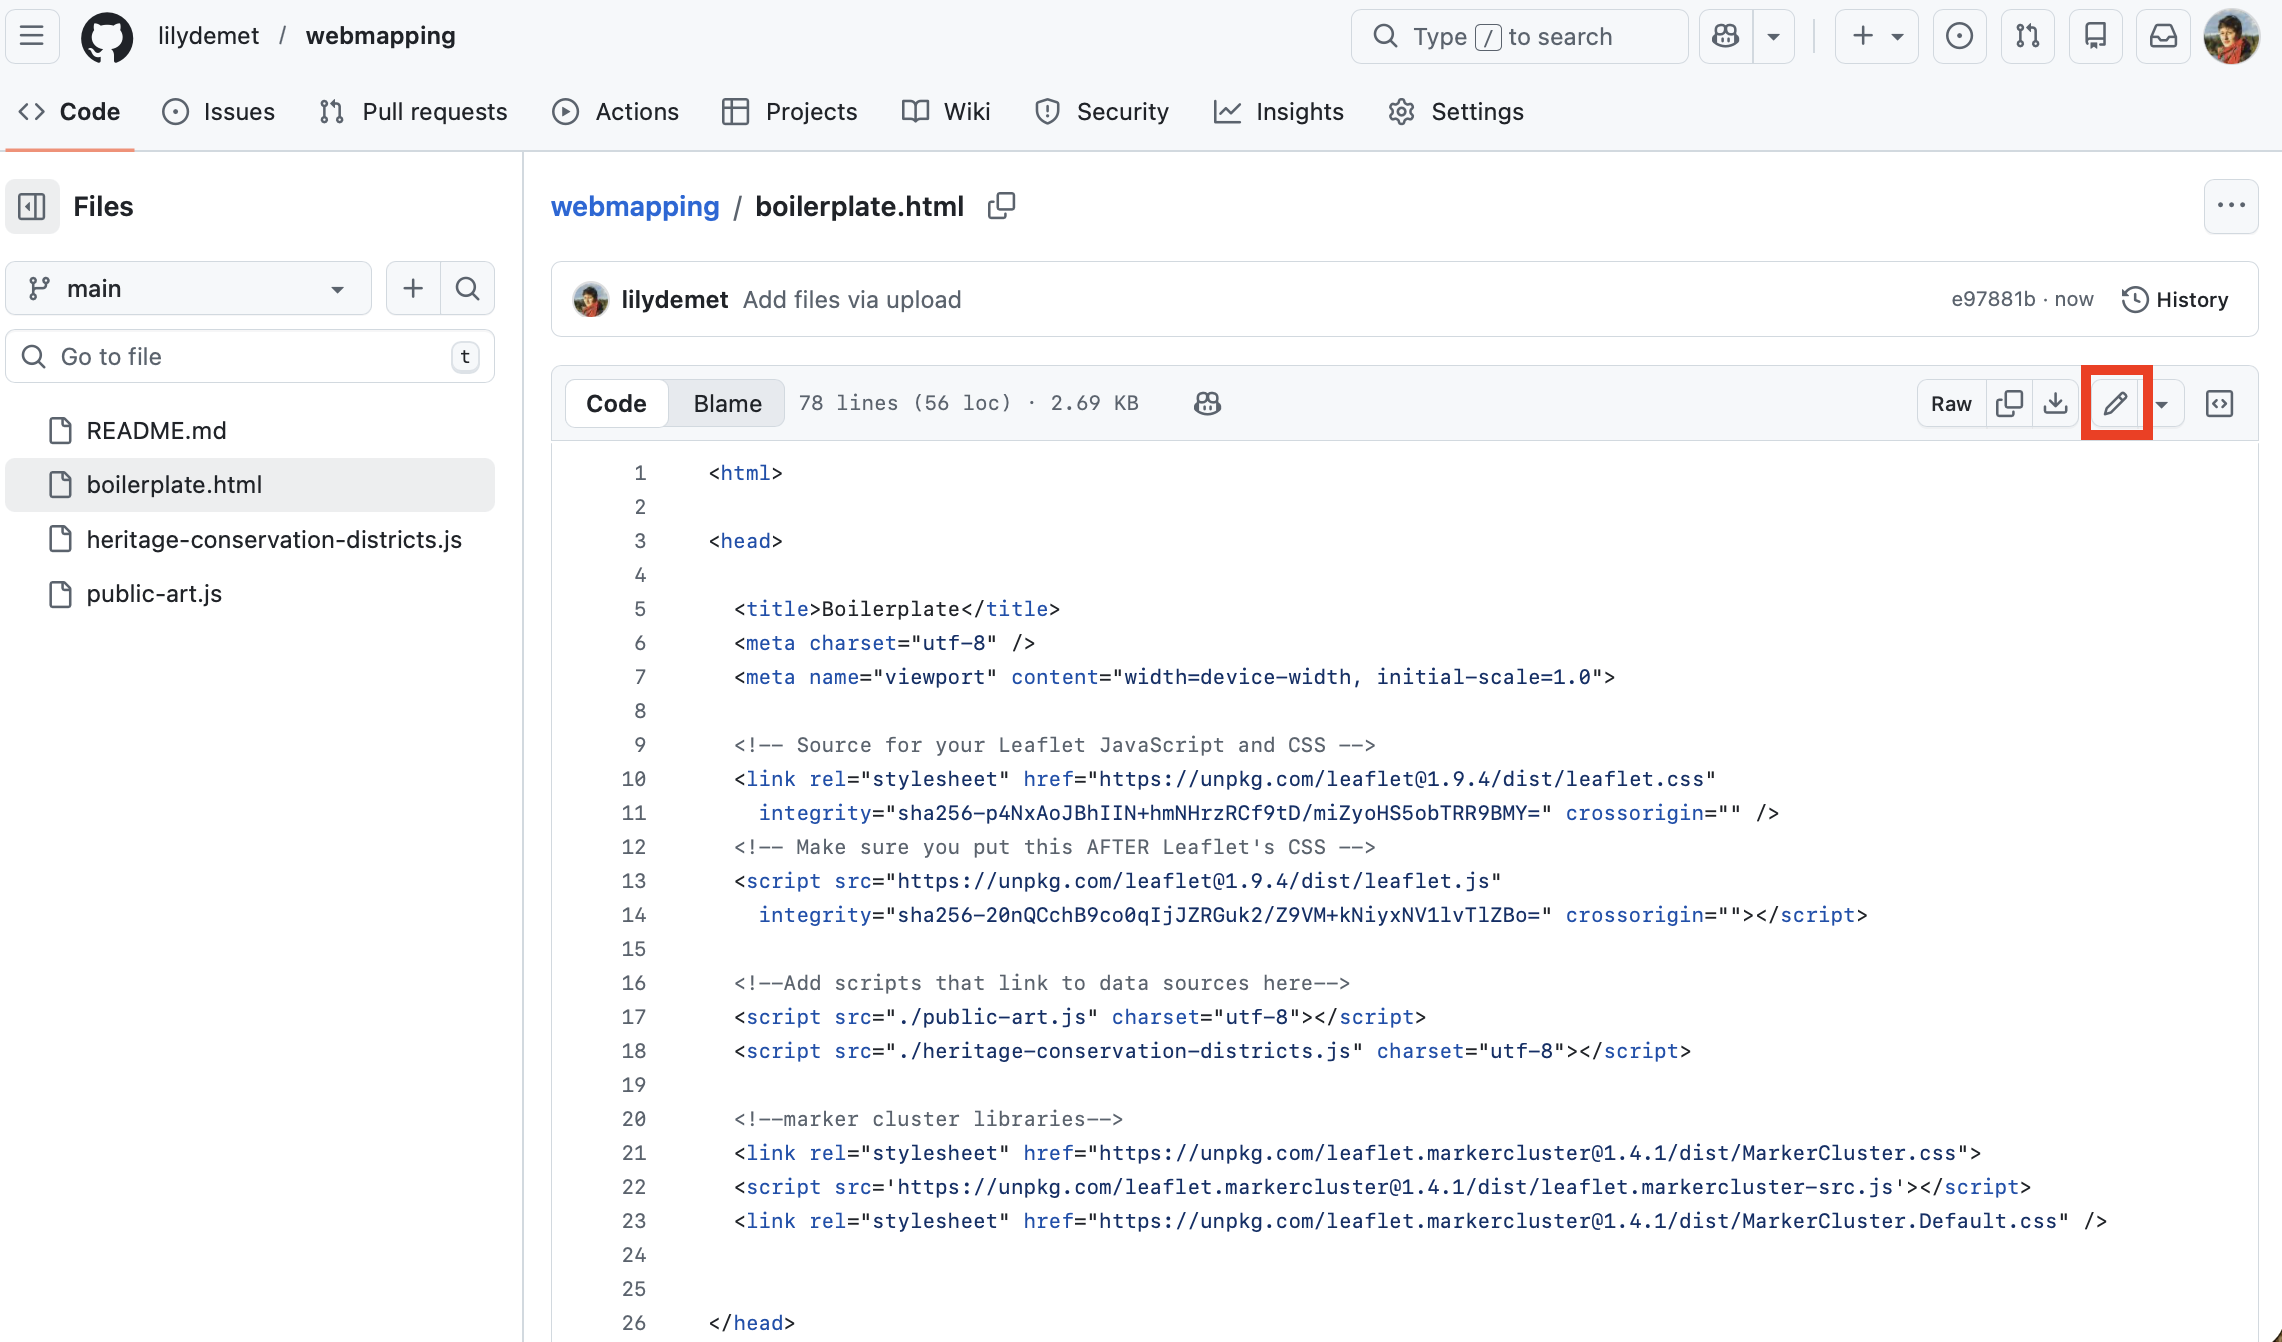
Click the file
boilerplate.htmlto navigate into it. You’ll see the same code you were working with in your code editor. Click the pencil icon to edit this file.
At the top, rename the file to index.html. BE SURE TO KEEP THE FILE EXTENSION .html!!
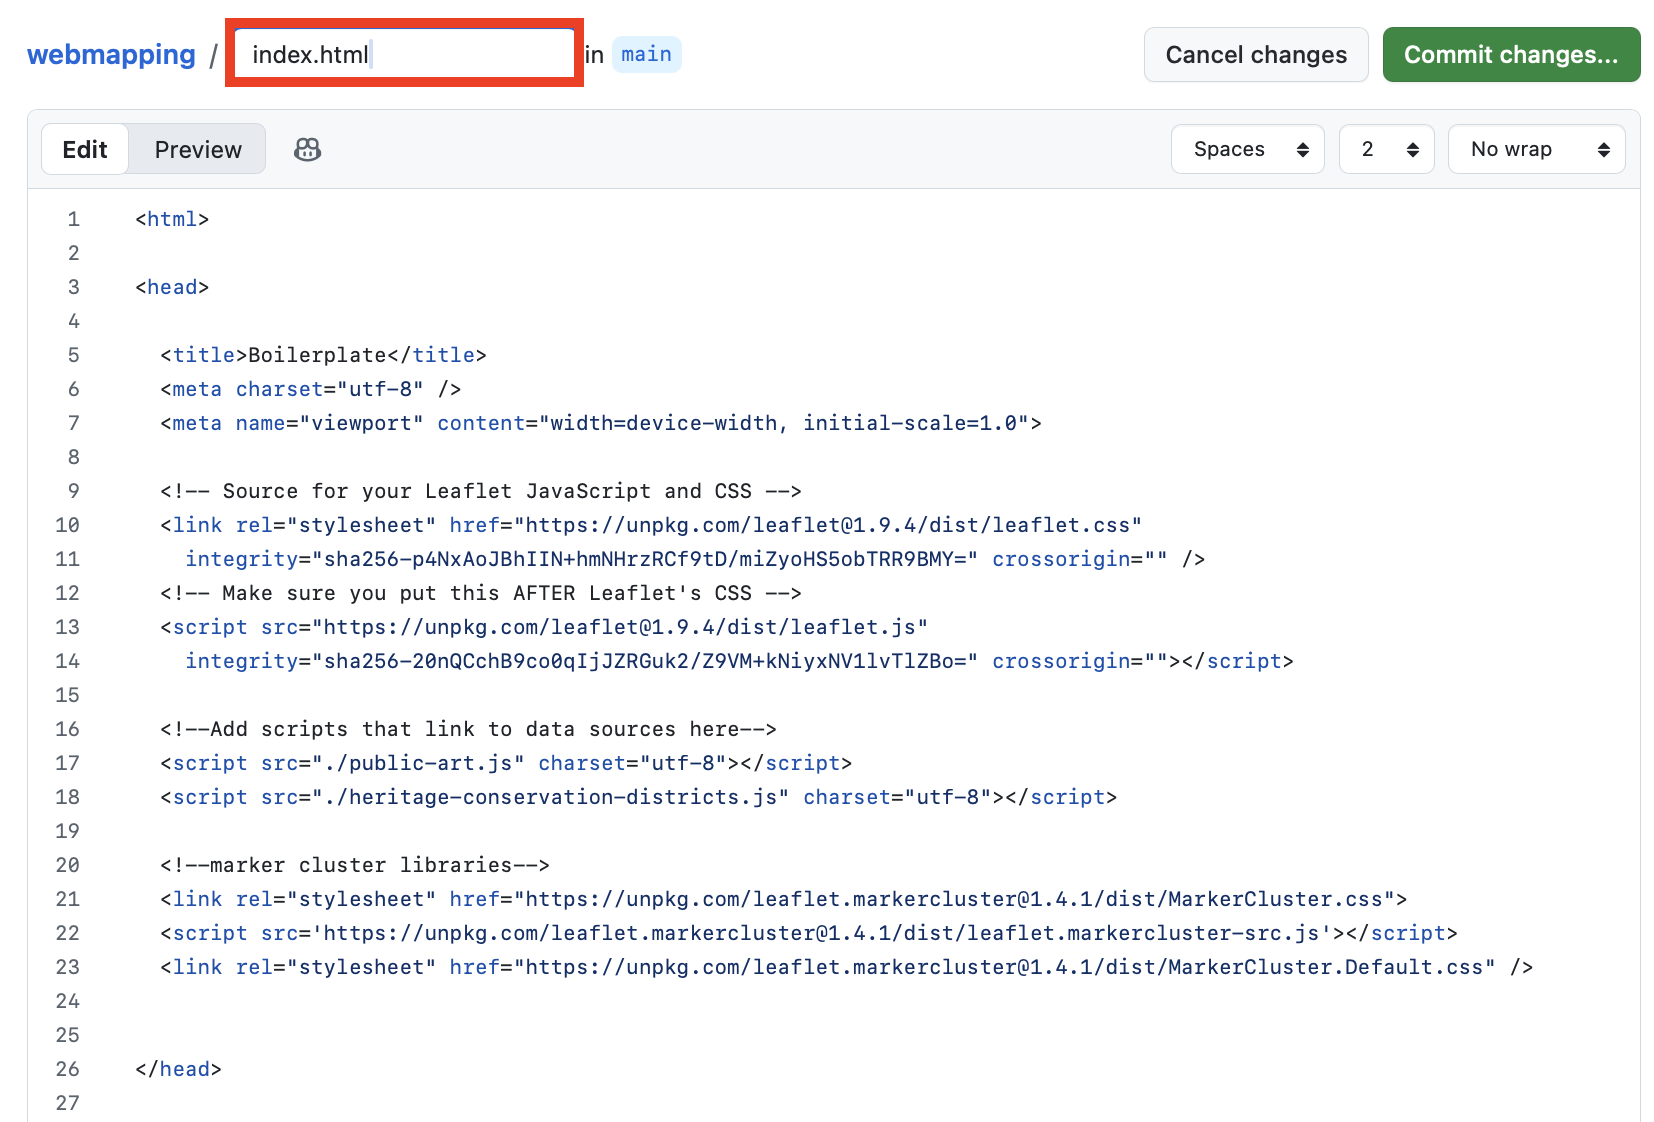
Then, commit your changes with the default message Rename boilerplate.html to index.html. Return to the code view of your repository by clicking webmapping.
5. Make a Github page from the index file
Github Pages allow you to create a little website from a code repository. The non-nested index.html file of your repository will be the landing page of your site. I say non-nested because you have another index.html file inside your qgis2web folder. In the step above, we embedded this inside the main index.html file.
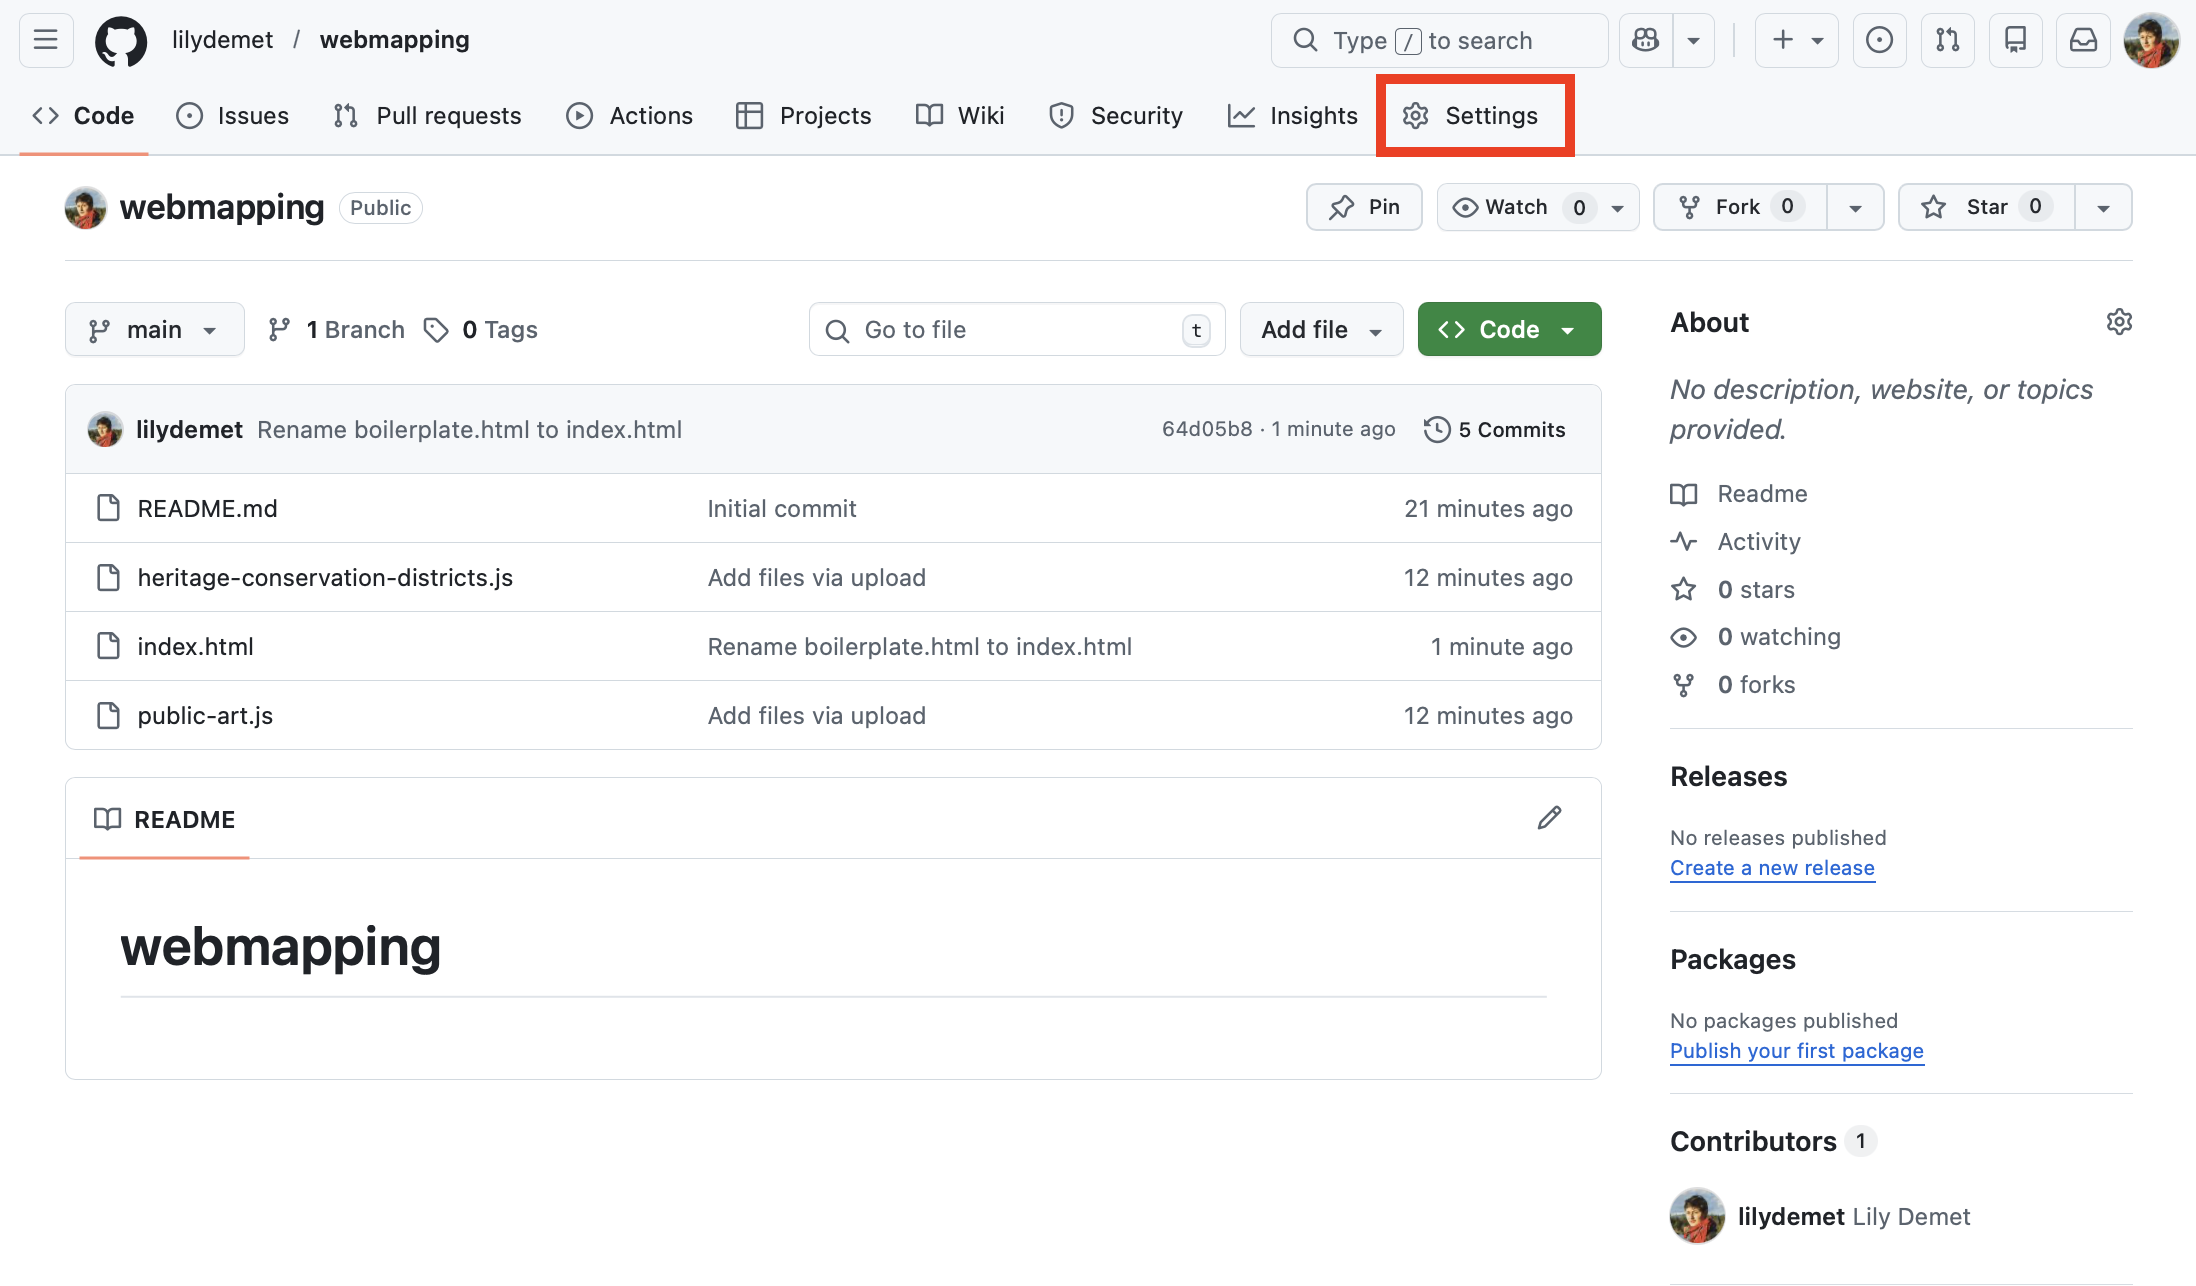
To activate Github Pages, go to your repository’s Settings.
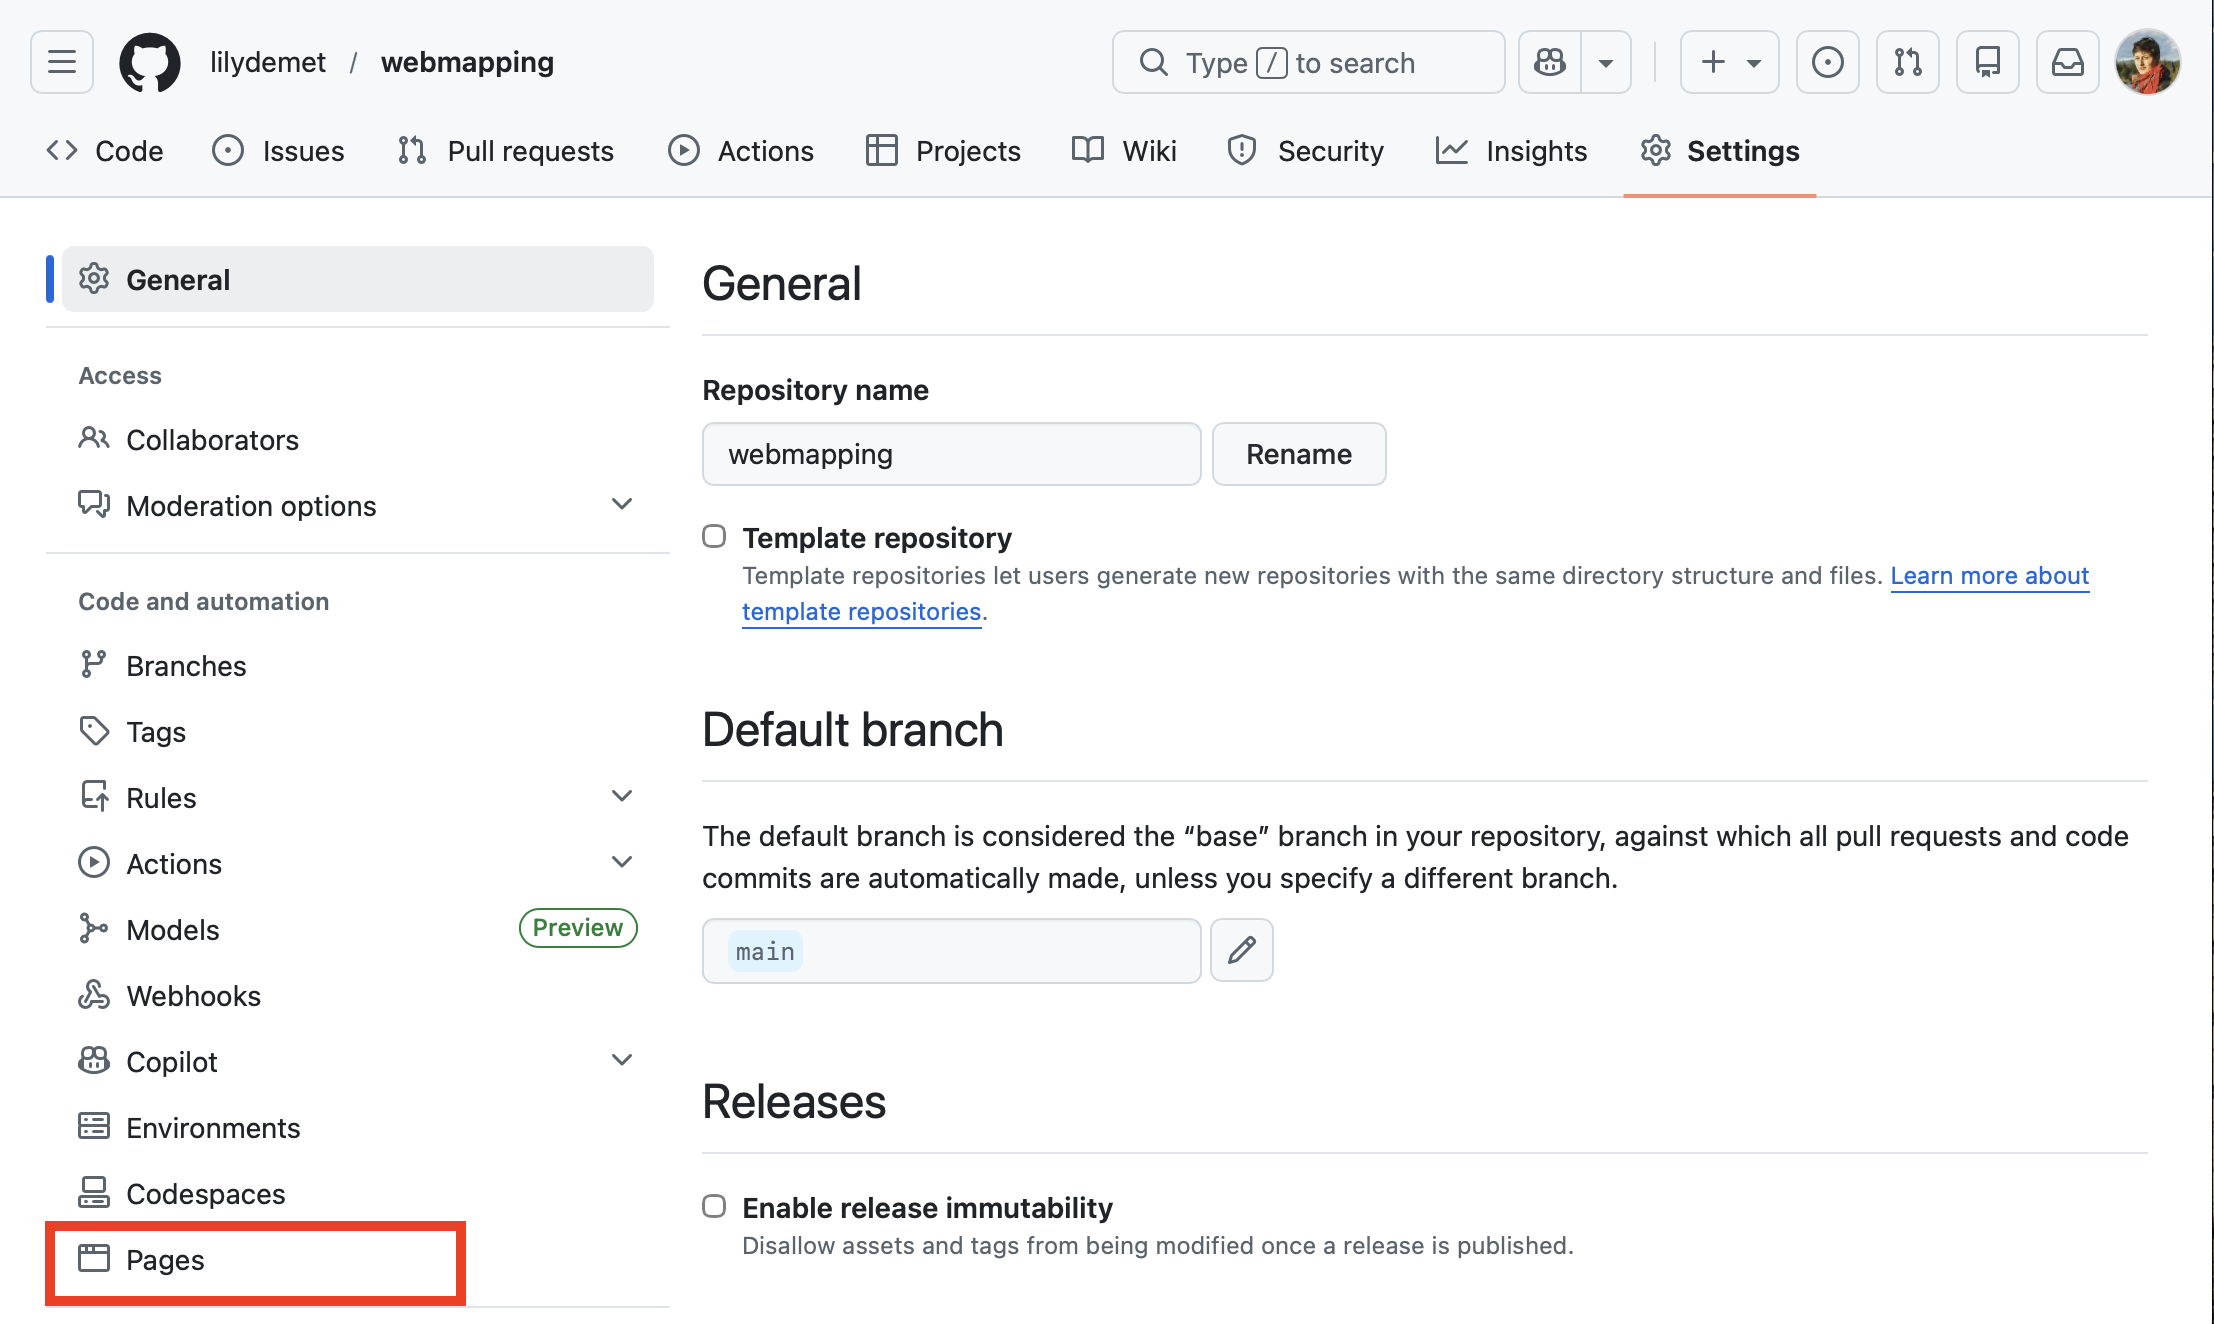
Then go to Pages:
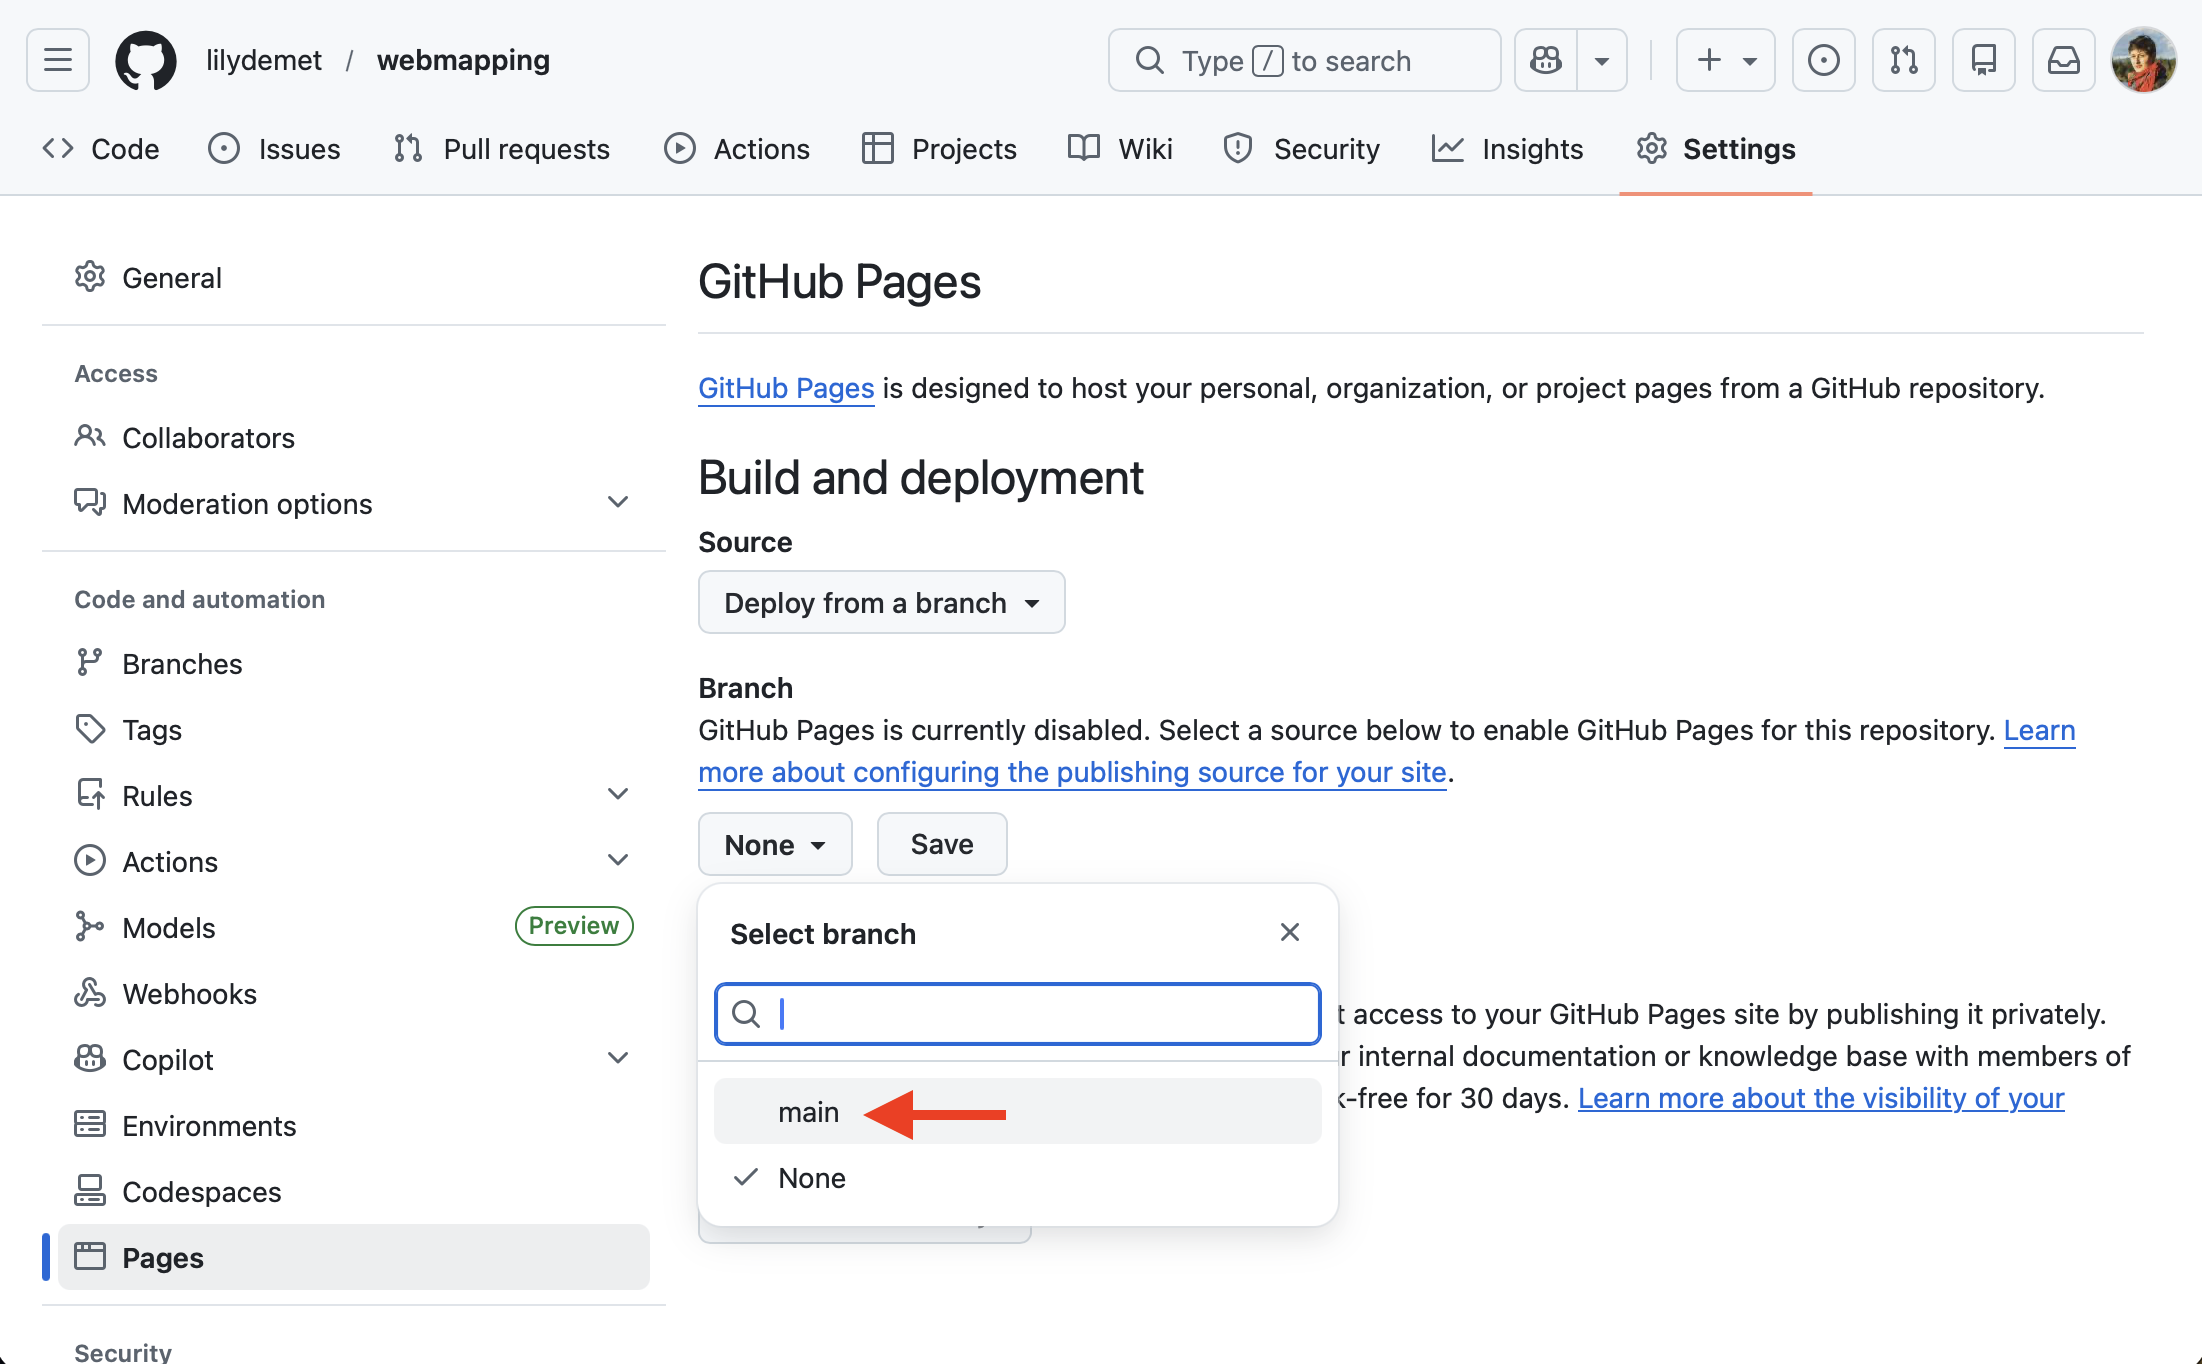
Change branch from None to main and SAVE.
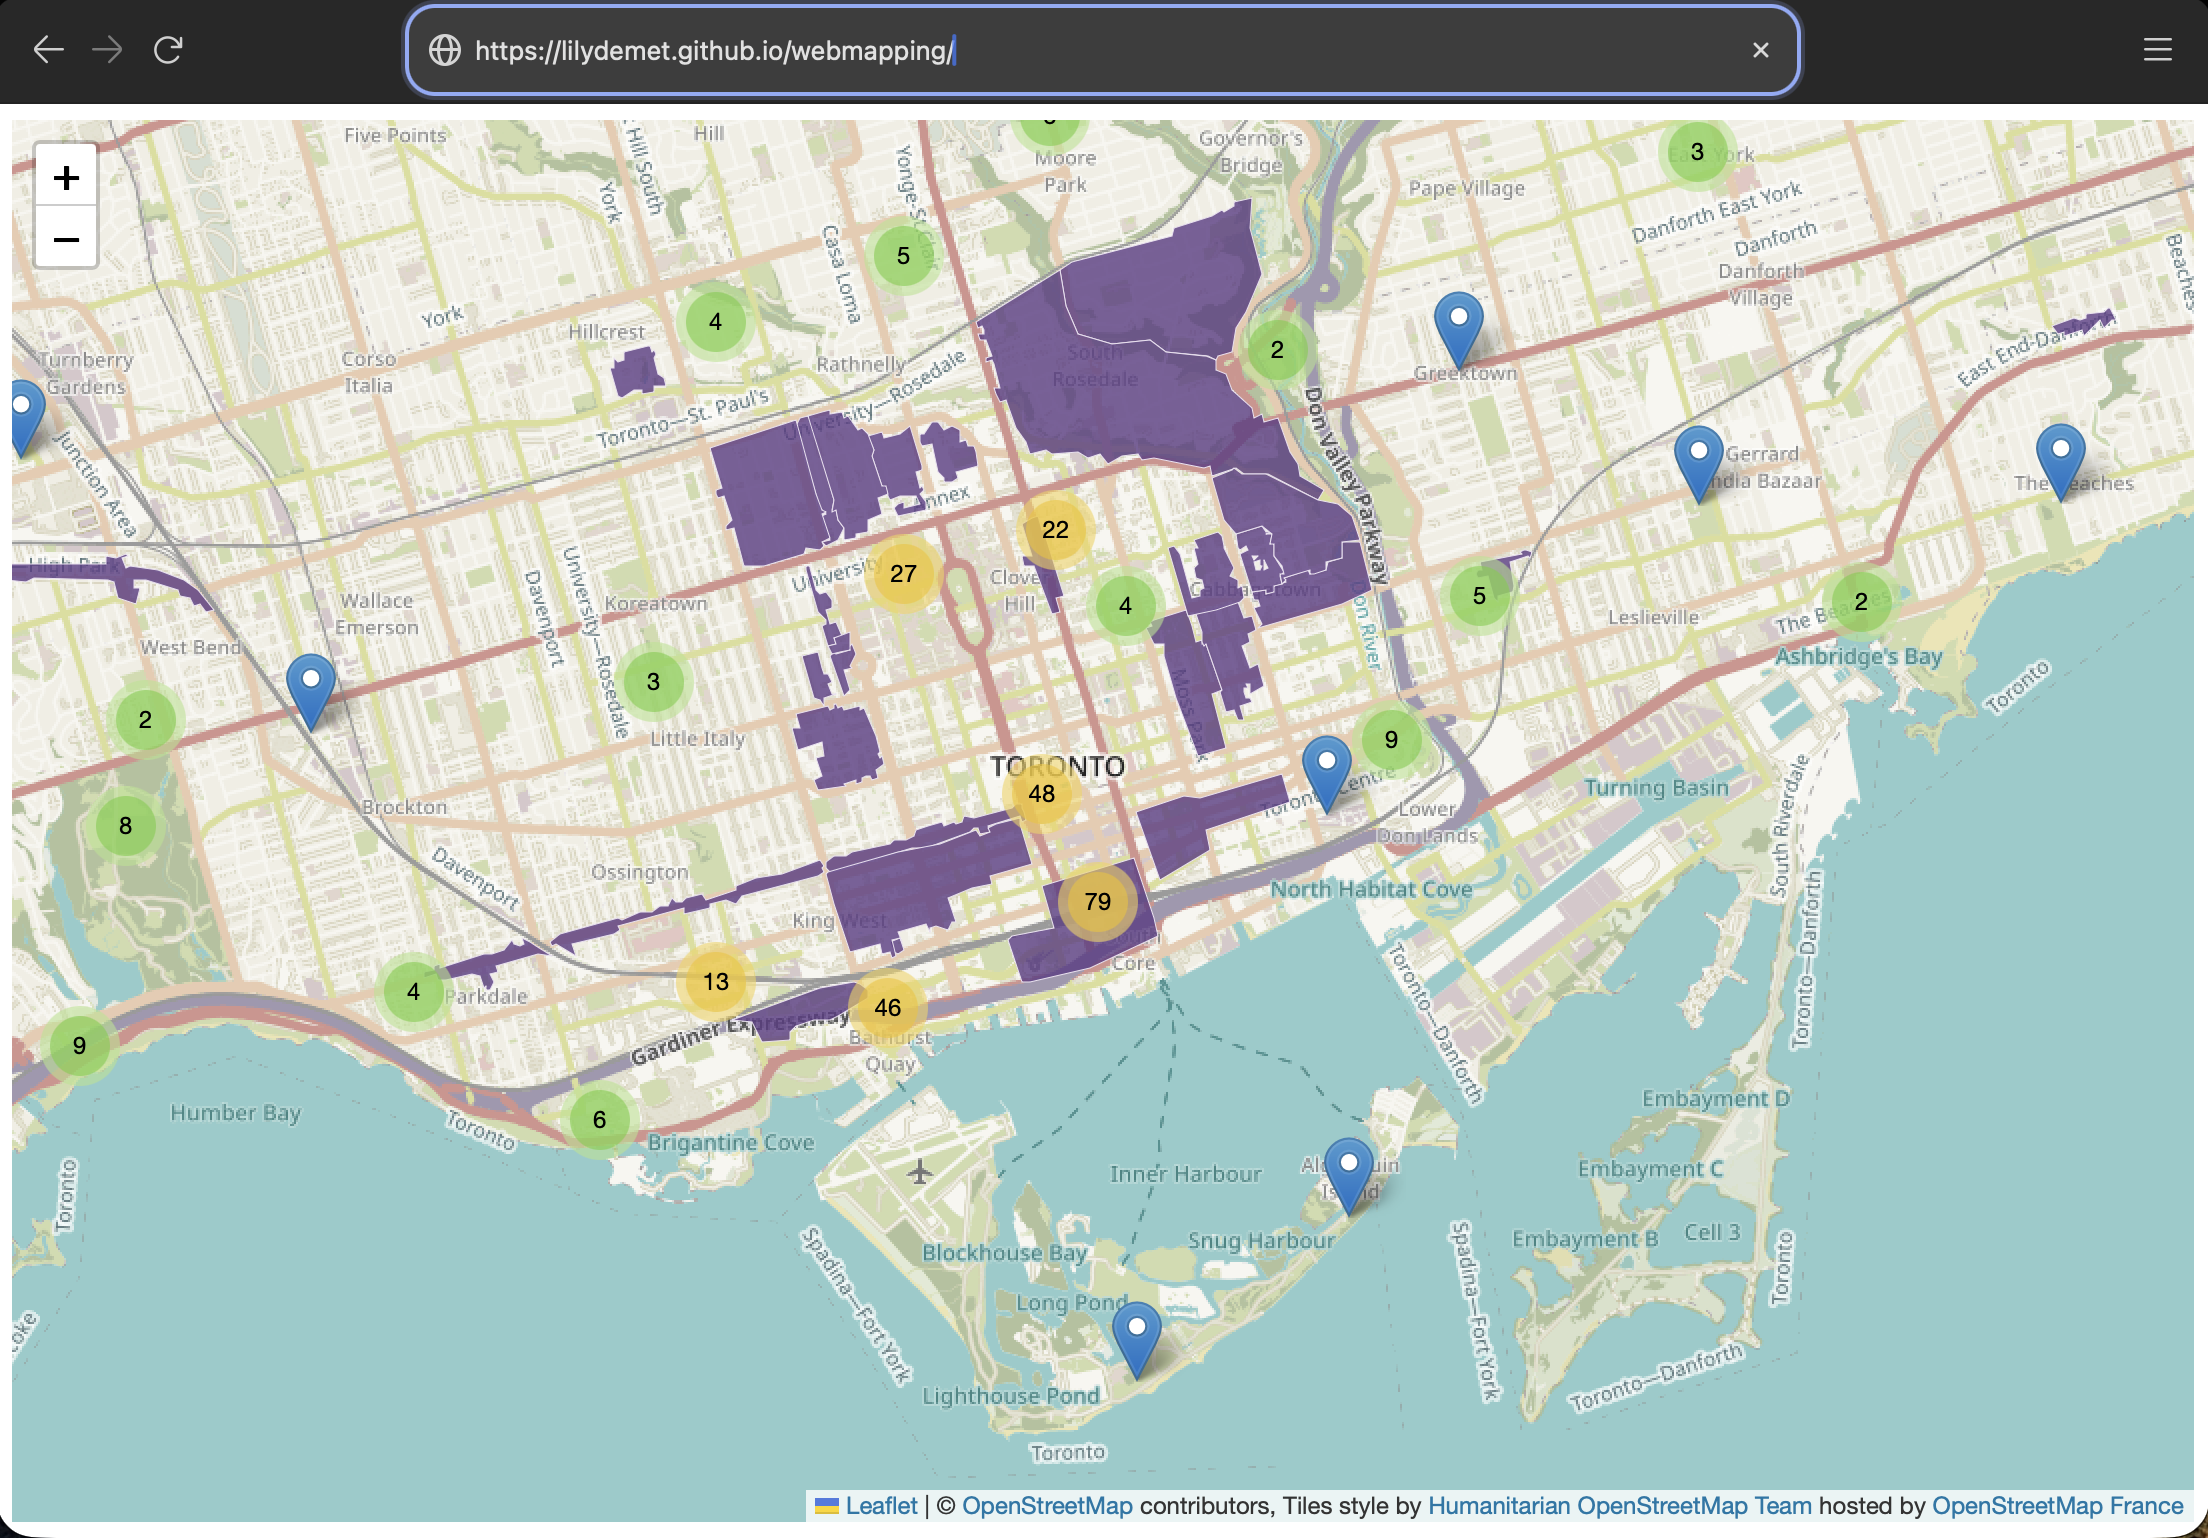
Once you hit save, give it a moment to build. After about 30 seconds (be patient), refresh your browser window. You should see a link now to your new website! Visit the site and explore your map once again. Now you can share it far and wide!
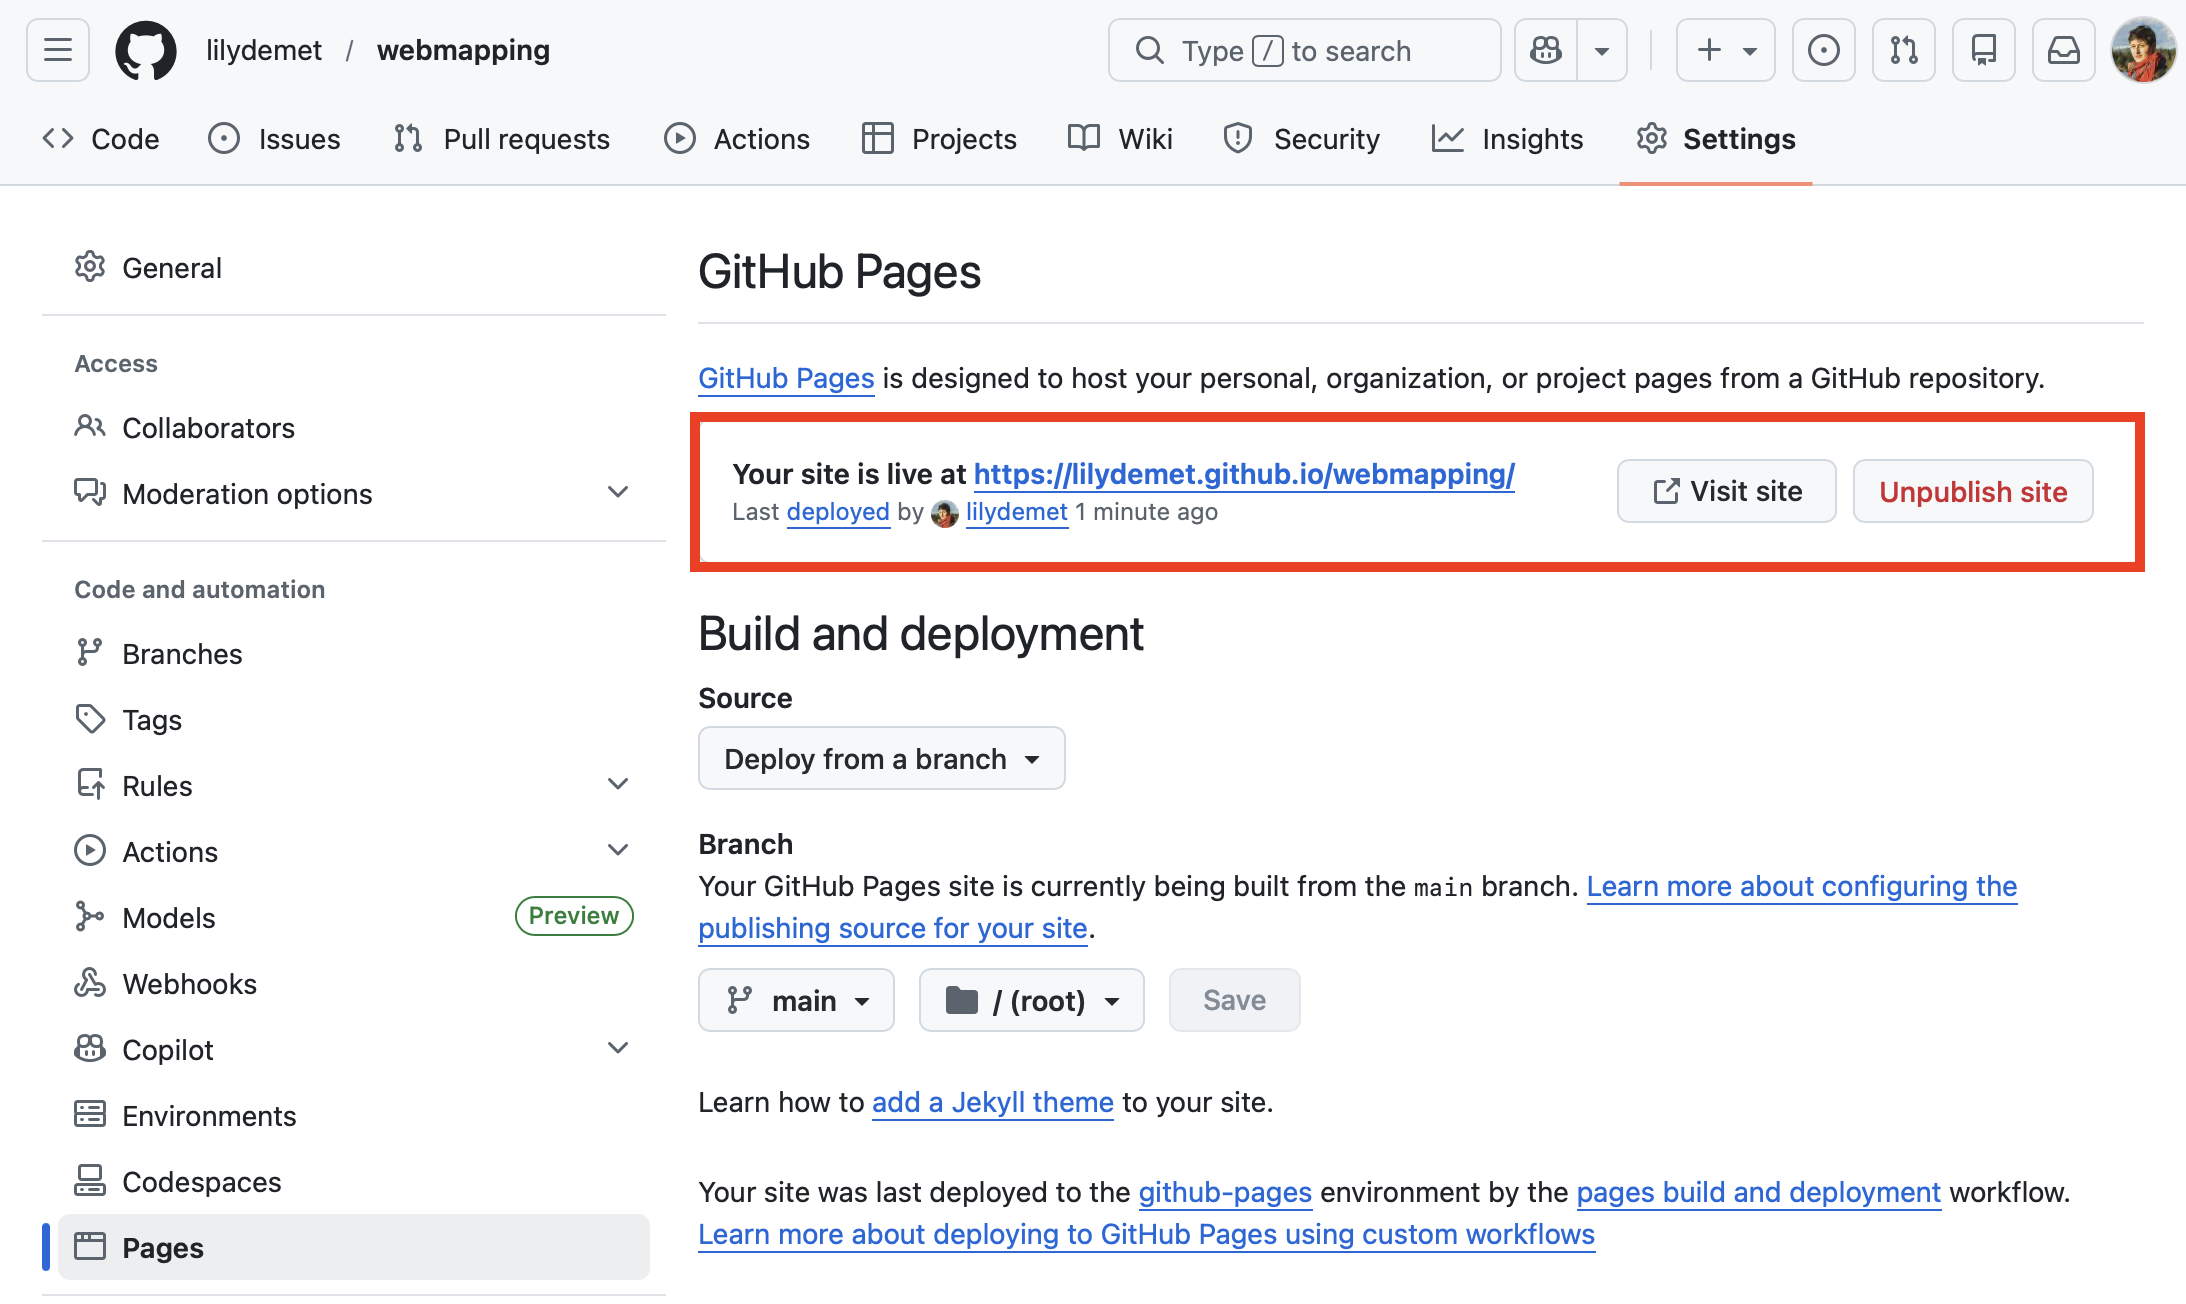
Click visit site to open the link in a new window.
One last step: Copy the link and return to your repo code. In the About section at the top right, add this link so that visitors to your repository can also access your website.
Resources for webmapping
This workshop builds from several other resources for web mapping. Here are some great places to start extending your knowledge:
- Web map basics: Anatomy of a Web Map - Alan McConchie and Beth Schechter
- Leaflet basics: Leaflet Quick Start Guide
- Web map functionality examples: Mapbox.js Examples
- GeoJSON: More than you ever wanted to know about GeoJSON - Tom MacWright
Adding different data
Keep in mind that not all data will be nicely packaged and cleaned. In fact, it never is. If you proceed to use data that you’ve found on the web, be prepared to spend time preparing your data to be usable with Leaflet and the web. Remember, you can always create your own geoJSON files with free tools like geojson.io.
try downloading data from xyz xyz wrapping as js variable
Adding more elements
You may want to add a legend or title, cluster data, or further style your map. While Leaflet Docs and Leaflet Tutorials document how to do much of this, there is a wealth of documentation online from people tweaking given code to meet their specific needs. So, if you have something specific in mind, we recommend you do an internet search to see what’s out there you could draw inspiration (and often code) from.
For example:
- Customizing icons in Leaflet
- Grouping layers
- Creating heatmaps with Leaflet
- Creating cluster maps with Leaflet, see this example
- Leaflet plugins offer extended functionality, making leaflet hugely customizable. Below are some plugins to give you some idea of the variety of added functionality that comes from the community of developers.
- Adding side panels/menus to a Leaflet web map
- Another side bar example; (see demo here)
- Overlay layers control
- Create a side panel (scroll down to see example)
Research Commons’ Resources
- Guide to project design when telling spatial stories
- Archive of all Research Commons workshops
- Research Commons Events Calender
- Contact UBC Library’s Geospatial team:
library.gis@ubc.ca - Schedule a 1:1 consult with the geospatial team here
Loading last updated date...