Visualizing Data in ArcGIS Online
OUTLINE
Goals
This workshop introduces beginners to the ArcGIS Online platform and tools. This workshop is intended for those unfamiliar with GIS software or code but who want to be able to create a map, add data and configure symbology, and create a Story Map. By the end of this workshop participants will be able to:
- Discover and explore available geospatial data online
- Add data to a map
- Symbolize data
- Configure pop-ups
- Embed a map in a Story Map
- Add photos and text to a Story Map
*Please be aware that this workshop uses data about deaths due to COVID-19 to explore these learning objectives, a subject which might be difficult for some people.
Workshop Outline
- Create three web maps using ArcGIS Online
- Add and explore data from the Living Atlas
- Add data from ArcGIS Online and customize using different symbology
- Create a story map using your web maps
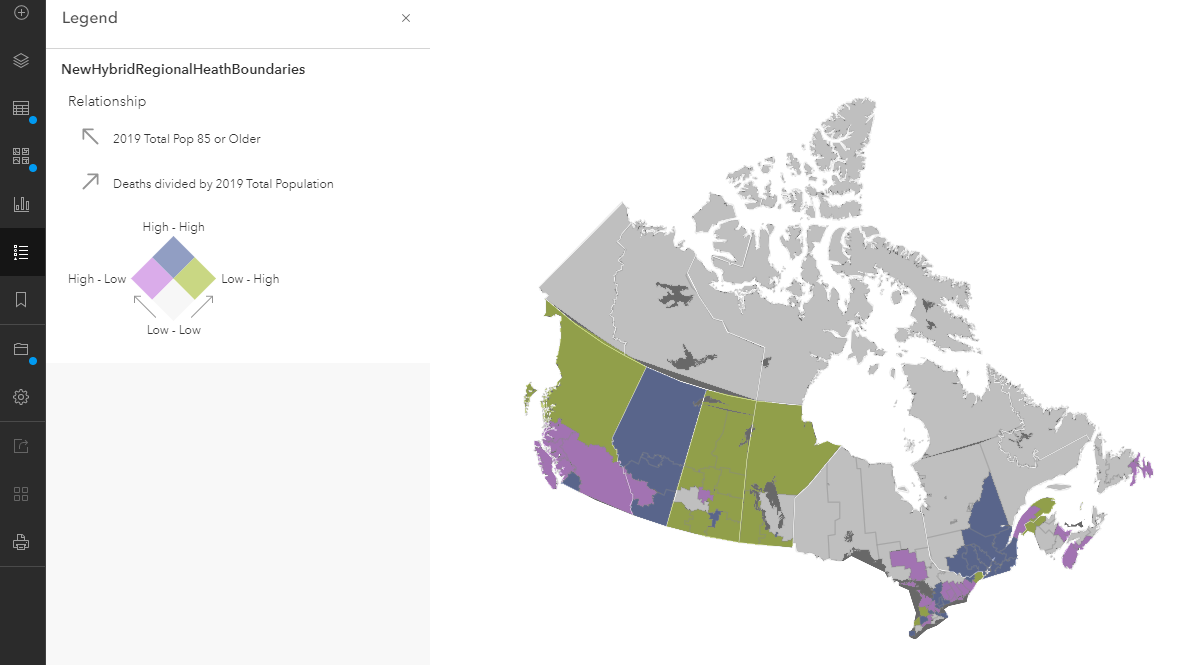
One of the web maps we will build

Setup
You will need to sign up for a free ArcGIS public account ahead of time. If you already have an account with Esri, you can choose to use your regular sign in or create a separate free account.
Click Create an account.
Under Create a free public account, click Create an ArcGIS Public Account and follow the instructions.
Geospatial Information Resources at UBC:
- General Informational website for all things UBC GIS: gis.ubc.ca
- UBC Library’s guide for finding and working with GIS resources: guides.library.ubc.ca/gis
- UBC’s GIS email list: UBC GIS ListServ
- UBC’s GIS Slack (create your own channel or lurk!): ubcgis.slack.com
- Sign up for a GIS consultation at the Research Commons
- UBC Library GIS Help email: library.gis AT ubc.ca