Climate, Climate Data, PRISM & ClimateNA
Climate is the synthesis of atmospheric conditions characteristic of a particular place in the long-term. It is expressed by means of averages of the various elements of weather, and also the probabilities of other conditions, including extreme values.
– Linacre, E. (1992). Climate data and resources. Routledge. (p2)
Climate models
Experimental design as a way of understanding Earth’s climate is not entirely conducive to the spatial and temporal scales across which the climate changes. Rather, climate is reliant on modelling to test theories; model development that uses historical data, generally collected from weather stations - weather stations that are sporadically dotted across a landscape - coupled with other sources of information.
This raises a couple of challenges. On the one hand, how best to aggregate data to describe the climate of increasingly large and abstract entities. On the other, how to estimate climate data for a given point for which no data exists. And in both cases, how to determine the most appropriate ‘other sources of information’ to help structure the model.
This workshop will explore one tool for navigating limited data points in climate data - ClimateNA - that address the second issue, generating point specific climate data when no data exists for those points. We’ll be looking at Vancouver Island, but any place would suite just as well.
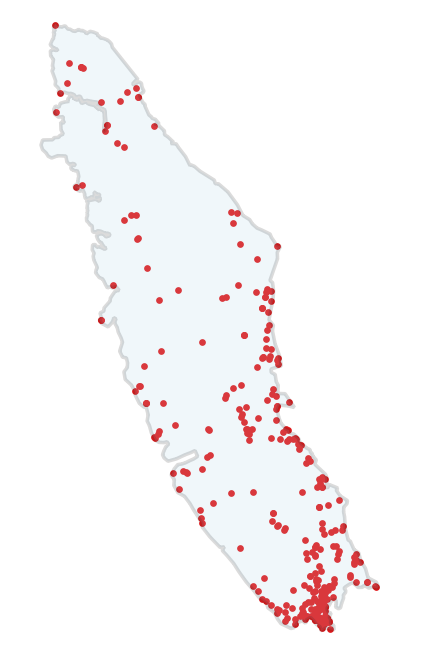
The following will hopefully help to illustrate the issue. The red dots are the locations of weather stations on Vancouver Island; the exact points where temperature, precipitation etc are measured and known. Information for any other location is modelled. When we see this, we might ask ourselves what it means to say “the east side of Vancouver Island receives 30% less annual precipitation than the west side.”
Levels of abstraction
Climate can be looked at from spatial spans of a specific site - like a weather station - all the way up to the more abstract global climate of the planet. In between these two end points we encounter a continuous, growing scale that might include a local climate - a valley, city, or other small area - a regional climate - a province or country - a continent and so on.
And so, there is an interplay between the climate of a specific location, which may differ significantly from a location a couple of hundred of metres away - especially when we think about things like mediating factors on soil temperature or the influence of topographical features and, say, the resulting impacts on species diversity - and the need for different levels of abstraction to describe systems of differing scope and scale.
Filling in the gaps
Research - agriculture, ecology, planning - often require climate data with much greater location specificity than is provided by sporadic data points that may be at a distance from the actual research or development site.
Interpolation - filling in the gaps between known data points - is how we generate data from the known data points to the space in between.
Both this interpolation and model abstraction is challenged by several variables. These include the influences of valleys, water bodies, elevation etc on specific sites as well as the temporal nature of climate, with both daily, seasonal, and annual fluctuations.
And while many models have been developed to estimate climate values - temperature, precipitation - to fill spatial and temporal gaps in existing data and to predict climate values at future dates, these often don’t provide the resolution and requisite detail needed by researchers and planners.
PRISM
The PRISM (Parameter-elevation Regressions on Independent Slopes Model) model, offers one solution to modelling climate data. Many other existing climate models have resolutions spanning 10km ~ 300km; 10km spans, let alone 300km spans, may have significant heterogeneity in climatic conditions.
One of the issues in producing accurate models that have a higher resolution is accounting for topography between data collection sites.
The most common lament of climate analysts is the lack of observations just where they need them most: at high elevations in mountainous areas.
As interpolations get increasingly site specific, accounting for elevation alone is not enough though. A model that is unable to factor in the impacts of coastal influences or inversions in valleys - inversions that may be seasonal - risk incorrectly estimating climate values between data collection points.
PRISM uses a combination of statistical methods and expert knowledge to build its predictive models to address these topographical and climatic features and their influence on interpolated site specific climate. The result is a model that offers gridded data to a spatial resolution of between 800m and 4000m.
ClimateNA
Gridded data sets like PRISM have a couple of drawbacks. They are large, and so extracting data for a set of sample points takes time. This process also requires a certain level of expertise. And lastly, they have difficulty accounting for large changes in elevation; a large shift in elevation - say several of hundred metres - might be effectively lost in a grid.
ClimateNA addresses these three issues. By converting the gridded data to scale free data, an elevation adjustment can be made, increasing the accuracy of interpolated data for areas that might otherwise have inaccurate spatial information - such as steep gradients. And by packaging the process in an application, end users avoid needing the expertise needed to generate this data. The application, offering an on demand overlay only for the provided sample points, keeps things relatively small and fast.
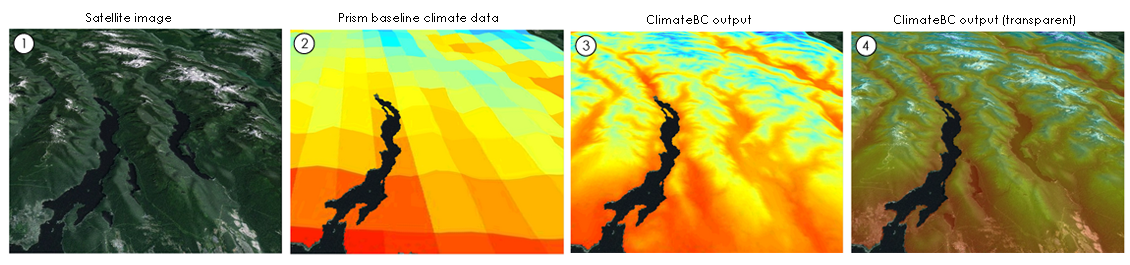
The results of this can be seen here. ClimateBC is a BC specific offering to ClimateNA. Image sourced directly from http://climatena.ca/Imgs/Fig2_scale-free.png
While baseline climate data is derived from PRISM and ANUSLIN data sets, historical and future anomaly data are derived from a number of sources. The full list of data sources is available at climateNA.ca.