Coding with ChatGPT
Now that we have learned a few skills for interacting with LLMs more effectively in the previous sessions, it is time to put it all together. We will use ChatGPT to help us run a t-test in R.
By the end of this session we hope you will:
- understand where ChatGPT can help in a data analysis workflow
- feel confident using ChatGPT in your own coding tasks
Ask for help (How to ask for help workshop)
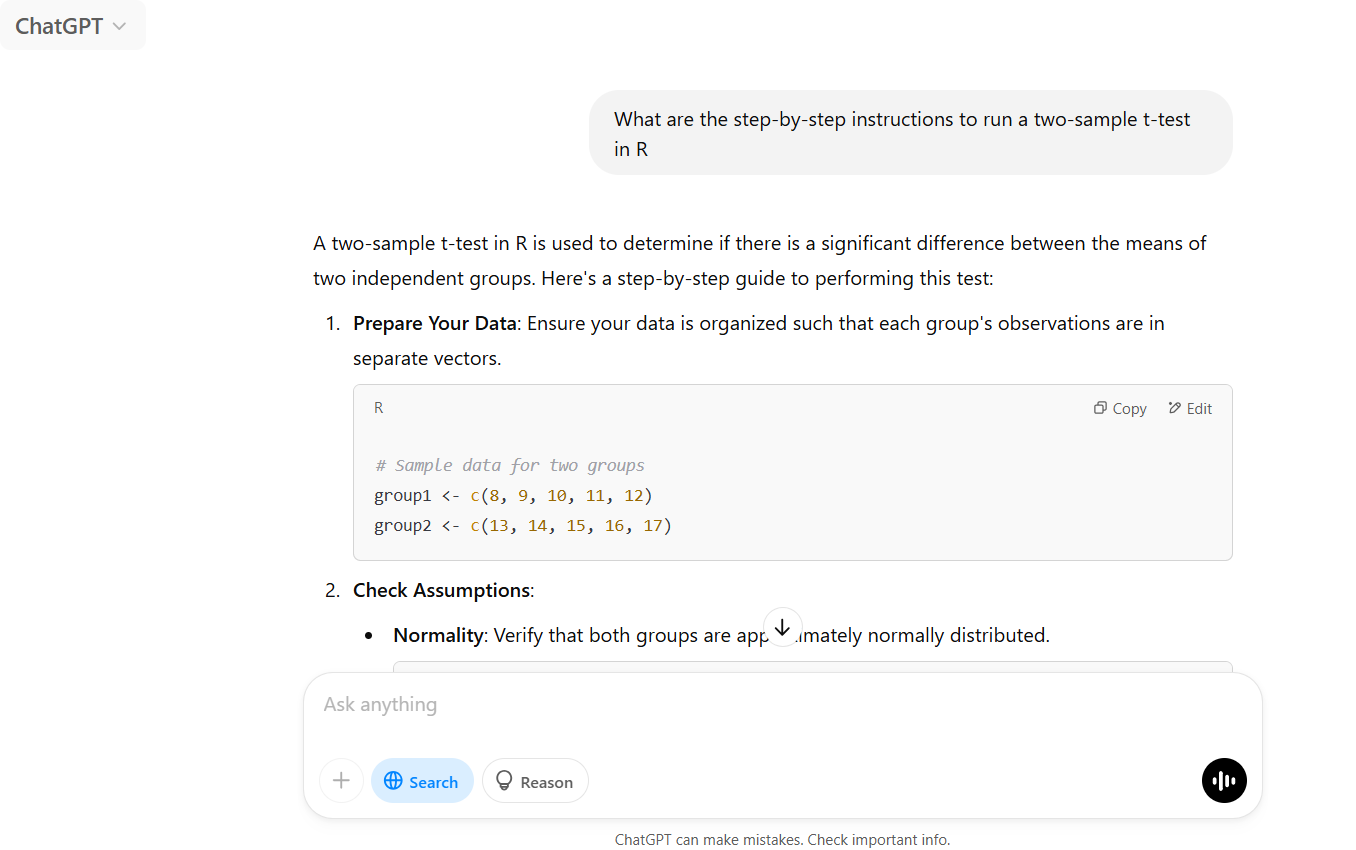
Ask the AI (prompt the AI): “What are the step-by-step instructions to run a two-sample t-test in R”? A t-test is a statistical test to compare the mean of 2 groups. Ask for sources and note down the steps. Note, we specify “in R” here because we want the steps for data analysis in R. Specify a different softwear as needed.
Upload data for ChatGPT to use (Dummy data workshop)
ChatGPT uses example data in the code, but using dummy data allows the generated code to use the variable names in your dataset, so you won’t need to edit the code when copy/pasting it from the response.
- Make a dummy dataset (first image below) with the same data structure and data types as your real data. Let’s make one with two columns:
- A continuous variable (column A)
- Indicating to which of the two groups the observation in column (B) belongs.
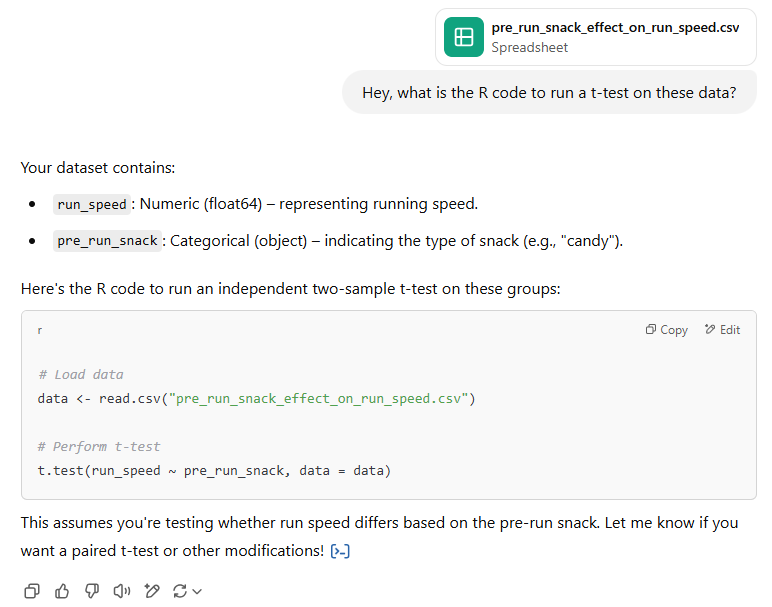
- Upload the dummy data (seccond image below). Newer ChatGPT versions can run the t-test directly, but we don't reccoment this.
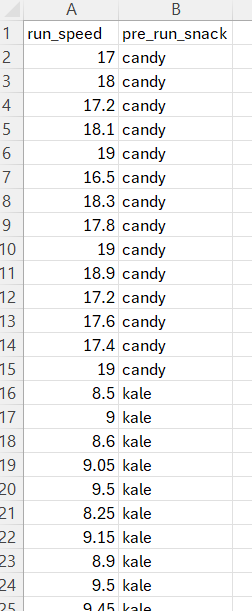
You can use this dummy data. It has the major important elements for a good dummy dataset: small amount of data (few observations), big variation among treatment groups (snack type), and similar to what your real data look like.
Ask for step by step help
Go through the step-by-step instructions we got earlier and ask ChatGPT for help with each section as needed.
If ChatGPT gives you code and data, you can try running that first (see "Code from ChatGPT" section bellow) before using your dummy data (see "R code built fom the ChatGPT..." section below). Note:ChatGPT does not always give dummy data and/or code right away, so you might have to ask for the code for each section. Recently, it seems to always give code, even for complex analyses.
In either case, check if the code ChatGPT has given you matches the desired outcome.
This is the time to address errors that occur before moving on to using your real data.
Code from ChatGPT
# Sample data for two groups
group1 <- c(8, 9, 10, 11, 12)
group2 <- c(13, 14, 15, 16, 17)

# Normality check using Q-Q plots
qqnorm(group1); qqline(group1)
qqnorm(group2); qqline(group2)

# Variance equality check using F-test
var.test(group1, group2)

# Two-sample t-test assuming equal variances
t.test(group1, group2, var.equal = TRUE)

# Welch's t-test (default in R)
t.test(group1, group2)
R code built fom the ChatGPT output using the run speed dummy data
Note, the ChatGPT dummy data is single vectors whereas our dummy data (run speed) is in a dataframe format.
# Sample data for two groups
df = read.csv("pre_run_snack_effect_on_run_speed.csv")

## subset into two groups
group1 = subset(df, df$pre_run_snack=="candy")
group2 = subset(df, df$pre_run_snack=="kale")

# Normality check using Q-Q plots
qqnorm(group1$run_speed); qqline(group1$run_speed)
qqnorm(group2$run_speed); qqline(group2$run_speed)

# Variance equality check using F-test
var.test(group1$run_speed, group2$run_speed)
## variances are unequal

# Welch's t-test (default in R)
t.test(group1$run_speed, group2$run_speed)
Sanity check
Does the output make sense with your dummy data? In the case of run speed, it makes sense that the two groups are different because we made our data that way.
Glossary
We list a few key terms below:
- Data type: The kind of data in your dataset. For example, numbers are numeric data, and letters are character data.
- Data structures: Shapes or formats in which the entire dataset is saved. These could be a dataframe, a matrix, a list, a vector to name a few. Statistical analyses and graph generations require data in a specific format.
- Dummy data: A fake dataset that has the same data types and structure as your real data. These datasets are used to make sure code works and work around data privacy and ownership concerns of using real data.
- Prompt: Text input you give the LLM.
Here is a link to the full workshop glossary.
Loading last updated date...