Here are some practice problems
Subset data
P1. Subset the built in iris dataset to only keep the setosa species. Call this subset set.iris
Answer P1
set.iris = subset(iris, iris$Species=="setosa")P2. Subset the built in iris dataset to only keep the setosoa species and only keep individuals with a Petal.Length over 1.5. Call this subset set.iris.long
Answer P2
set.iris.long = subset(iris, iris$Species=="setosa" & iris$Petal.Length>1.5)Use online resources
Learning how to use online resources is the skill that will allow you to code independently. Even if you never memorize any code, you will be able to do what you want, because the internet has already “memorized” the code for you. Tip, I usually look for examples on the documentation I’m looking at, since this shows you what code that you are going to run looks like. Information sheets and tutorials often have related, but not immediately relevant information that can get confusing.
R documentation
These documents are created by the developpers. They are th emost accurate and detailed options avaialble to you.
Built in R documentation (help)
P3. Use the command ?cor to pull up the R documentation to run a correlation test. Correlate Petal.Length and Petal.Width in the iris dataset.
Answer P3
cor(iris$Petal.Length, iris$Petal.Width)Online R doumentation
P4. Go to this website that I found through Google with the search query cor R. Compare the information from the ?cor information you got in R. What do you notice?
P5. o a Google search to for how to run a correlation test in R. I’ve listed my search query and some websites that I would reccomend from my search result in the answer.
Answer P5
run correlation test in R
STHDA https://www.sthda.com/english/wiki/correlation-test-between-two-variables-in-r
Data Camp https://www.datacamp.com/doc/r/correlations
There are other websites that have good information as well, especially for more niche analyses, but STHDA and Data Camp are generally reliable.
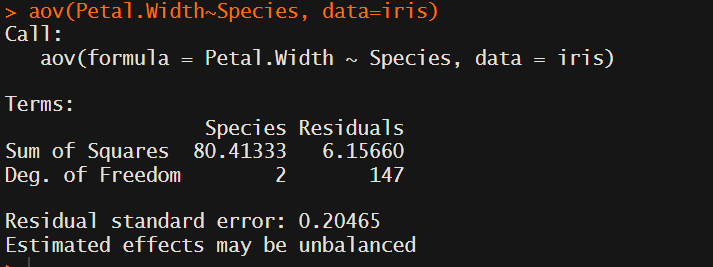
P6. Run an ANOVA in R. Use a Google search to figure out how to do this. Compare the mean Petal.Width between the three Species in the iris dataset. My code and output are in the answer section. If you get differnt code that’s okay, the important thing is getting the same numeric output.
Answer P6
aov(Petal.Width~Species, data=iris)
P7. You’ll notice that the ANOVA output from 2 is not very useful. Sometimes, you need to use an additional function summary() to see the summary of the statistics. Try to figure out how to do this, answer below.
Answer P7
a1=aov(Petal.Width~Species, data=iris)
summary(a1)
ChatGPT
P8. Ask ChatGPT for help running a linear regression model comparing Petal.Width between the three Species in the iris dataset.
Answer P8

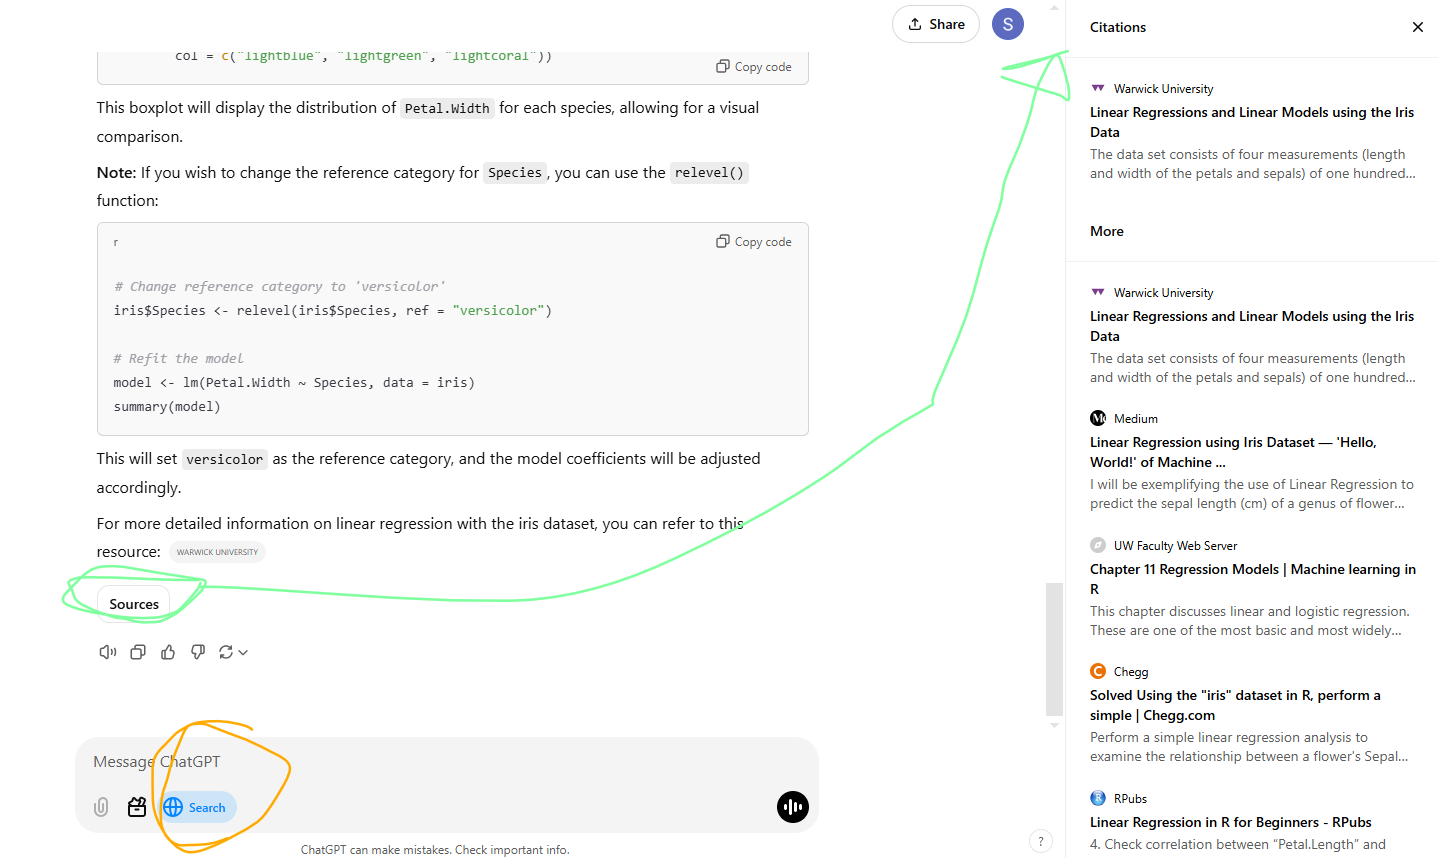
Note, being able to use AI tools will be as important as email and microsoft office tools like Word (arguably already is) in the workplace. This is often the most efficient route to getting a framework for code. You can ask for very specific things, which make the answer customized to your data. However, there is a major issue, the AI does not know if the answer is correct. You can check by looking at the documentation for the function it suggests yourself (the first few exercises) and/or you can turn on web search (circled in orange), then click on sources (circled in green) at the bottom of the output. It will pull up relevant websites and then you can decide if you think those websites are trustworthy or not.
