Data formatting problems
Problem 1: The most common mistake made is treating spreadsheet programs like lab notebooks, that is, relying on context, notes in the margin, spatial layout of data and fields to convey information. As humans, we can (usually) interpret these things, but computers don’t view information the same way, and unless we explain to the computer what every single thing means (and that can be hard!), it will not be able to see how our data fit together.
Better practice
Instead, when you’re working with spreadsheets, you should always keep your raw data, clean data, and notes separate.
- Create a new file or tab with your cleaned or analyzed data. Don’t modify the original dataset, or you will never know where you started!
- Keep track of the steps you took in your clean up or analysis. You should track these steps as you would any step in an experiment. You can do this in another text file, or a good option is to create a new tab in your spreadsheet with your notes. This way the notes and data stay together.
This will help you and others to reproduce your analyses or figure out what you did.
Problem 2:
Another common mistake is to put more than one piece of information in one cell. Take a look at this screenshot of some collected data (we’ll talk more about the dataset and the context later).
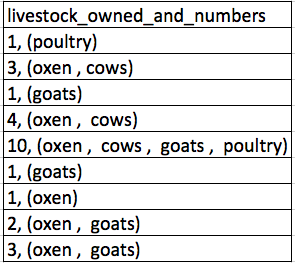
The problem is that number of livestock and type of livestock are in the same field. So, if the researchers wanted to look at the average number of livestock owned, or the average number of each type of livestock, it would be hard to do this using this data setup. If instead we put the count of each type of livestock in its own column, this would make analysis much easier.
The rule of thumb, when setting up a datasheet, is that each variable (in this case, each type of livestock) should have its own column, each observation should have its own row, and each cell should contain only a single value. Thus, the example above should look like this:
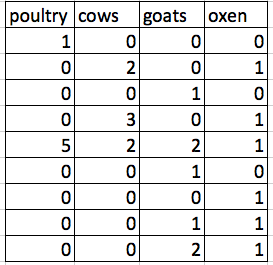
Notice that this now allows us to make statements about the number of each type of animal that a farmer owns, while still allowing us to say things about the total number of livestock.
The cardinal rules of using spreadsheet programs for data:
- Put all your variables in columns - the thing you’re measuring, like ‘weight’ or ‘temperature’.
- Put each observation in its own row.
- Don’t combine multiple pieces of information in one cell. Sometimes it just seems like one thing, but think if that’s the only way you’ll want to be able to use or sort that data.
- Leave the raw data raw - don’t change it!
- Export the cleaned data to a text-based format like CSV (comma-separated values) format. This ensures that anyone can use the data, and is required by most data repositories.
It’s extremely important to set up well-formatted tables from the outset - before you even start entering data from your very first preliminary experiment. It can make it easier or harder to work with your data throughout your analysis, so it’s worth thinking about when you’re doing your data entry or setting up your experiment.
Activity
We’re going to take a messy version of a dataset for this workshop and describe how we would clean it up.
Workshop Data
The data used in these lessons are taken from interviews of farmers in two countries in eastern sub-Saharan Africa (Mozambique and Tanzania). These interviews were conducted between November 2016 and June 2017 and probed household features (e.g. construction materials used, number of household members), agricultural practices (e.g. water usage), and assets (e.g. number and types of livestock). They also recorded the dates and locations of each interview.
This is a real dataset, however, it has been simplified for this workshop. If you’re interested in exploring the full dataset further, you can download it from Figshare and work with it using exactly the same tools we’ll learn about today.
For more information about the dataset and to download it from Figshare, check out the Social Sciences workshop data page.
Step 1
Download the messy data.
Step 2
Open up the data in a spreadsheet program.
Step 3
Notice that there are two tabs. Two researchers conducted the interviews, one in Mozambique and the other in Tanzania. They both structured their data tables in a different way. Now, you’re the person in charge of this project and you want to be able to start analyzing the data. What problems do you see in the way the data is currently organized?