Reference Maps
Maps can be digital, web-based, or physical. Many projects incorporate more than one kind of map into their final output. However, any map can be categorized into one of two main kinds of maps: reference maps and thematic maps.
Reference maps show the lay of the land, such as the geographic context surrounding your research location or area of interest. Reference maps can be as simple as a drop pin location, or more complex with data layers, labelling, and insets. Insets, which are maps nested within maps, either zoom-in to show a particular area in greater detail or zoom-out to contextualize the area of interest within broader geographical context.
Reference maps, like any map, should have at minimum an explanatory title, north arrow, scale, legend, map author and data source statement. If there are only one or two data layers which are intuitively symbolized and clearly marked, a legend is sometimes unnecessary.
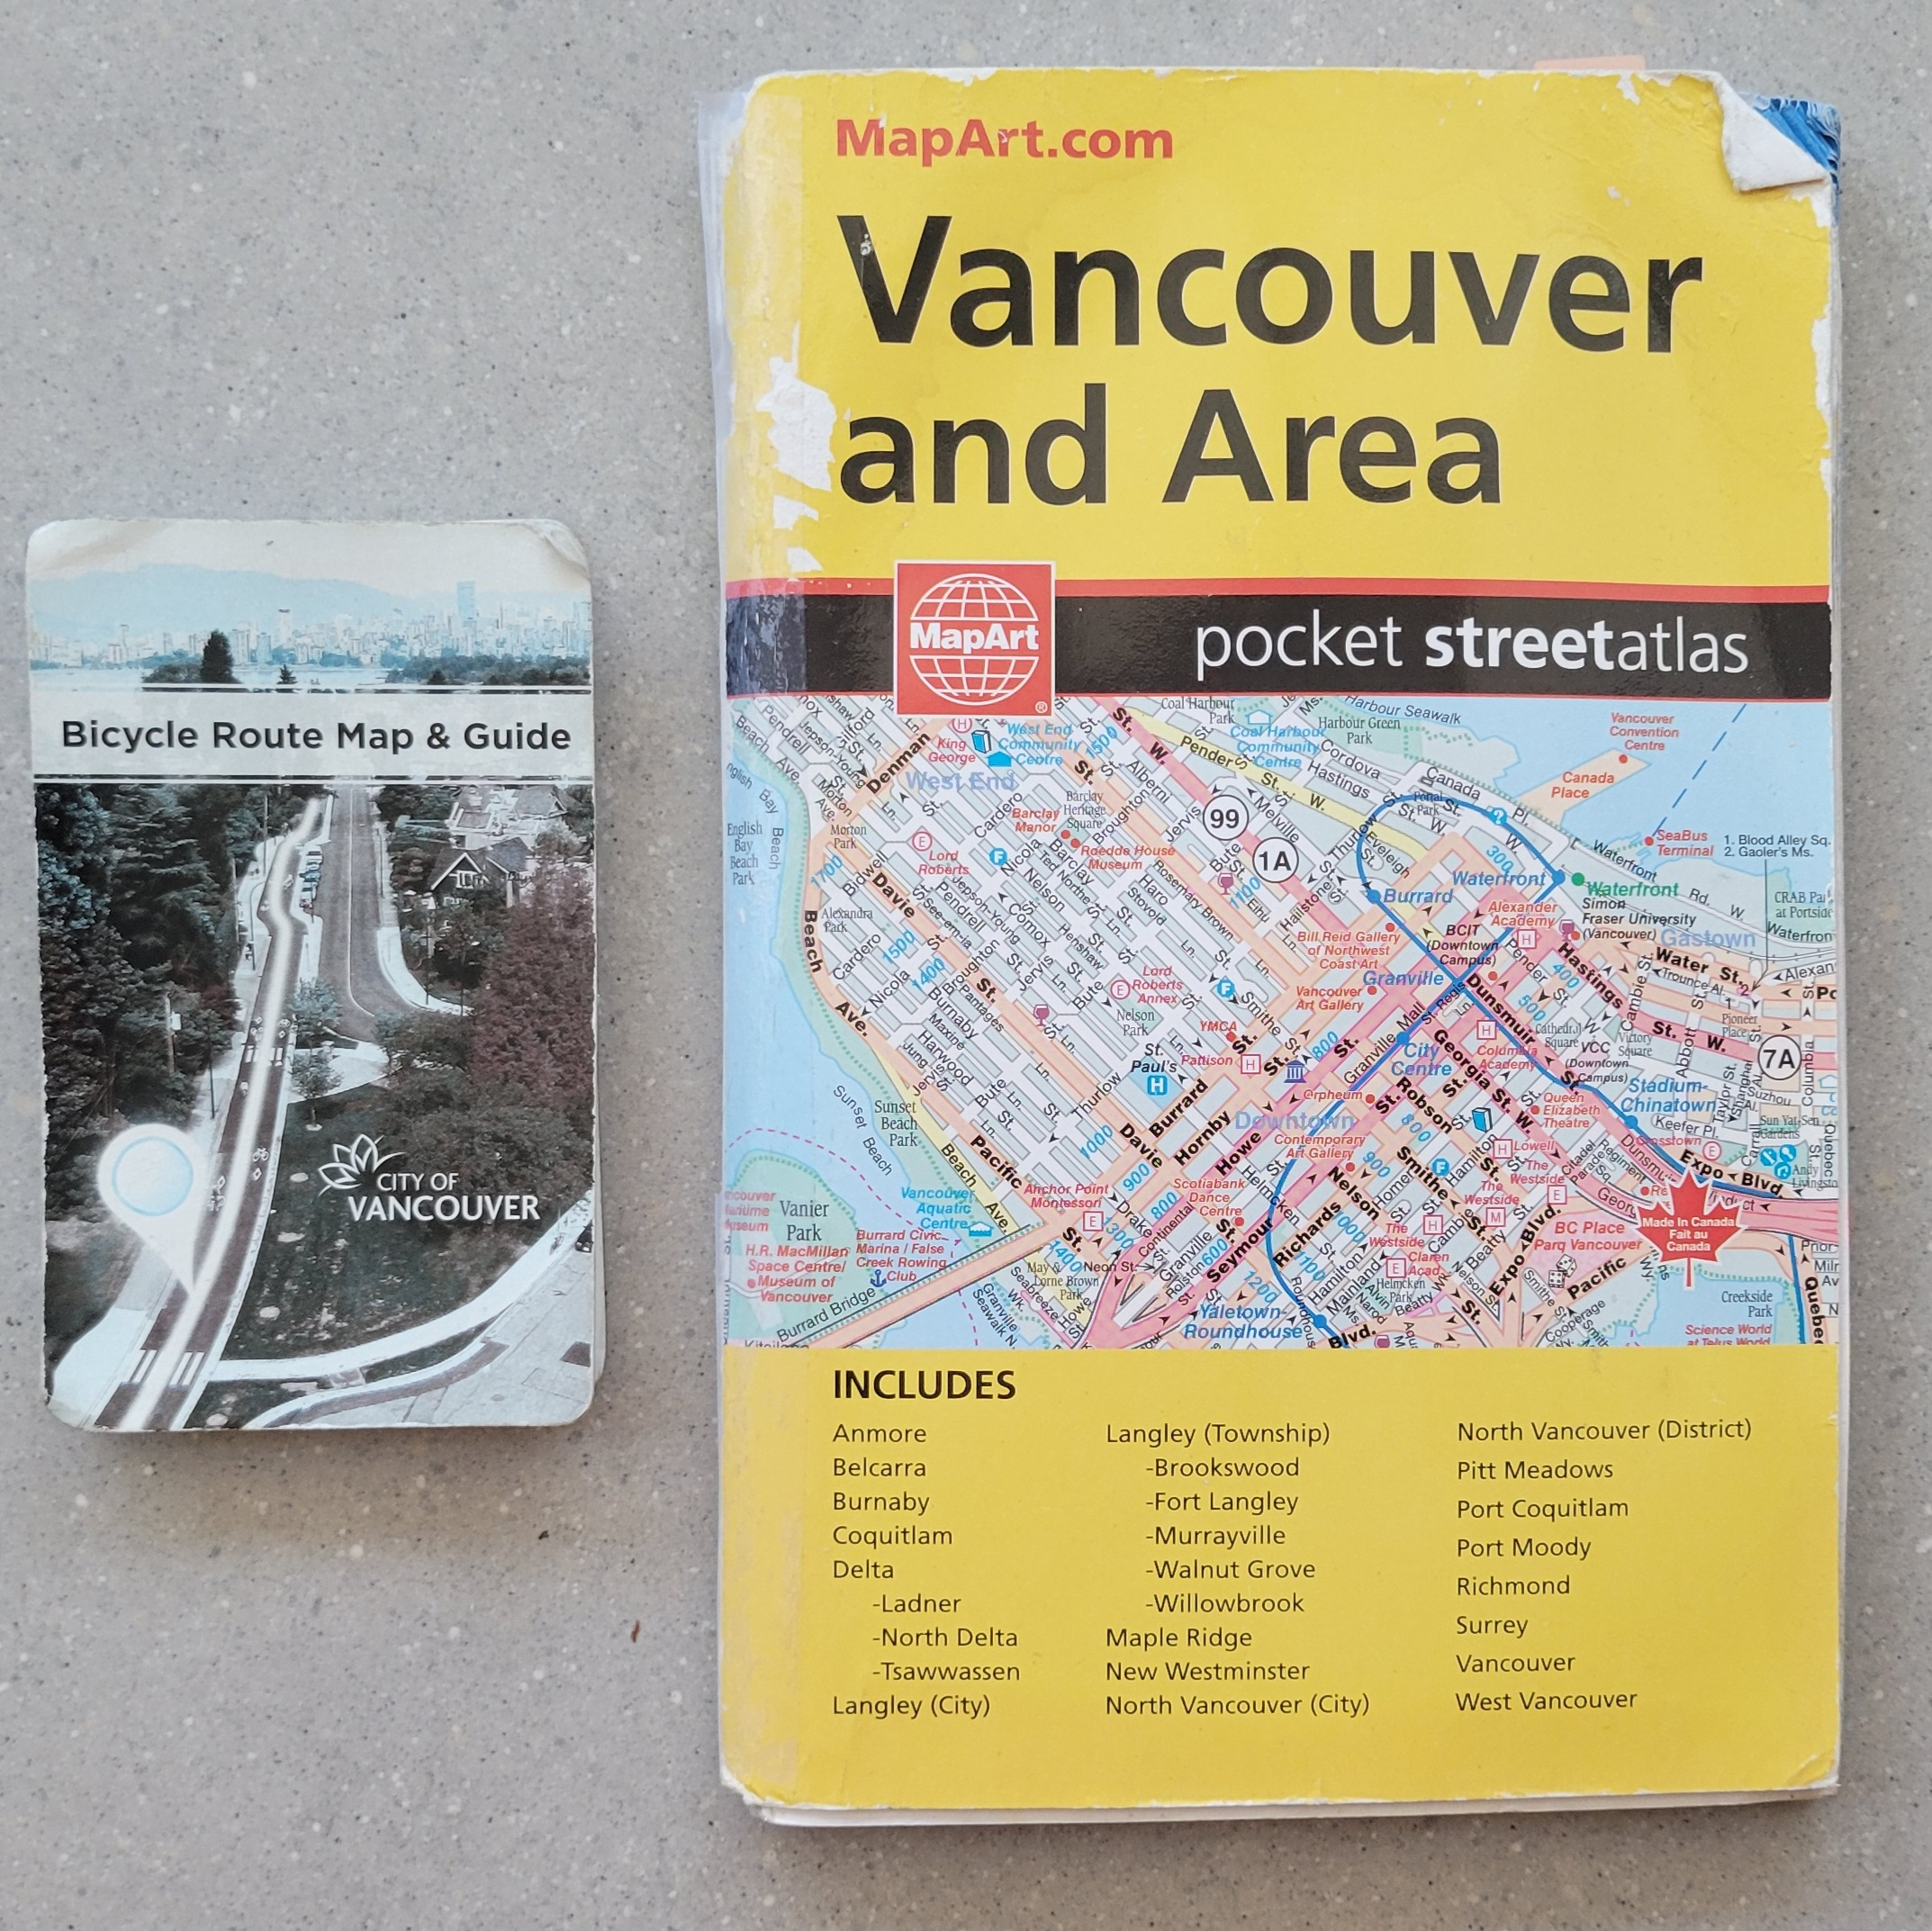
Other reference maps include road atlases, pocket atlases, or transport specific maps such as the below cycling map of Vancouver. The reference map most often used in your everyday is Google Maps.
Loading last updated date...