Make a Heatmap
This page will guide you through making a heatmap with QGIS.
First, add or turn on the dougFirs layer from earlier.
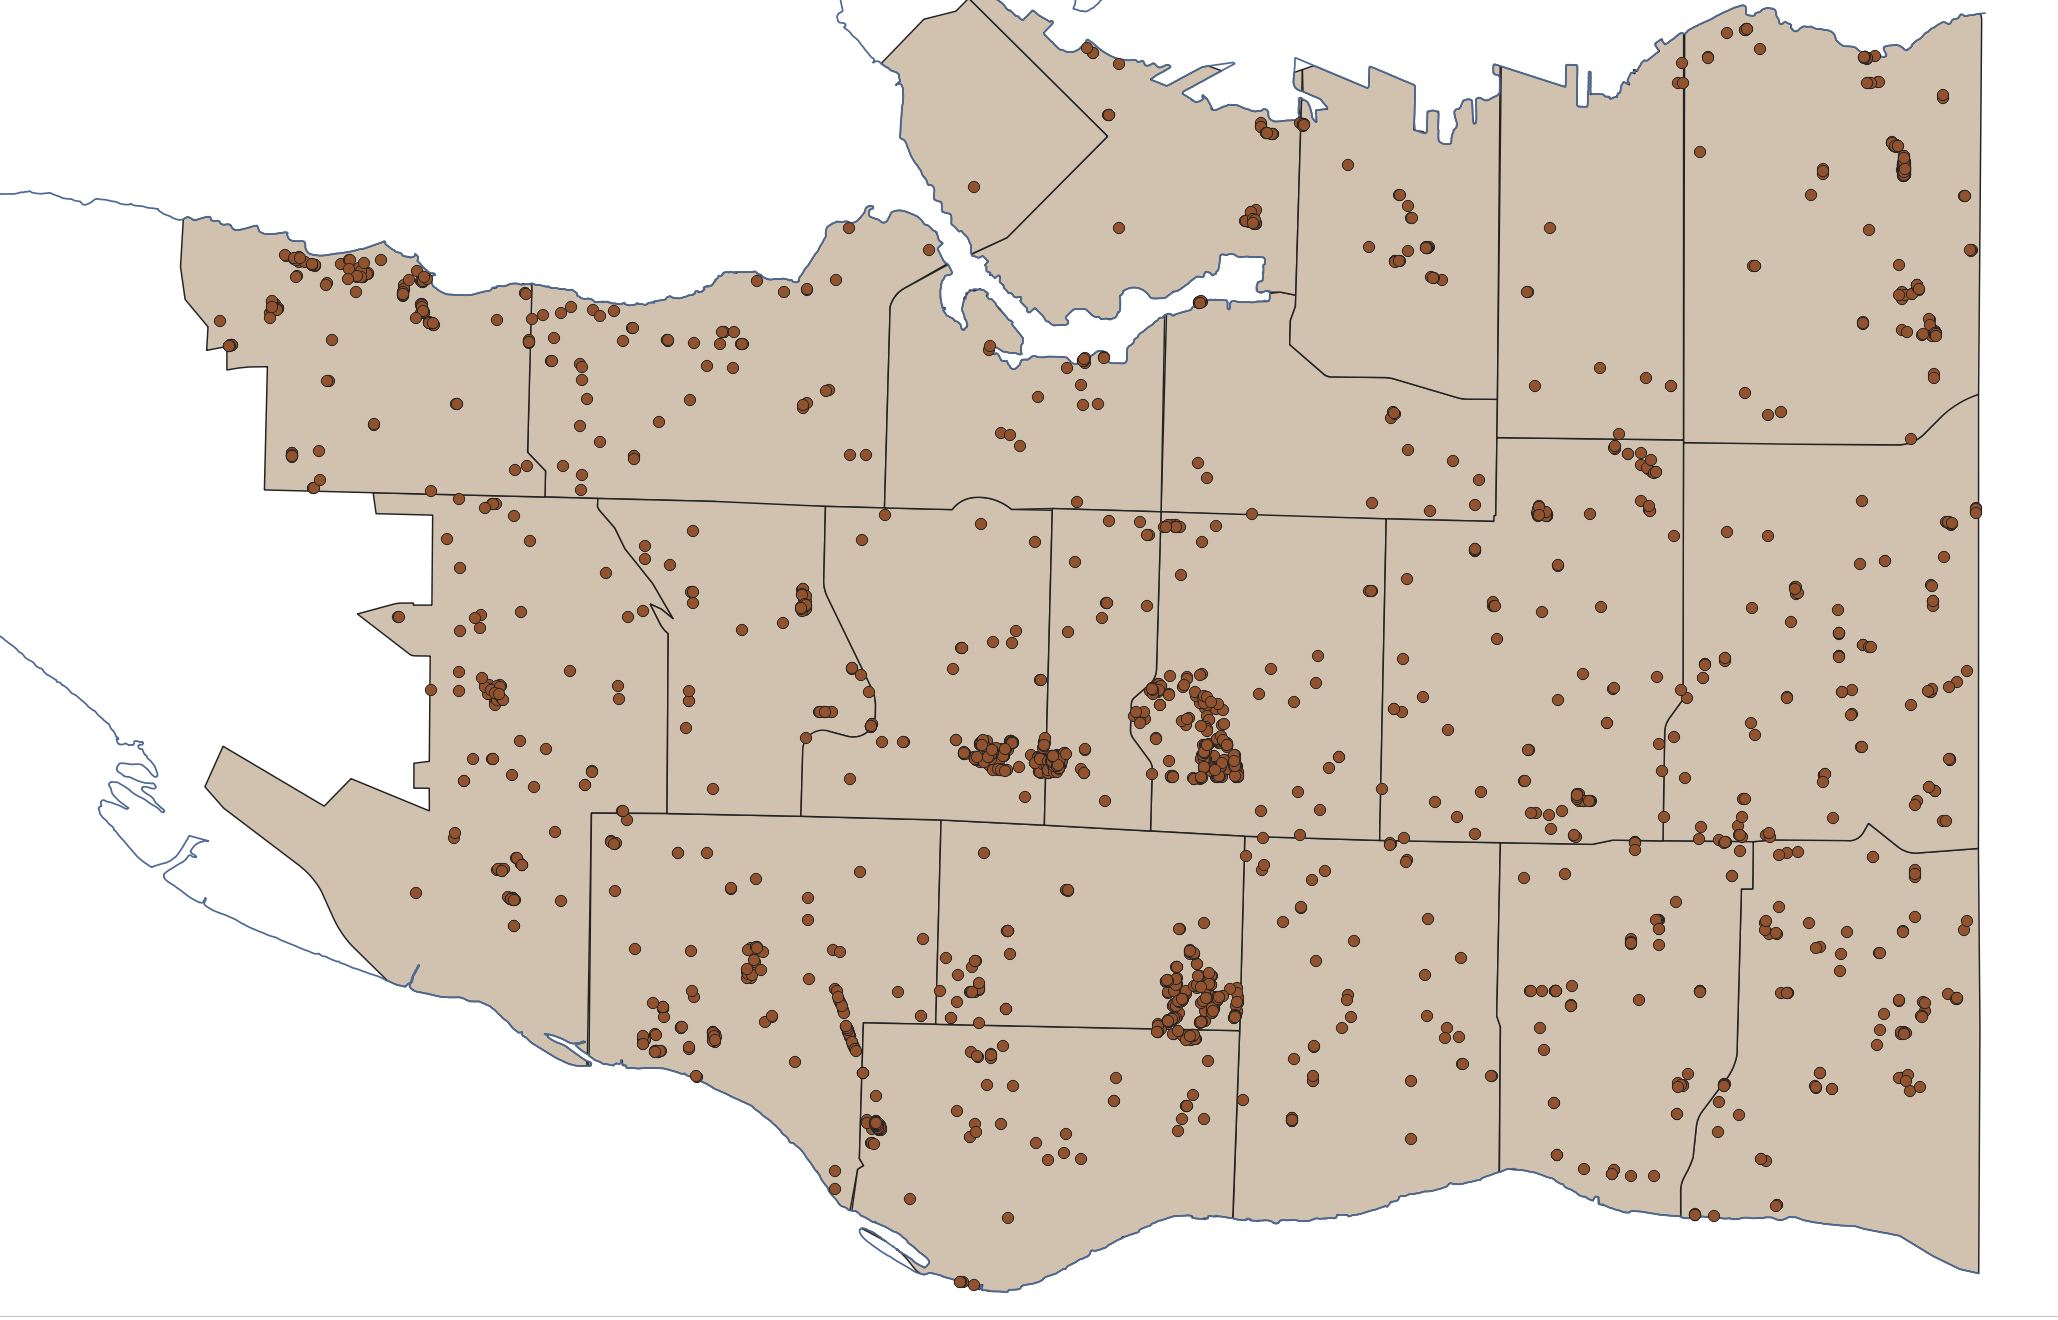
- Open Symbology from the Layer Properties.
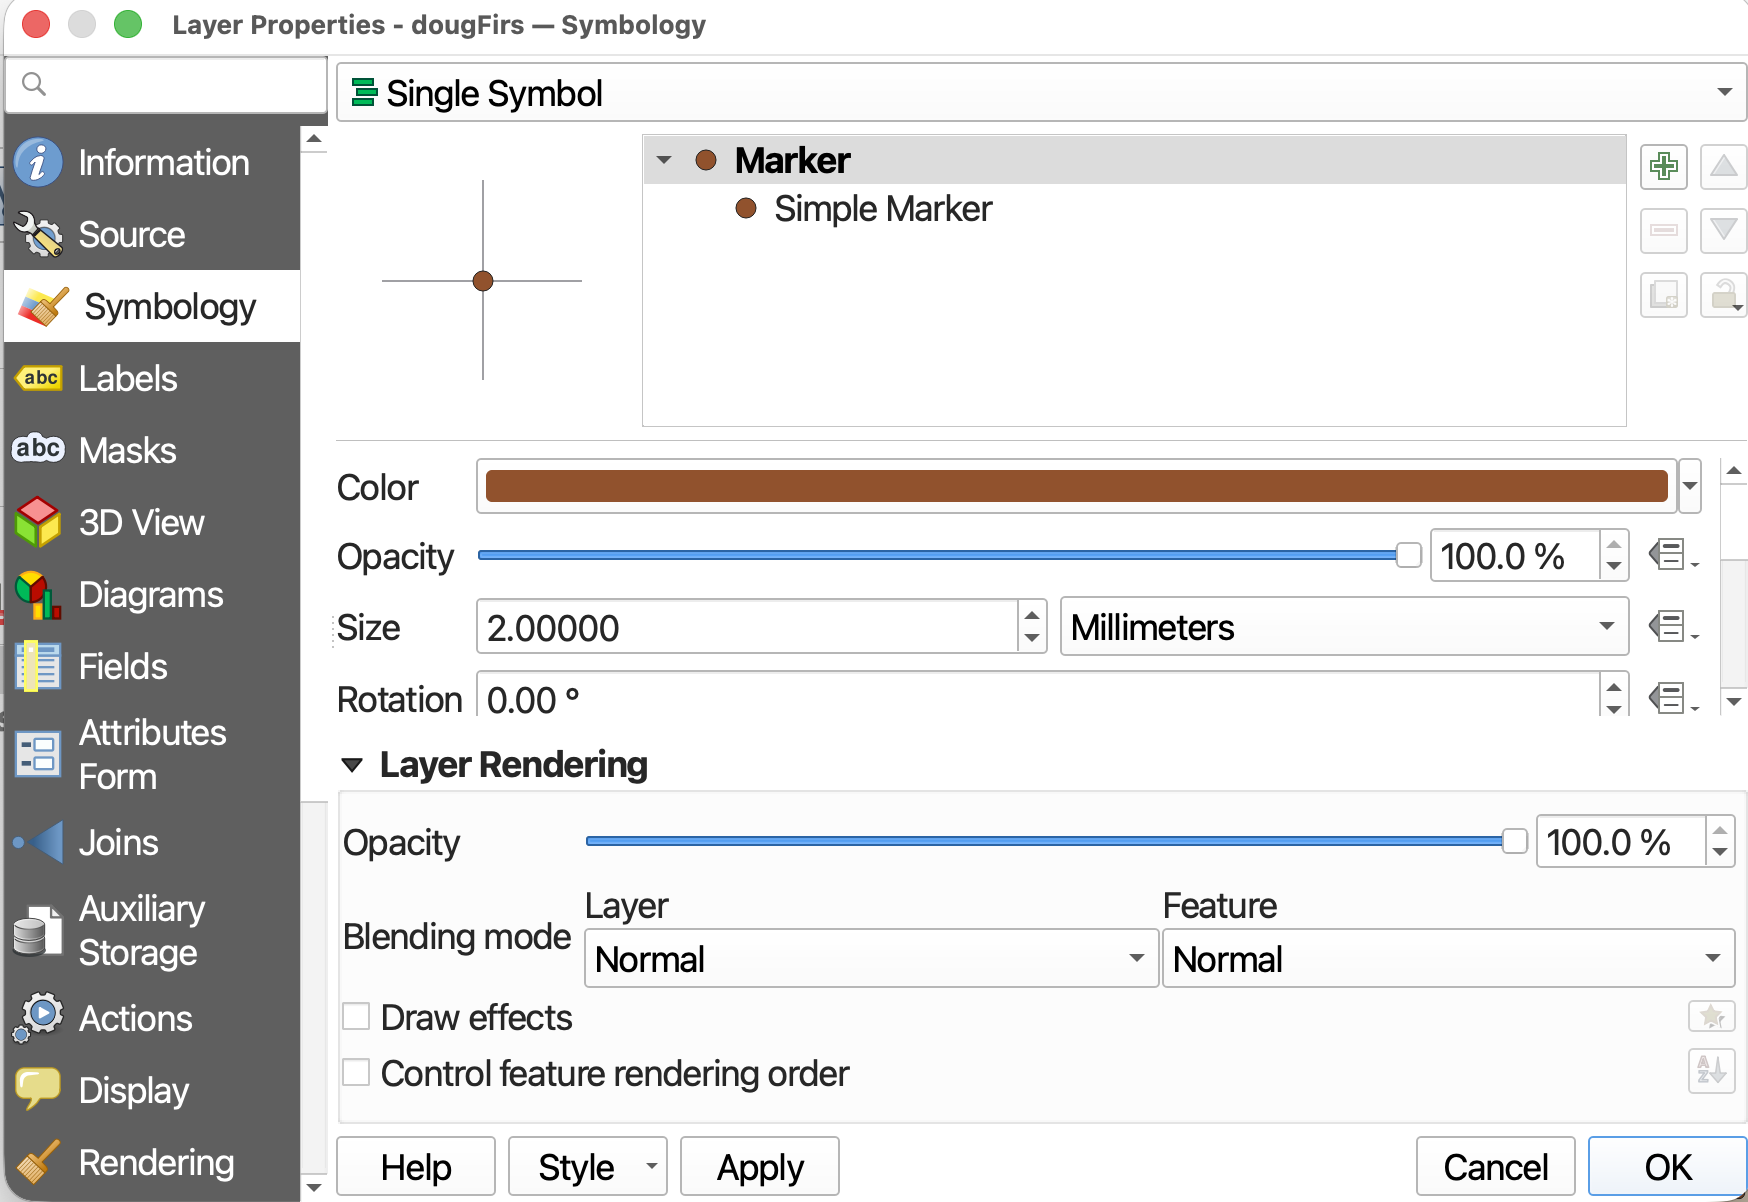
- Change Symbology type from Single Symbol to Heatmap
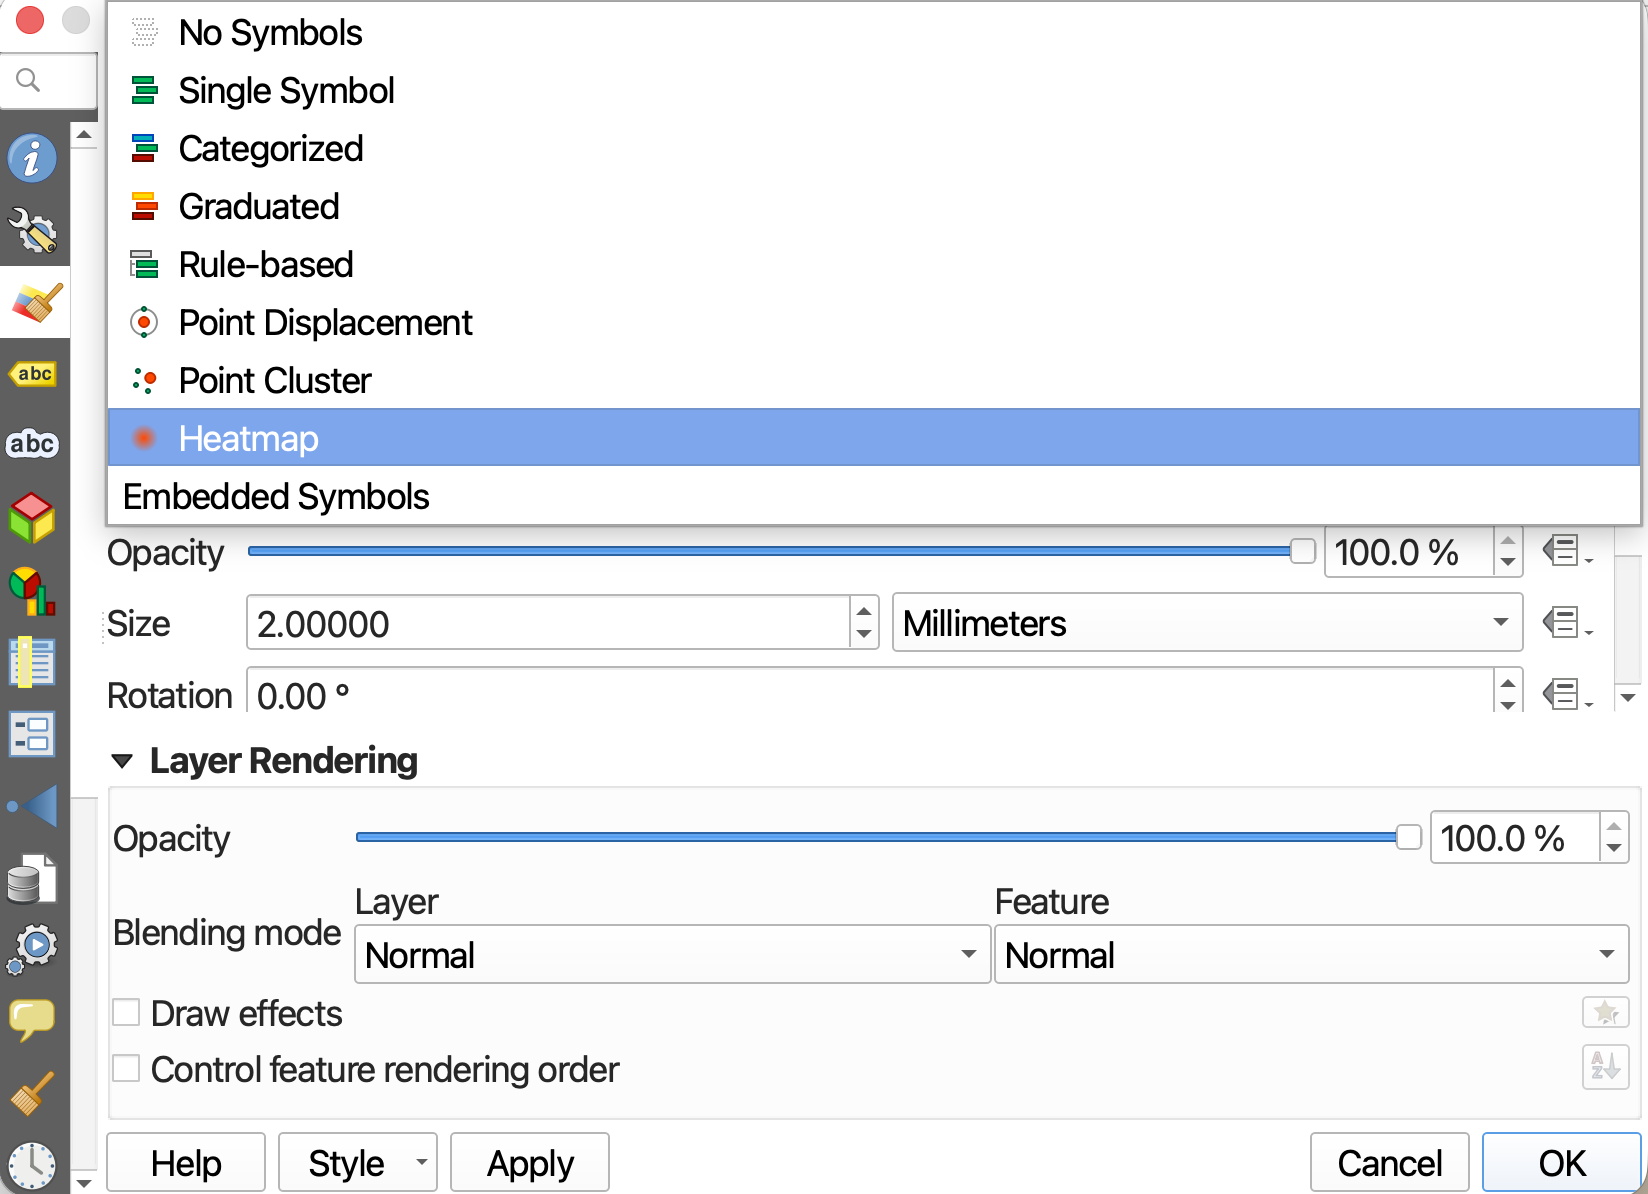
- To begin, let’s just hit Apply and see what happens.
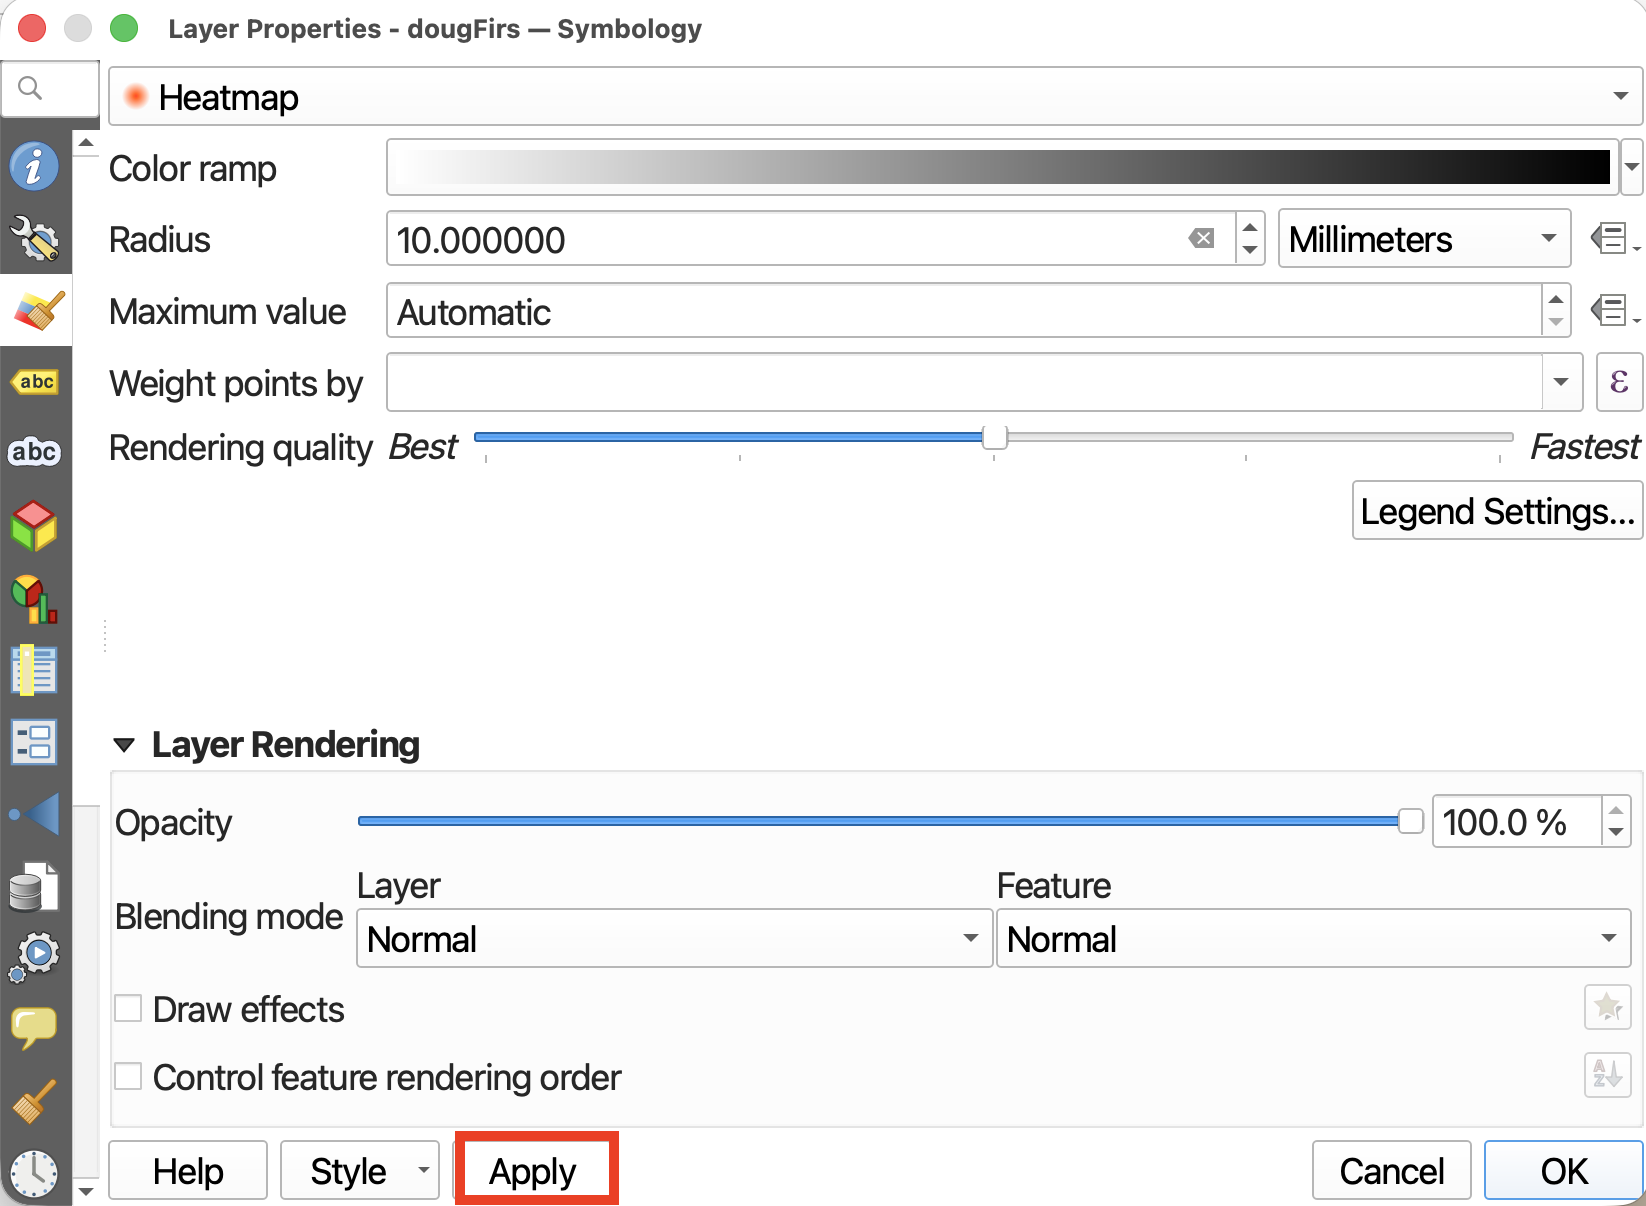
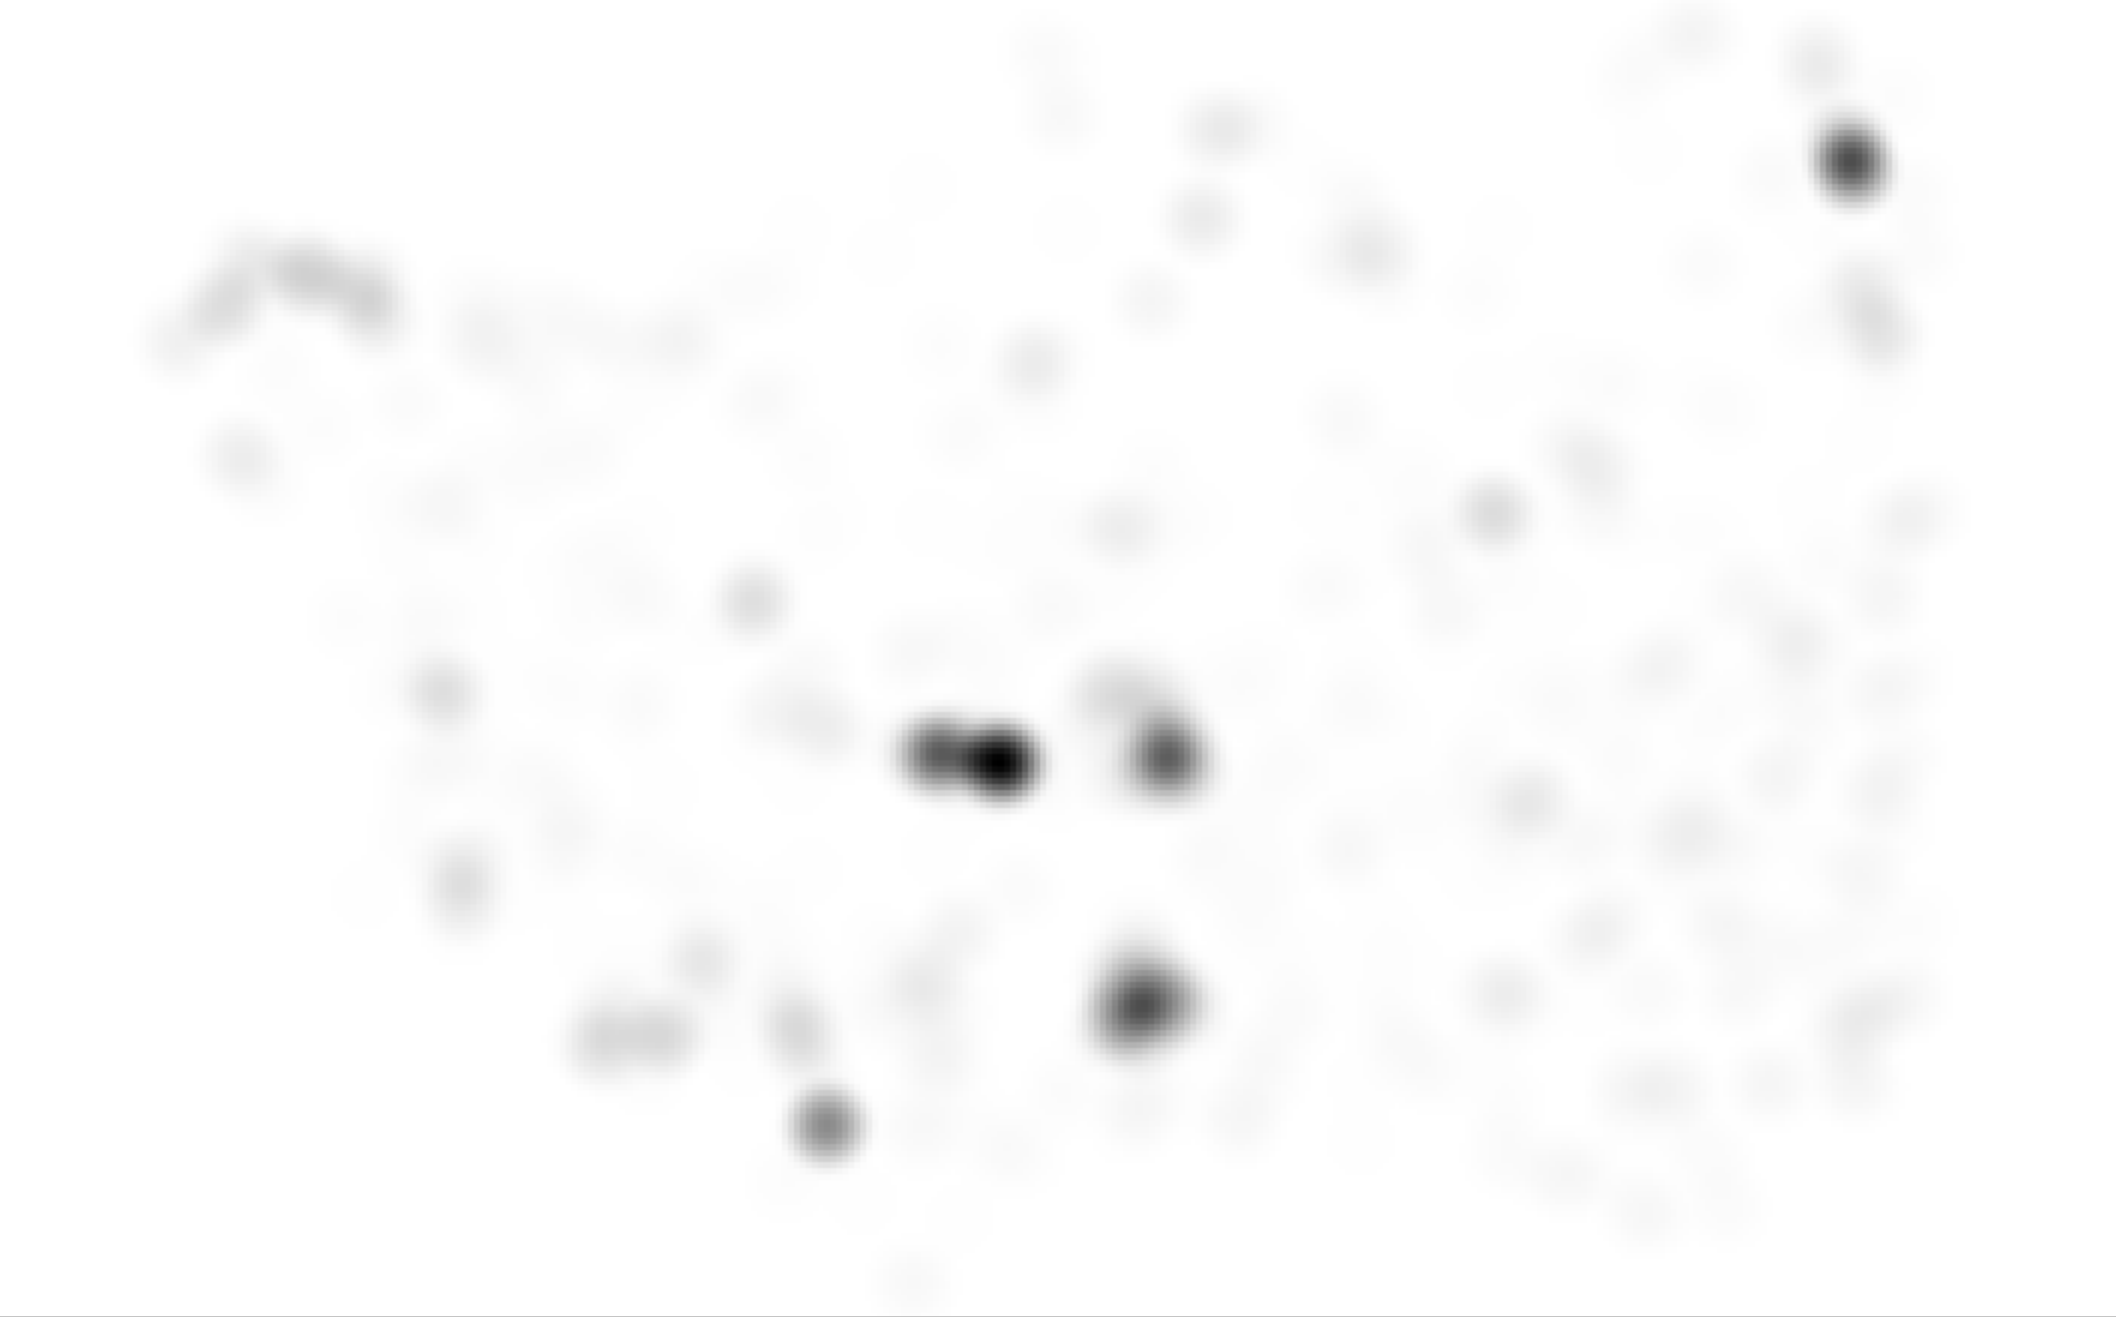
Adjusting Symbology
The reason you can no longer see the map beneath is that all distances away from a douglas fir have been given a pixel color along the color ramp, with those farthest away being solid white. To make these areas transparent, we will adjust the color ramp.
- First, choose a different color such as greens.
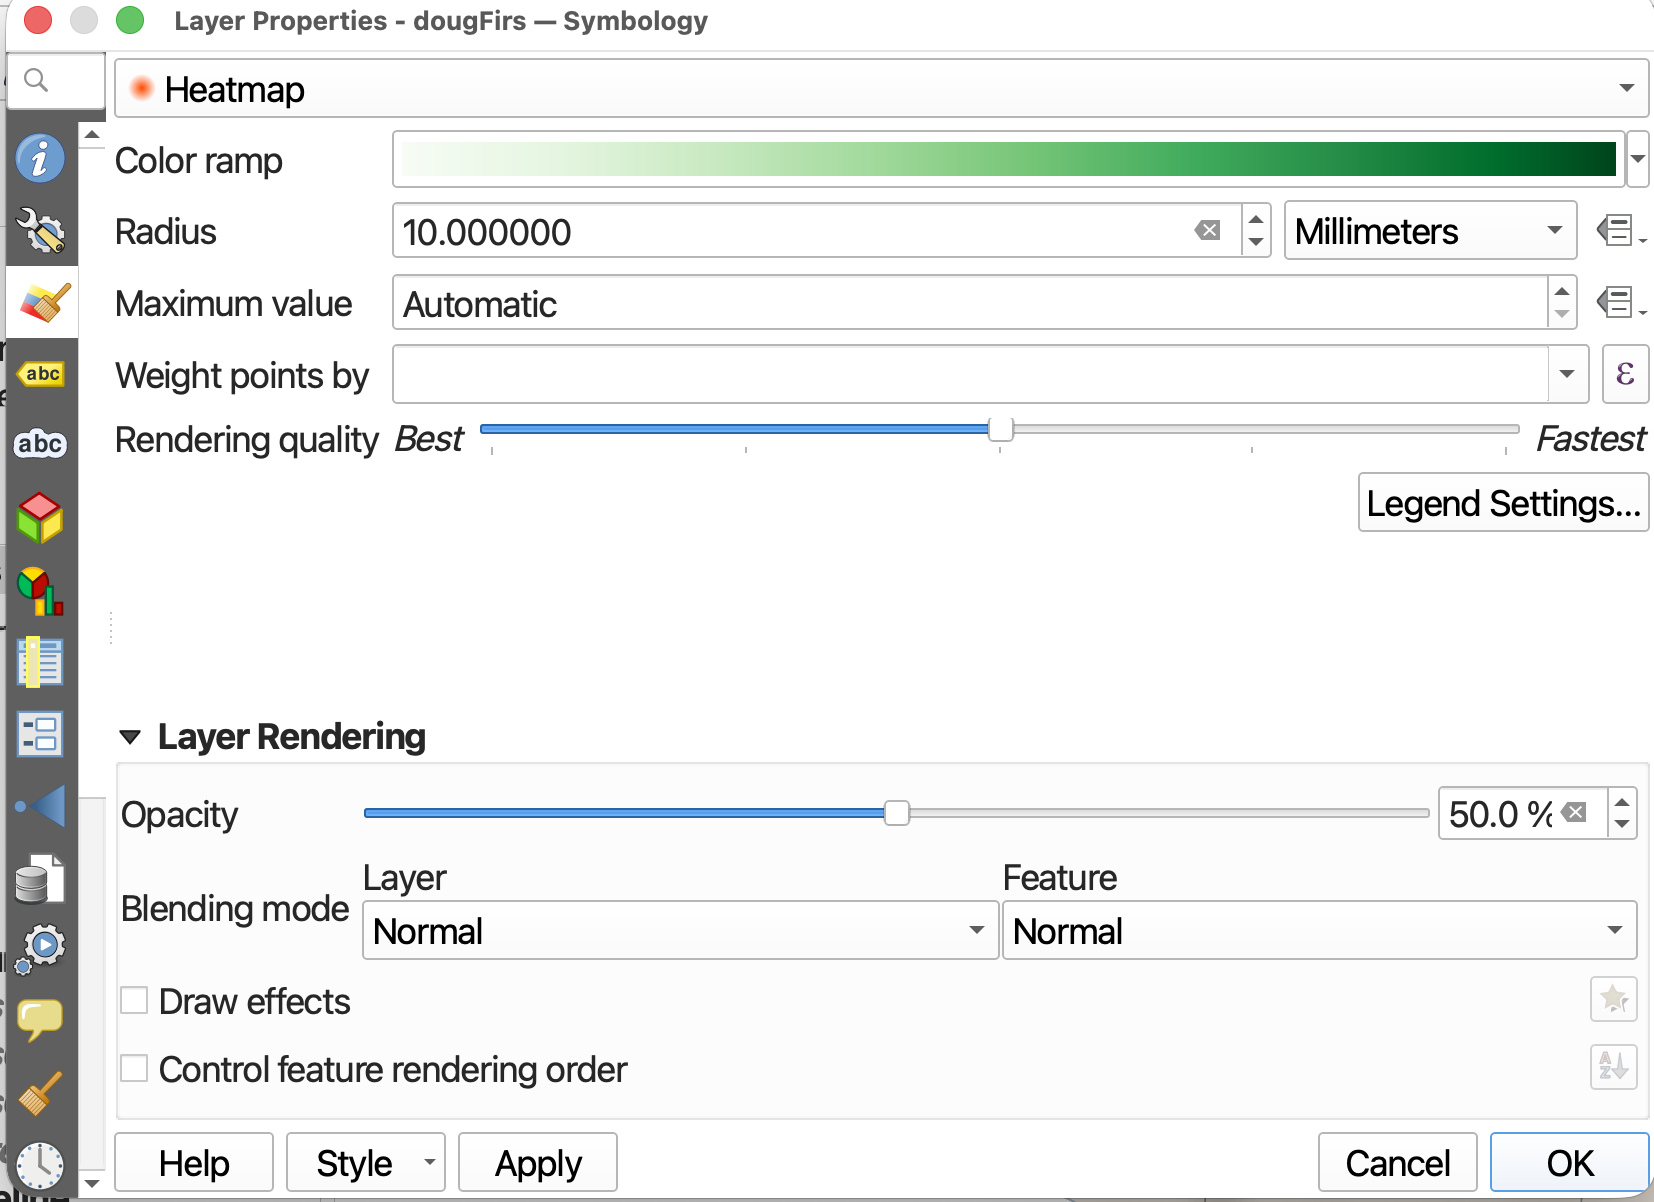
- Next, click the color ramp itself to edit it.
- Click on Color 1.
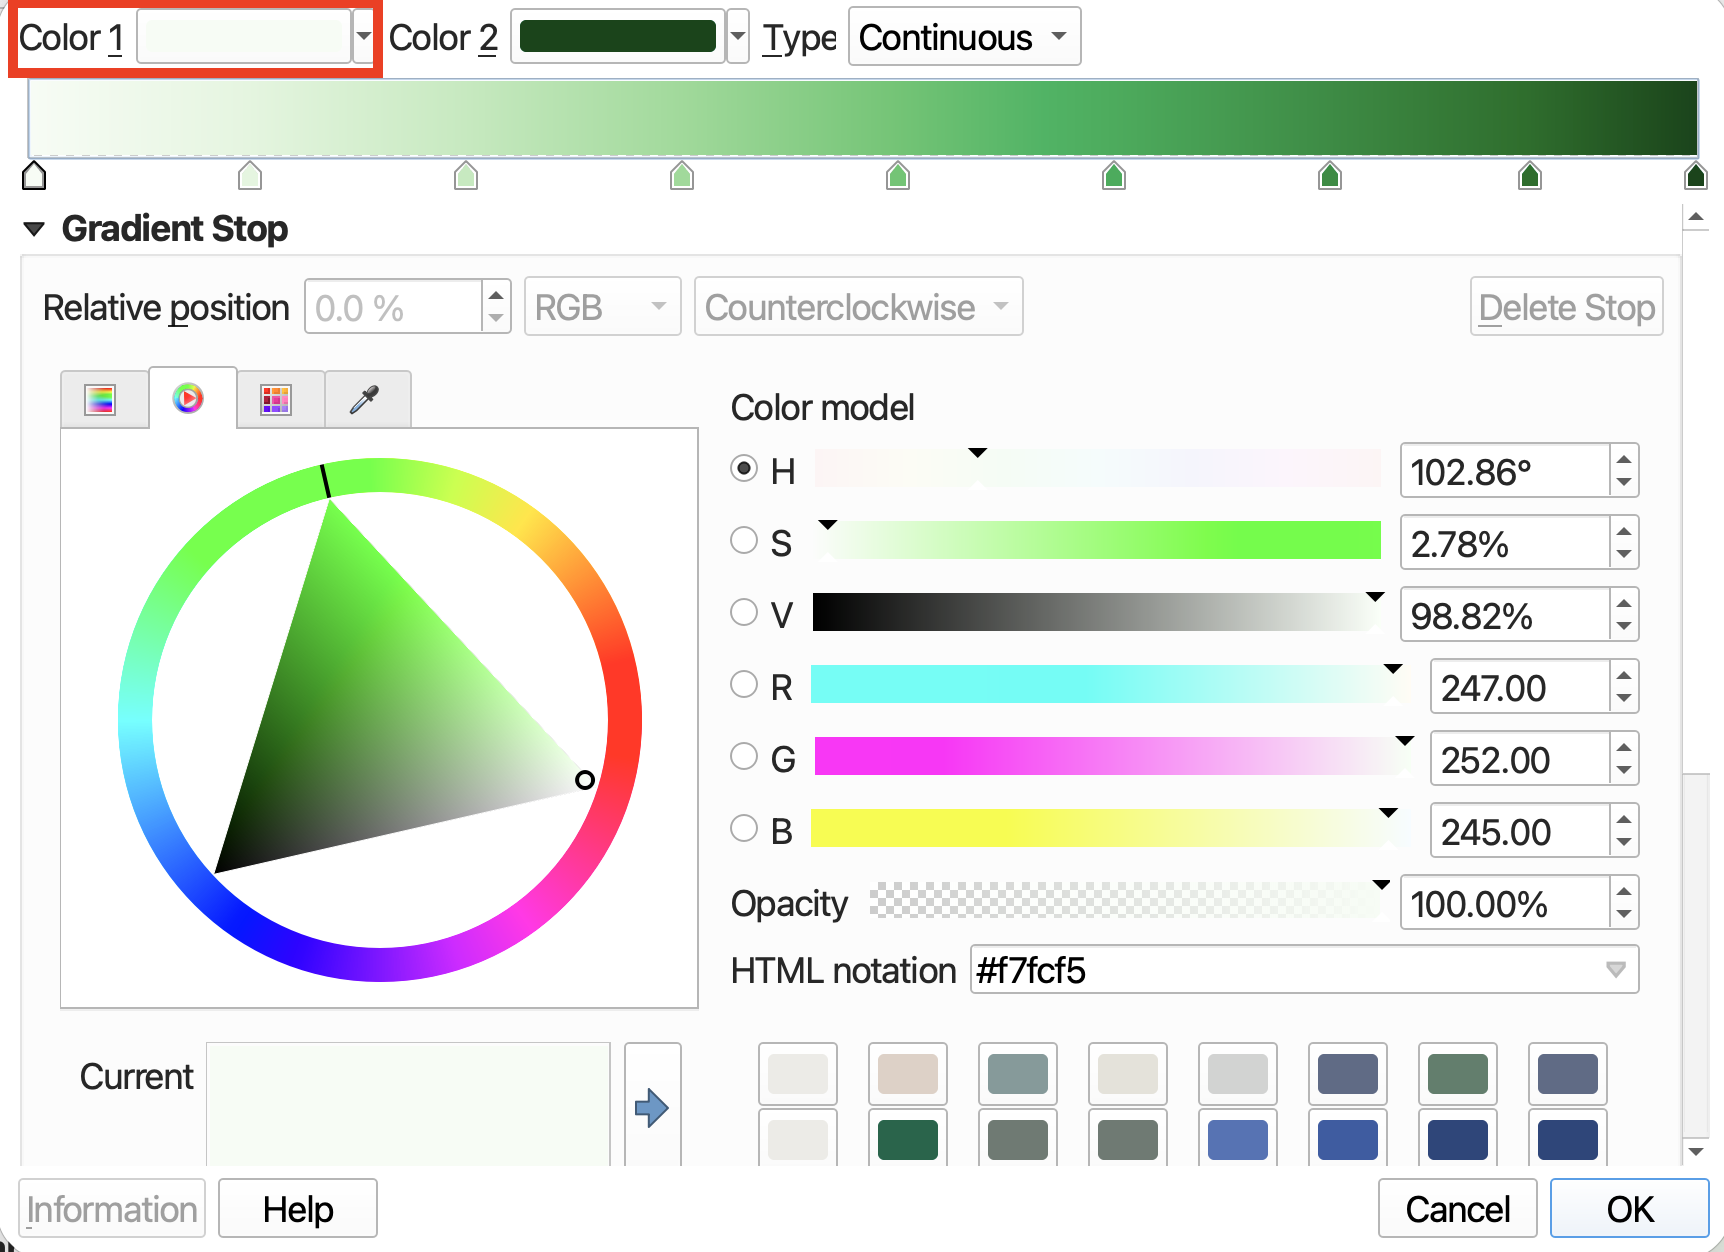
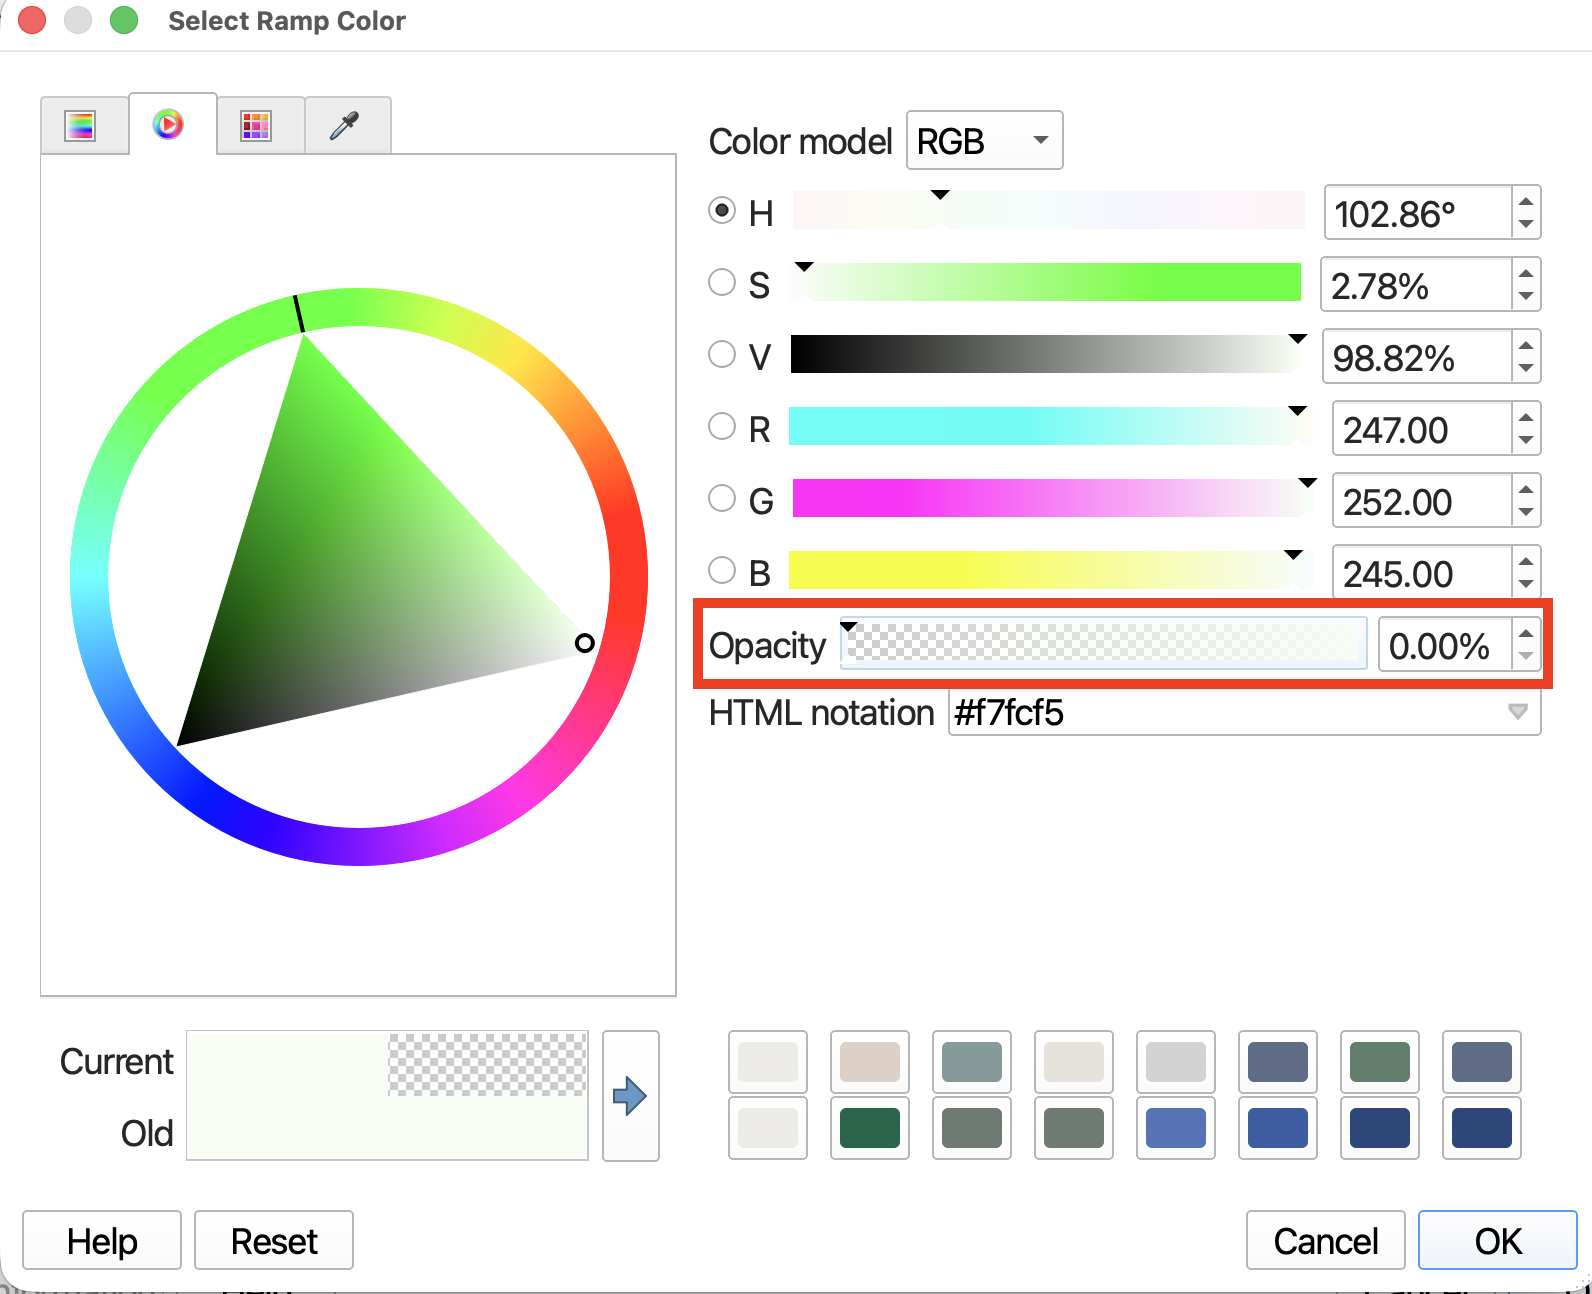
- Drop the Opacity down to
0.
- Click OK and OK again, and then Apply to see what this looks like on your map canvas.
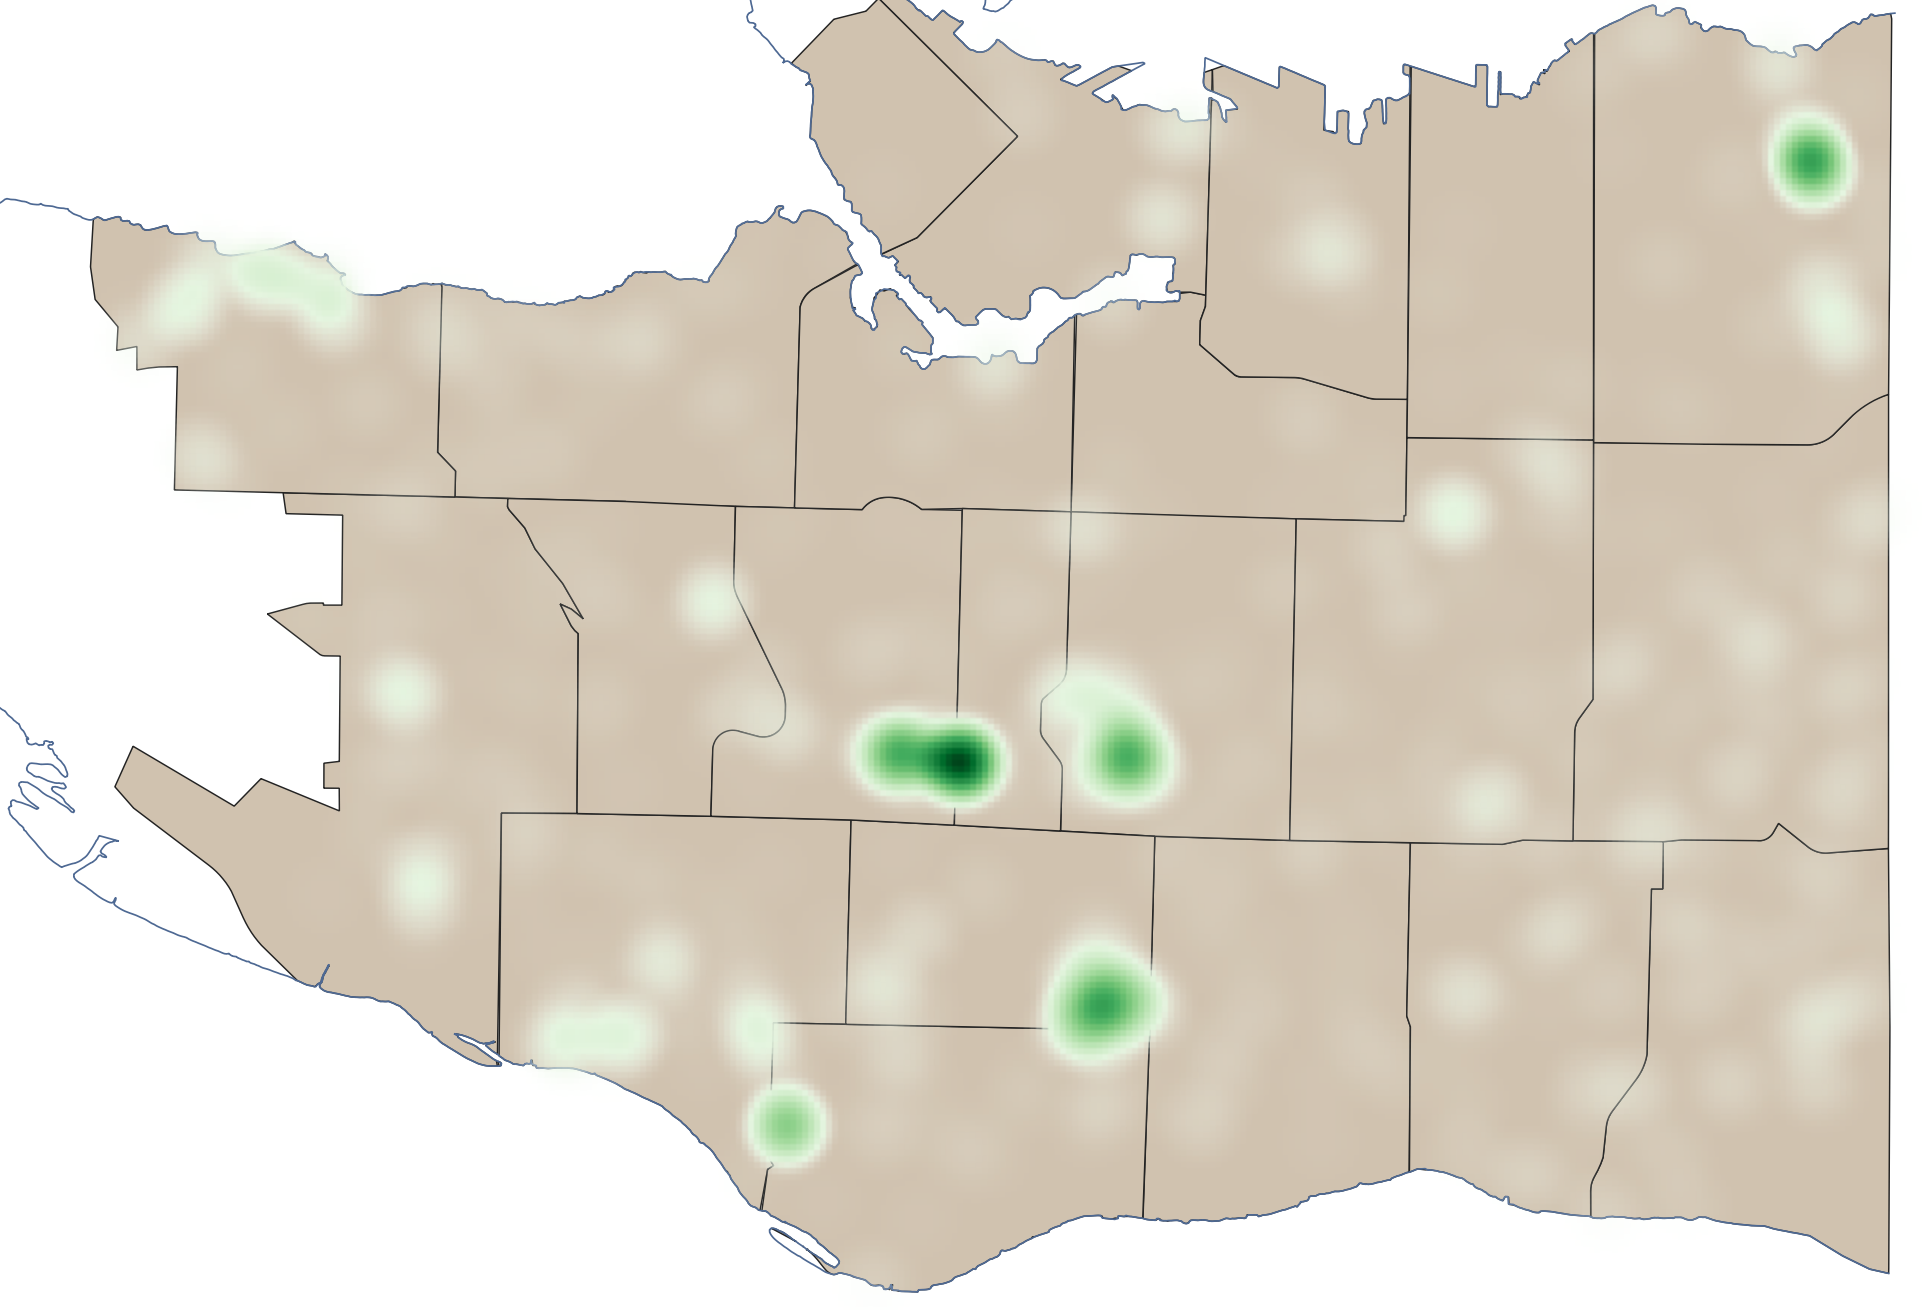
You can now also adjust the Radius if you’d like.
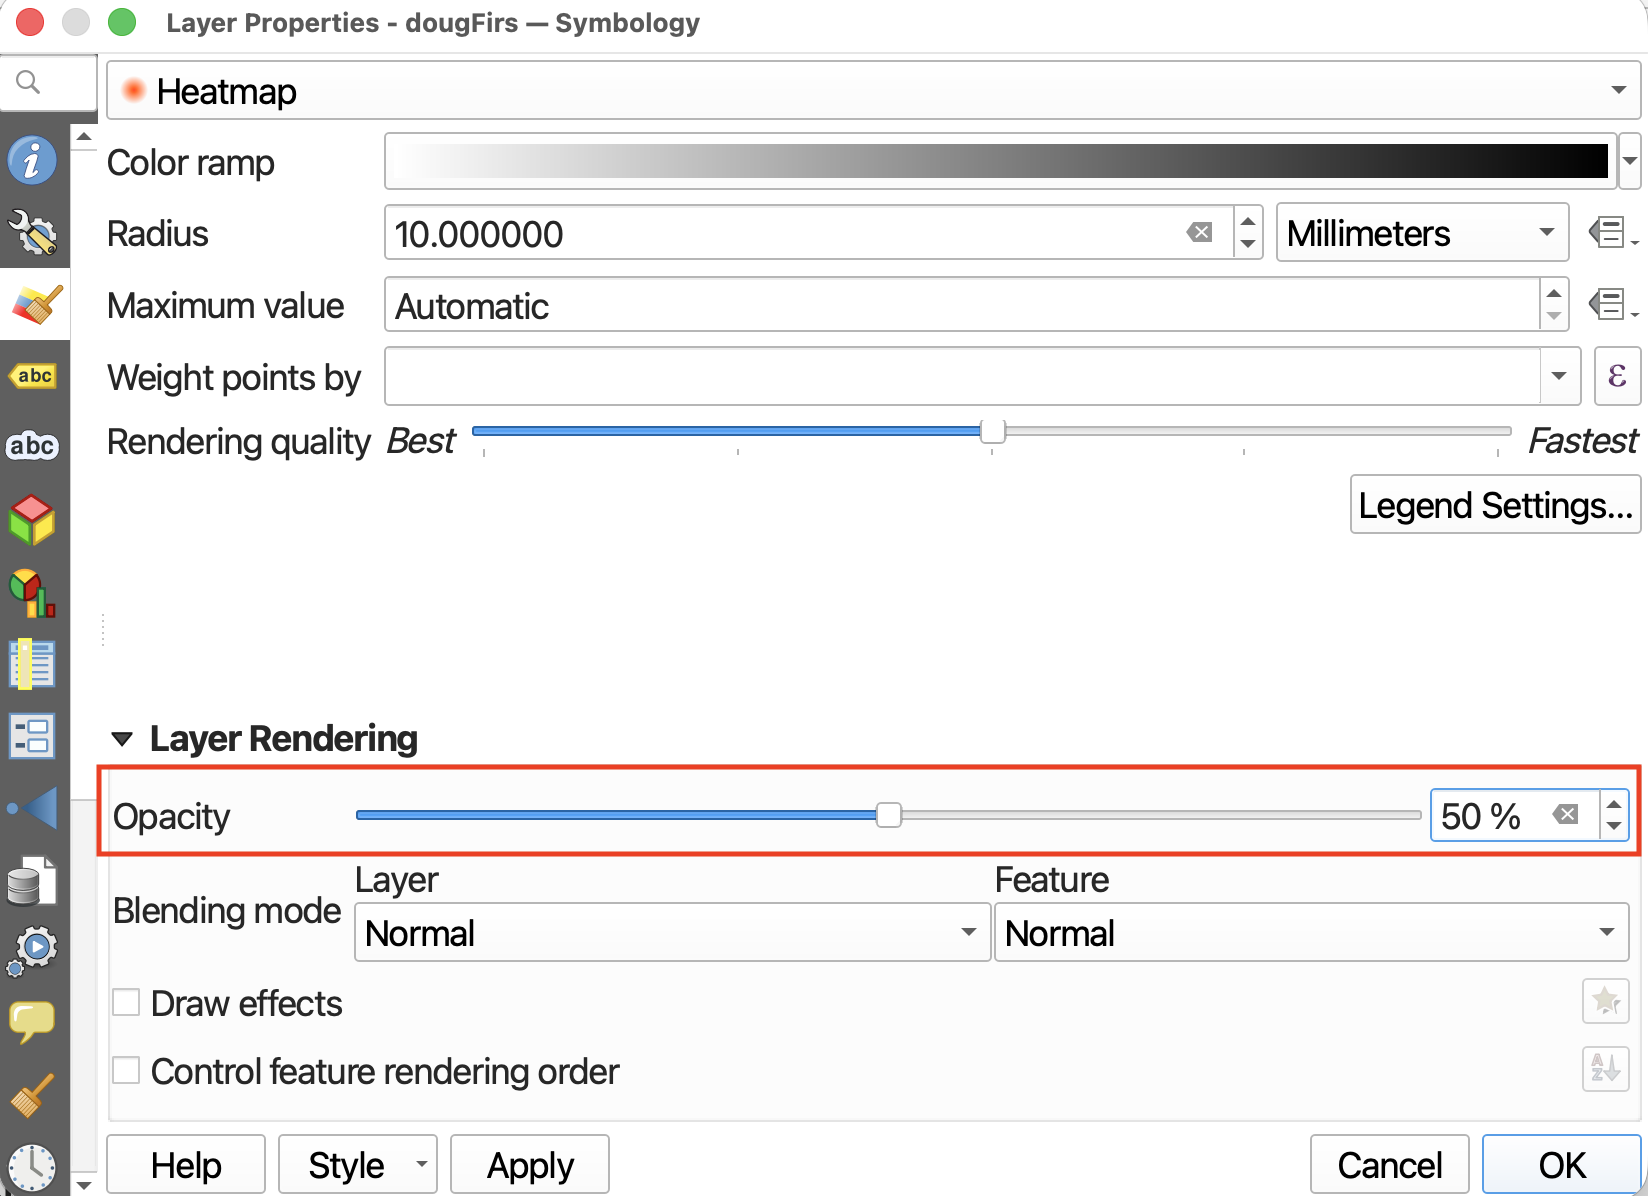
You can also adjust the Layer Opacity if you want the heatmap to be a semi-transparent overlay.
Additional Resources
- More detailed tutorial on creating heatmaps with (an older version of) QGIS and practice dataset.
Loading last updated date...