Adding Labels
We now have two thematic visualizations of Douglas Fir street trees by Vancouver neighbourhood. However, some contextual information might be useful, such as the names of neighbourhoods and/or the total number of Douglas Firs in each neighbourhood.
Label Neighbourhoods
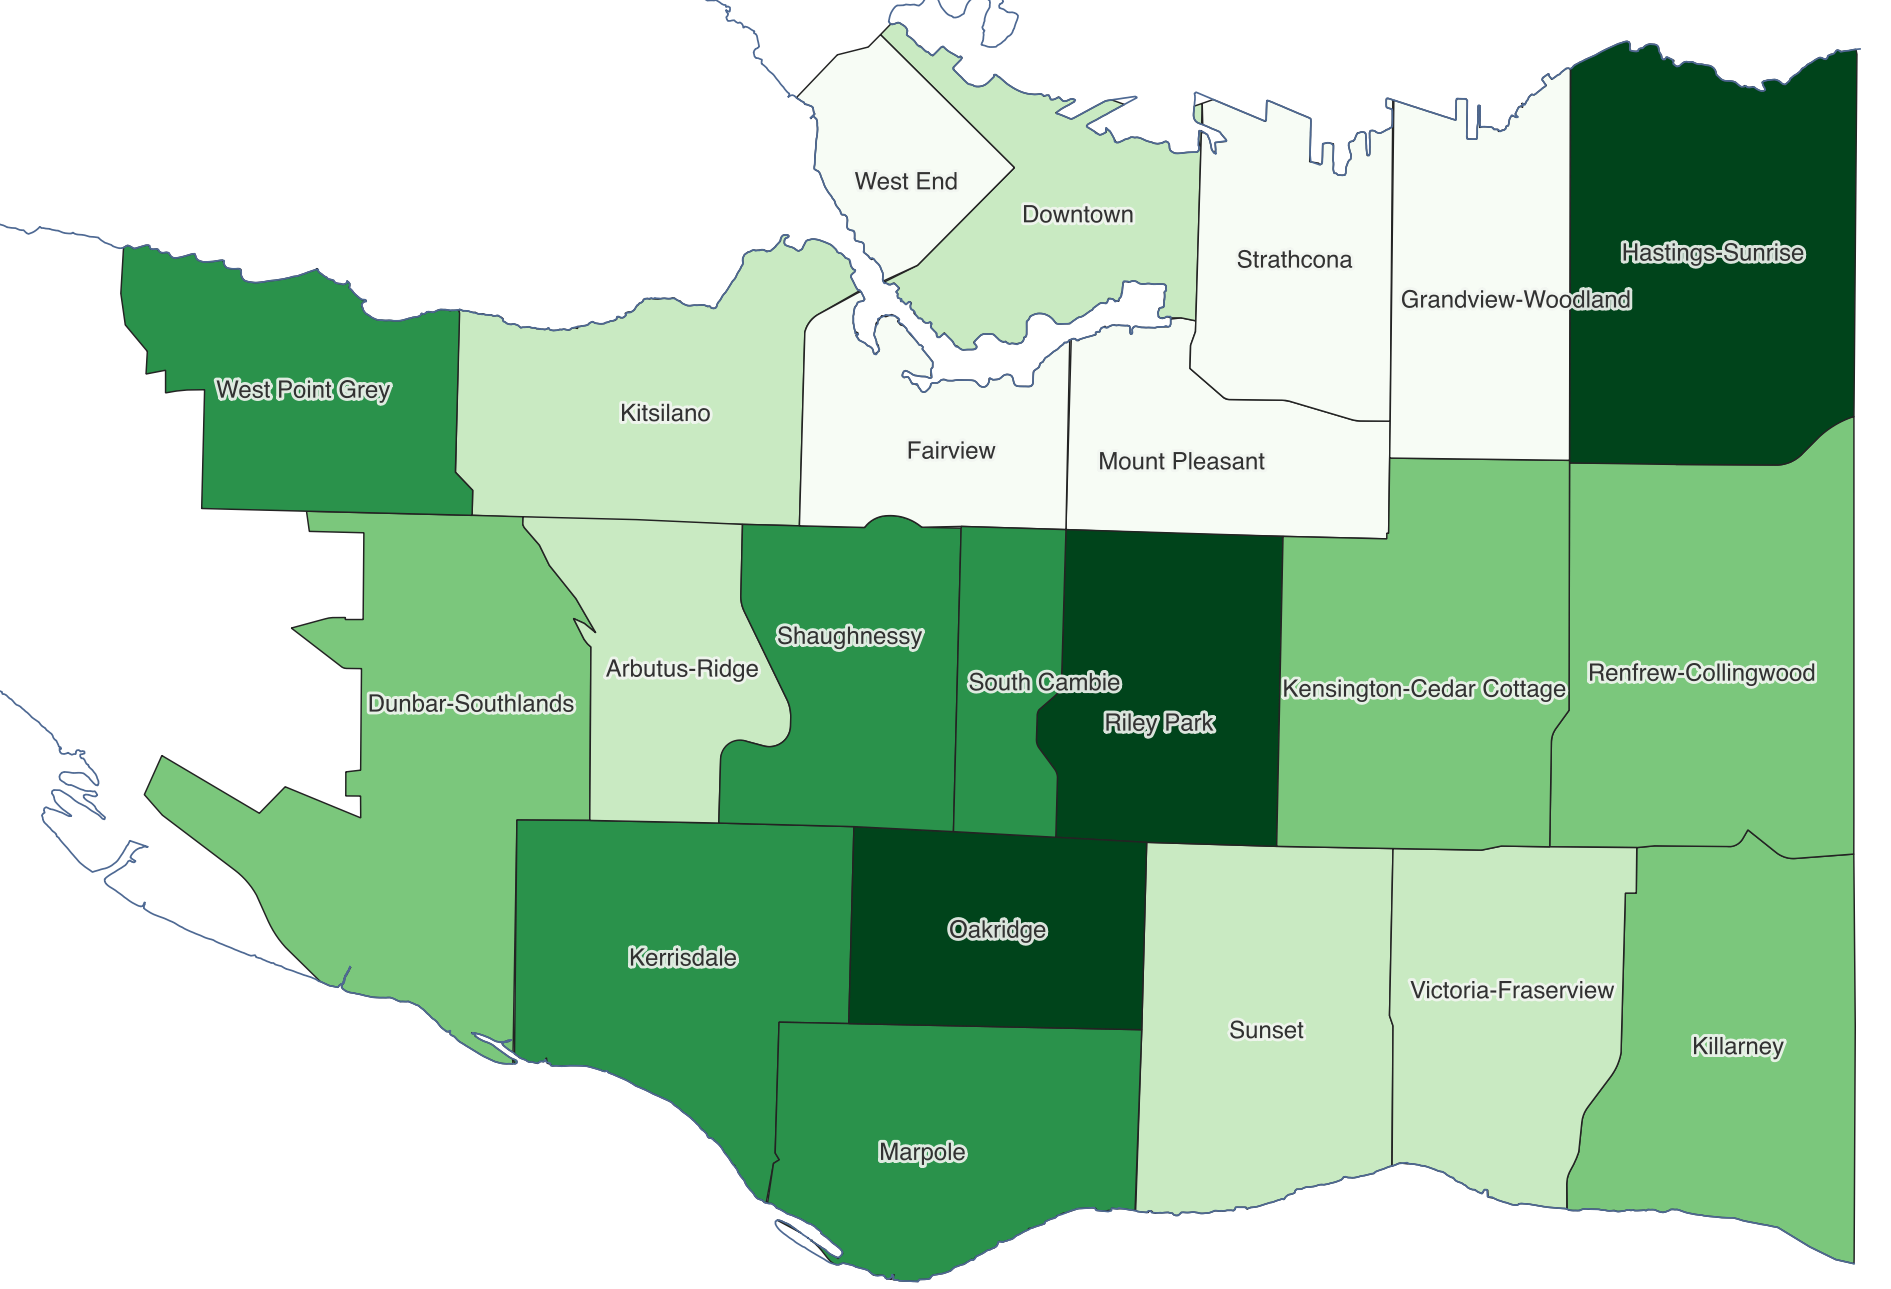
First, let’s add the names of neighbourhoods to our choropleth map. Turn the proportional symbol layer off so it isn’t distracting.
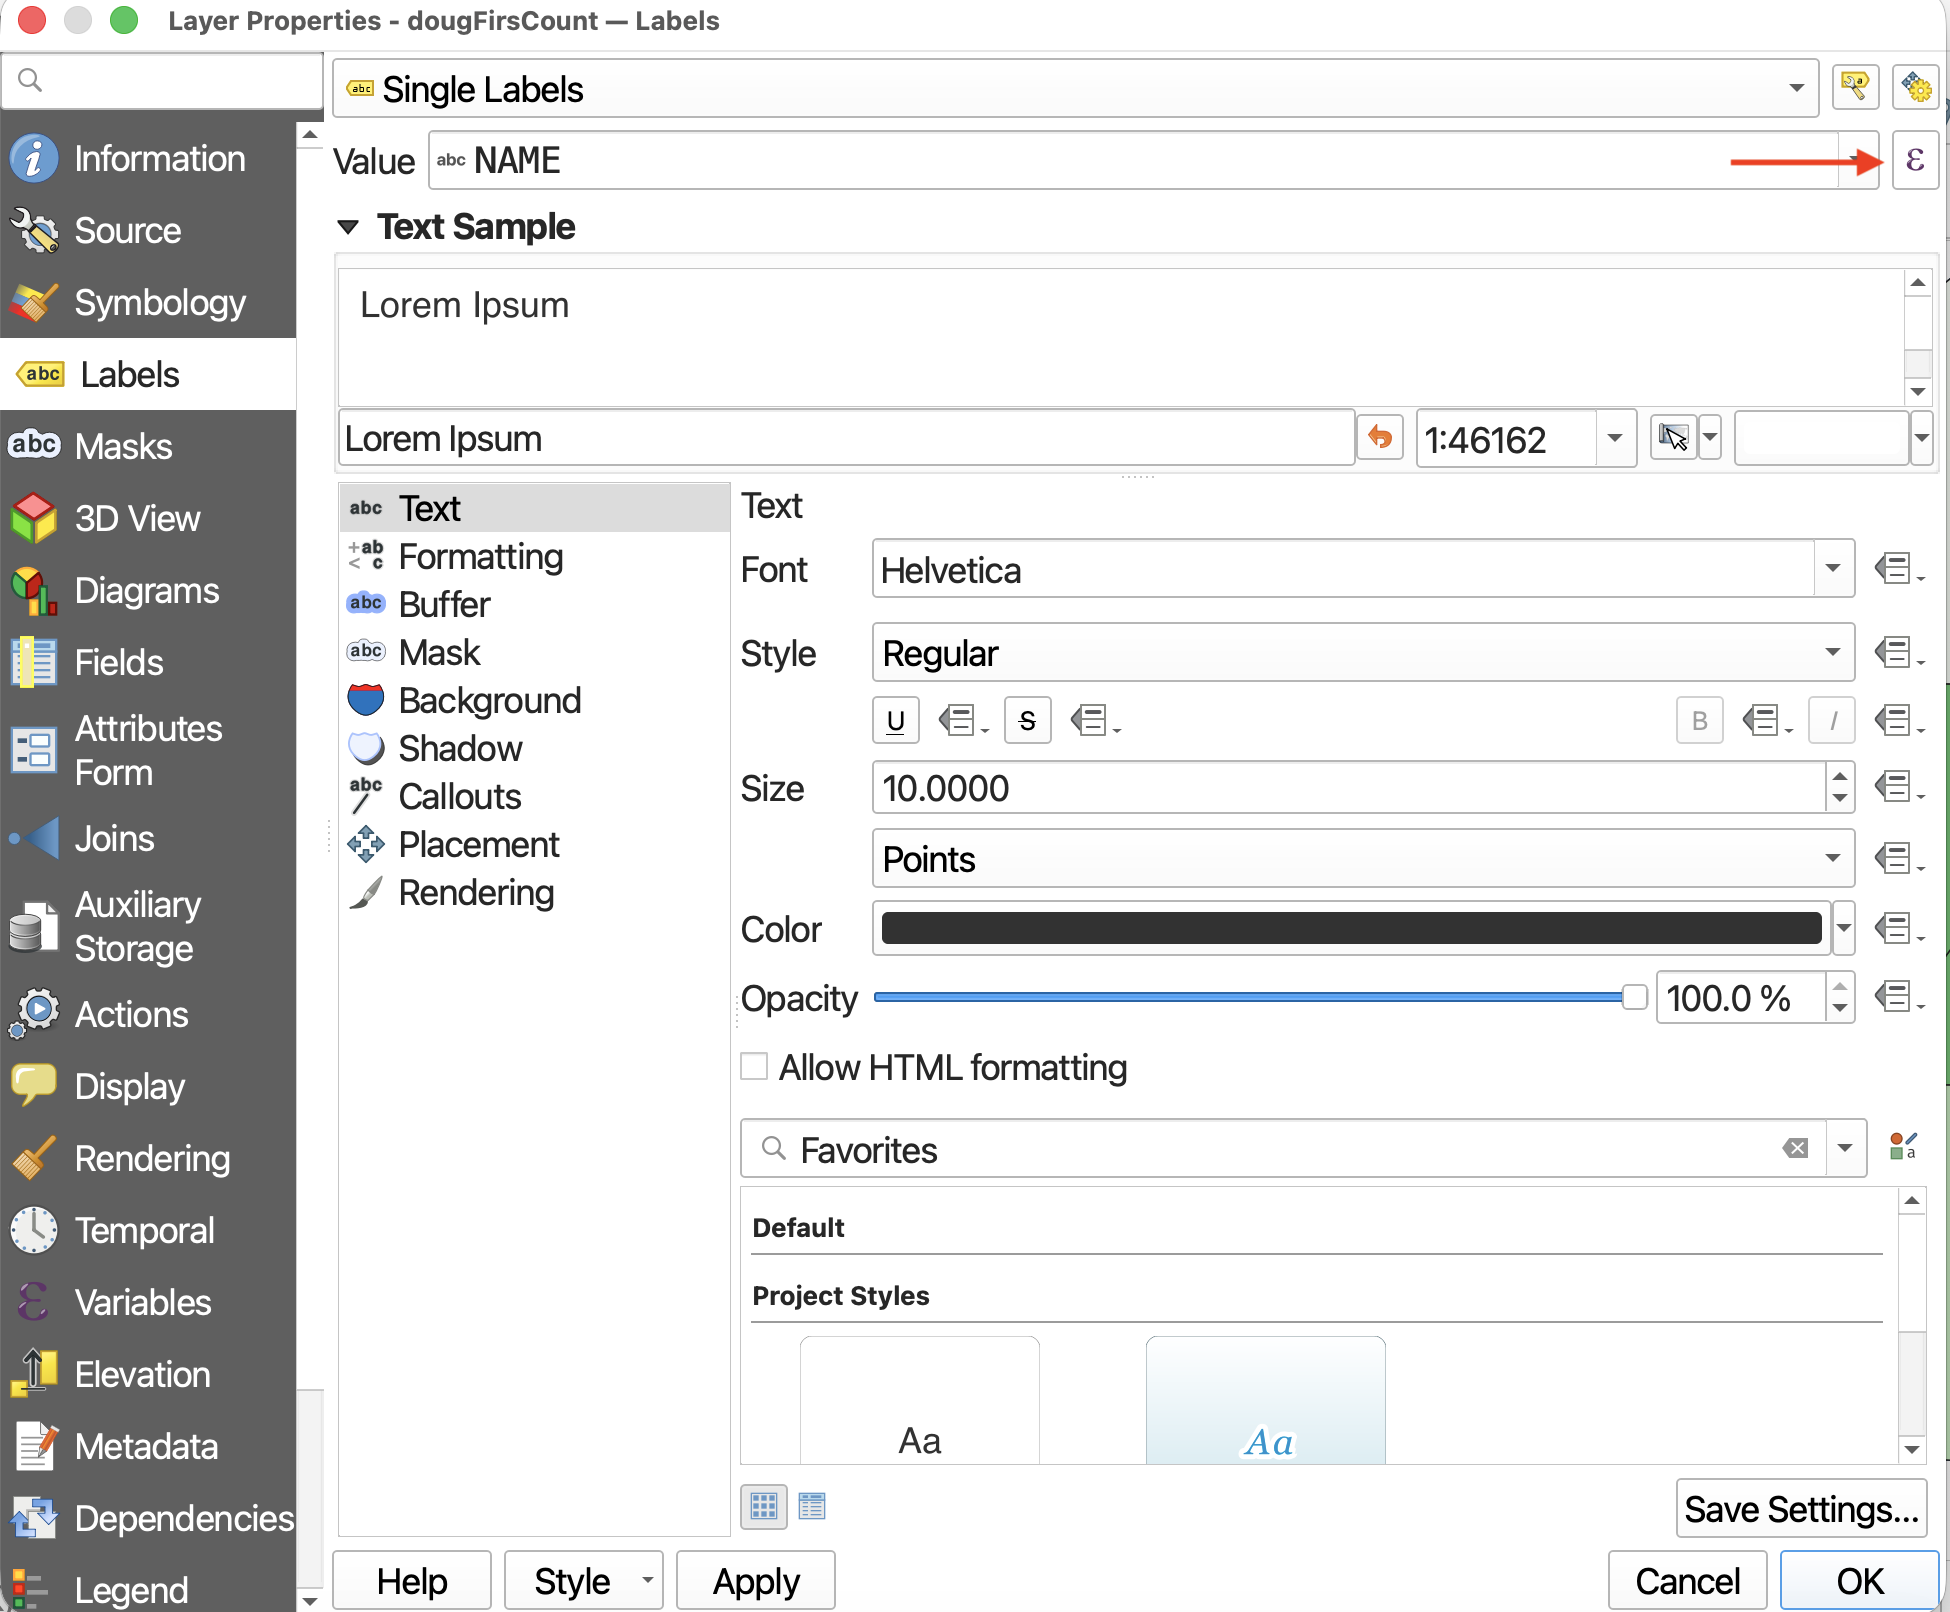
1 Open the Layer Properties for vanHoodsCount and navigate to Labels. Currently, no labels are set.
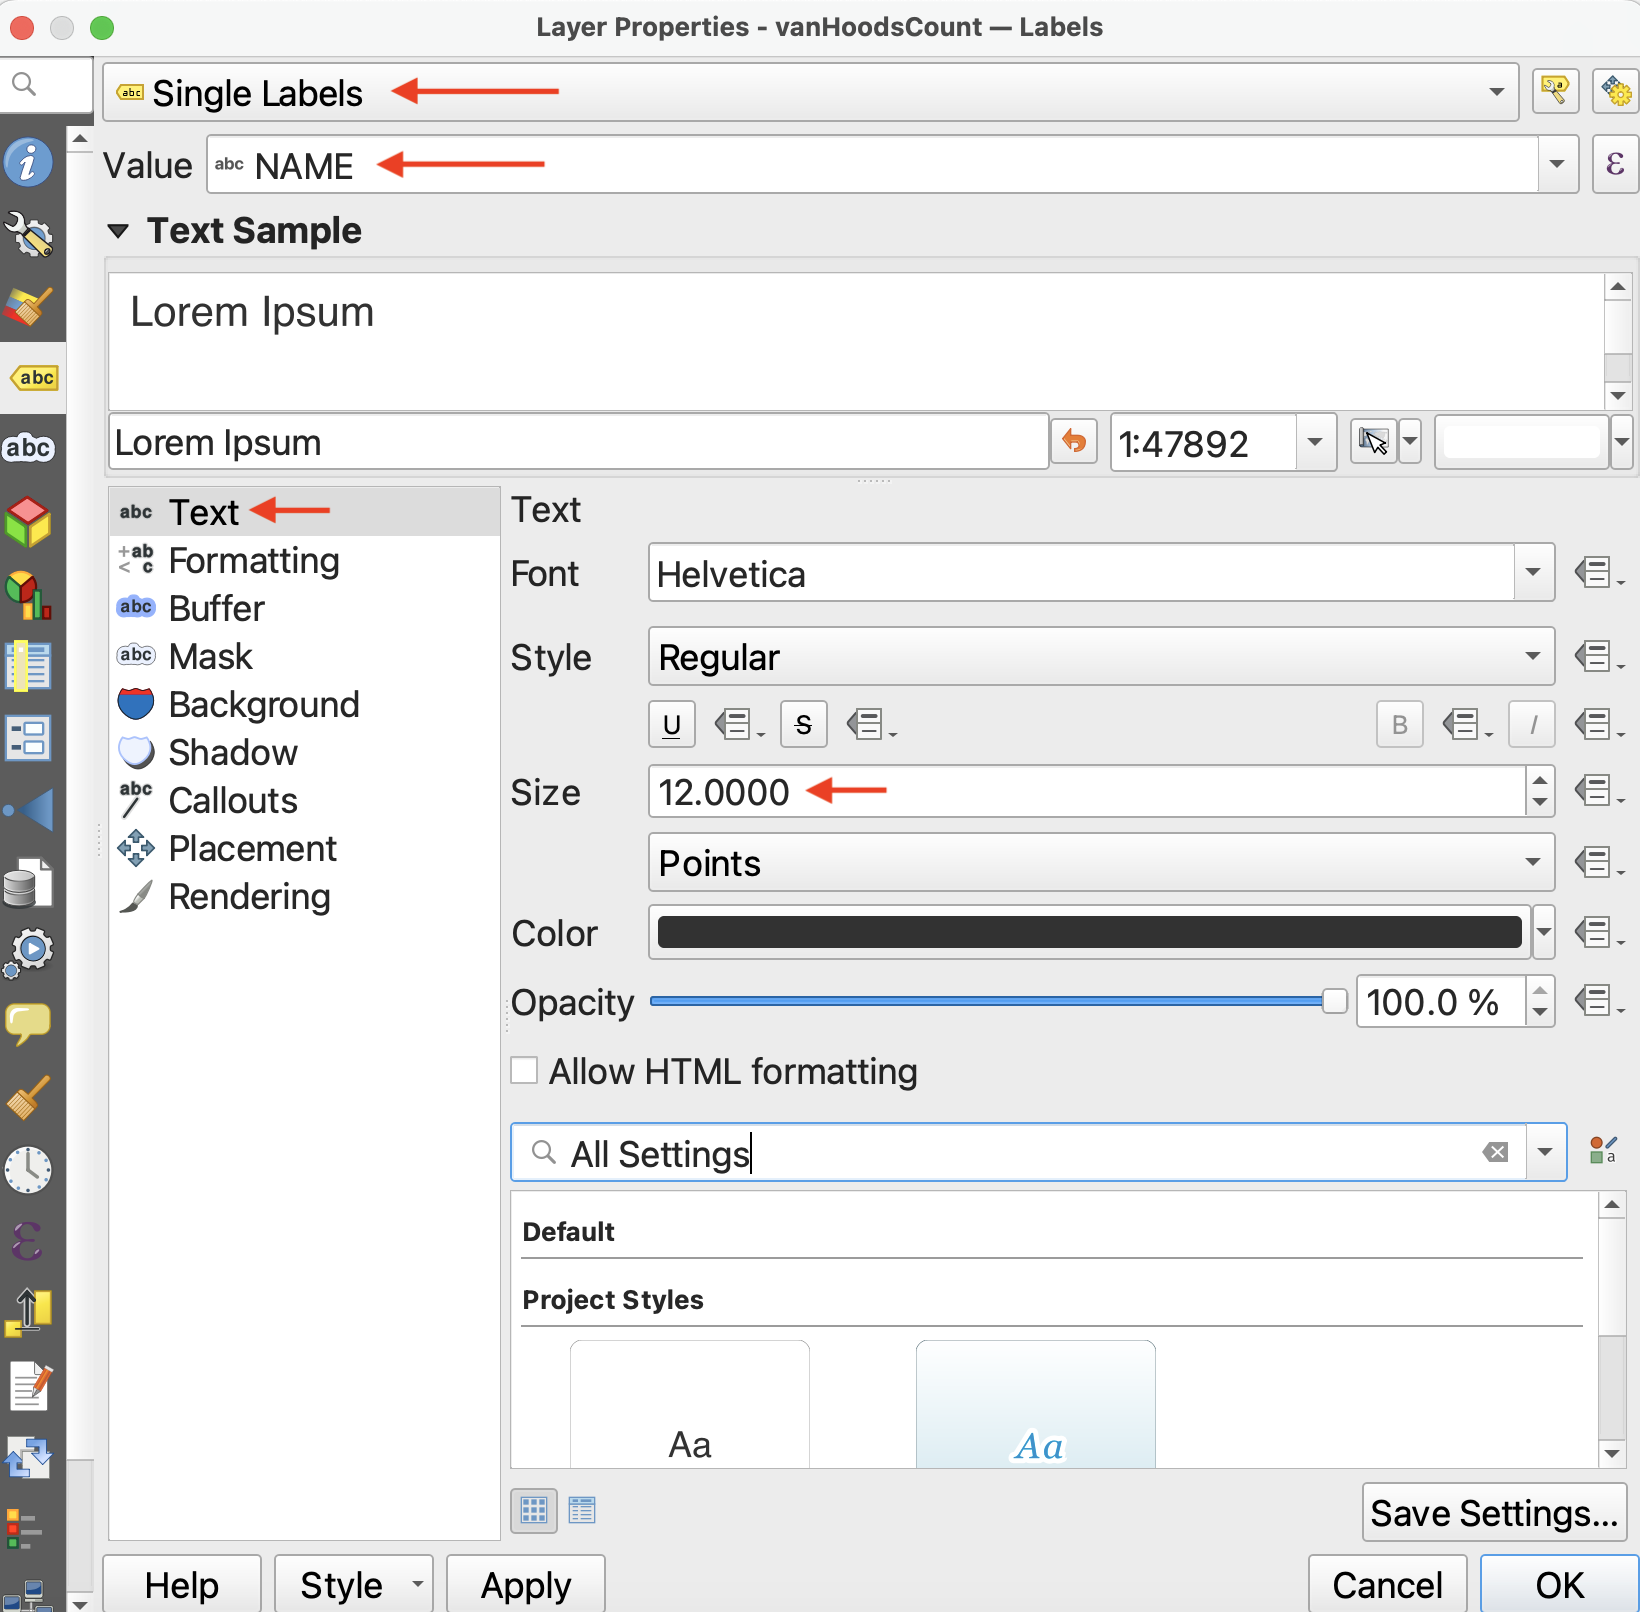
Set labelling to Single Labels and set the Value to NAME. Click Apply and see what the map looks like.
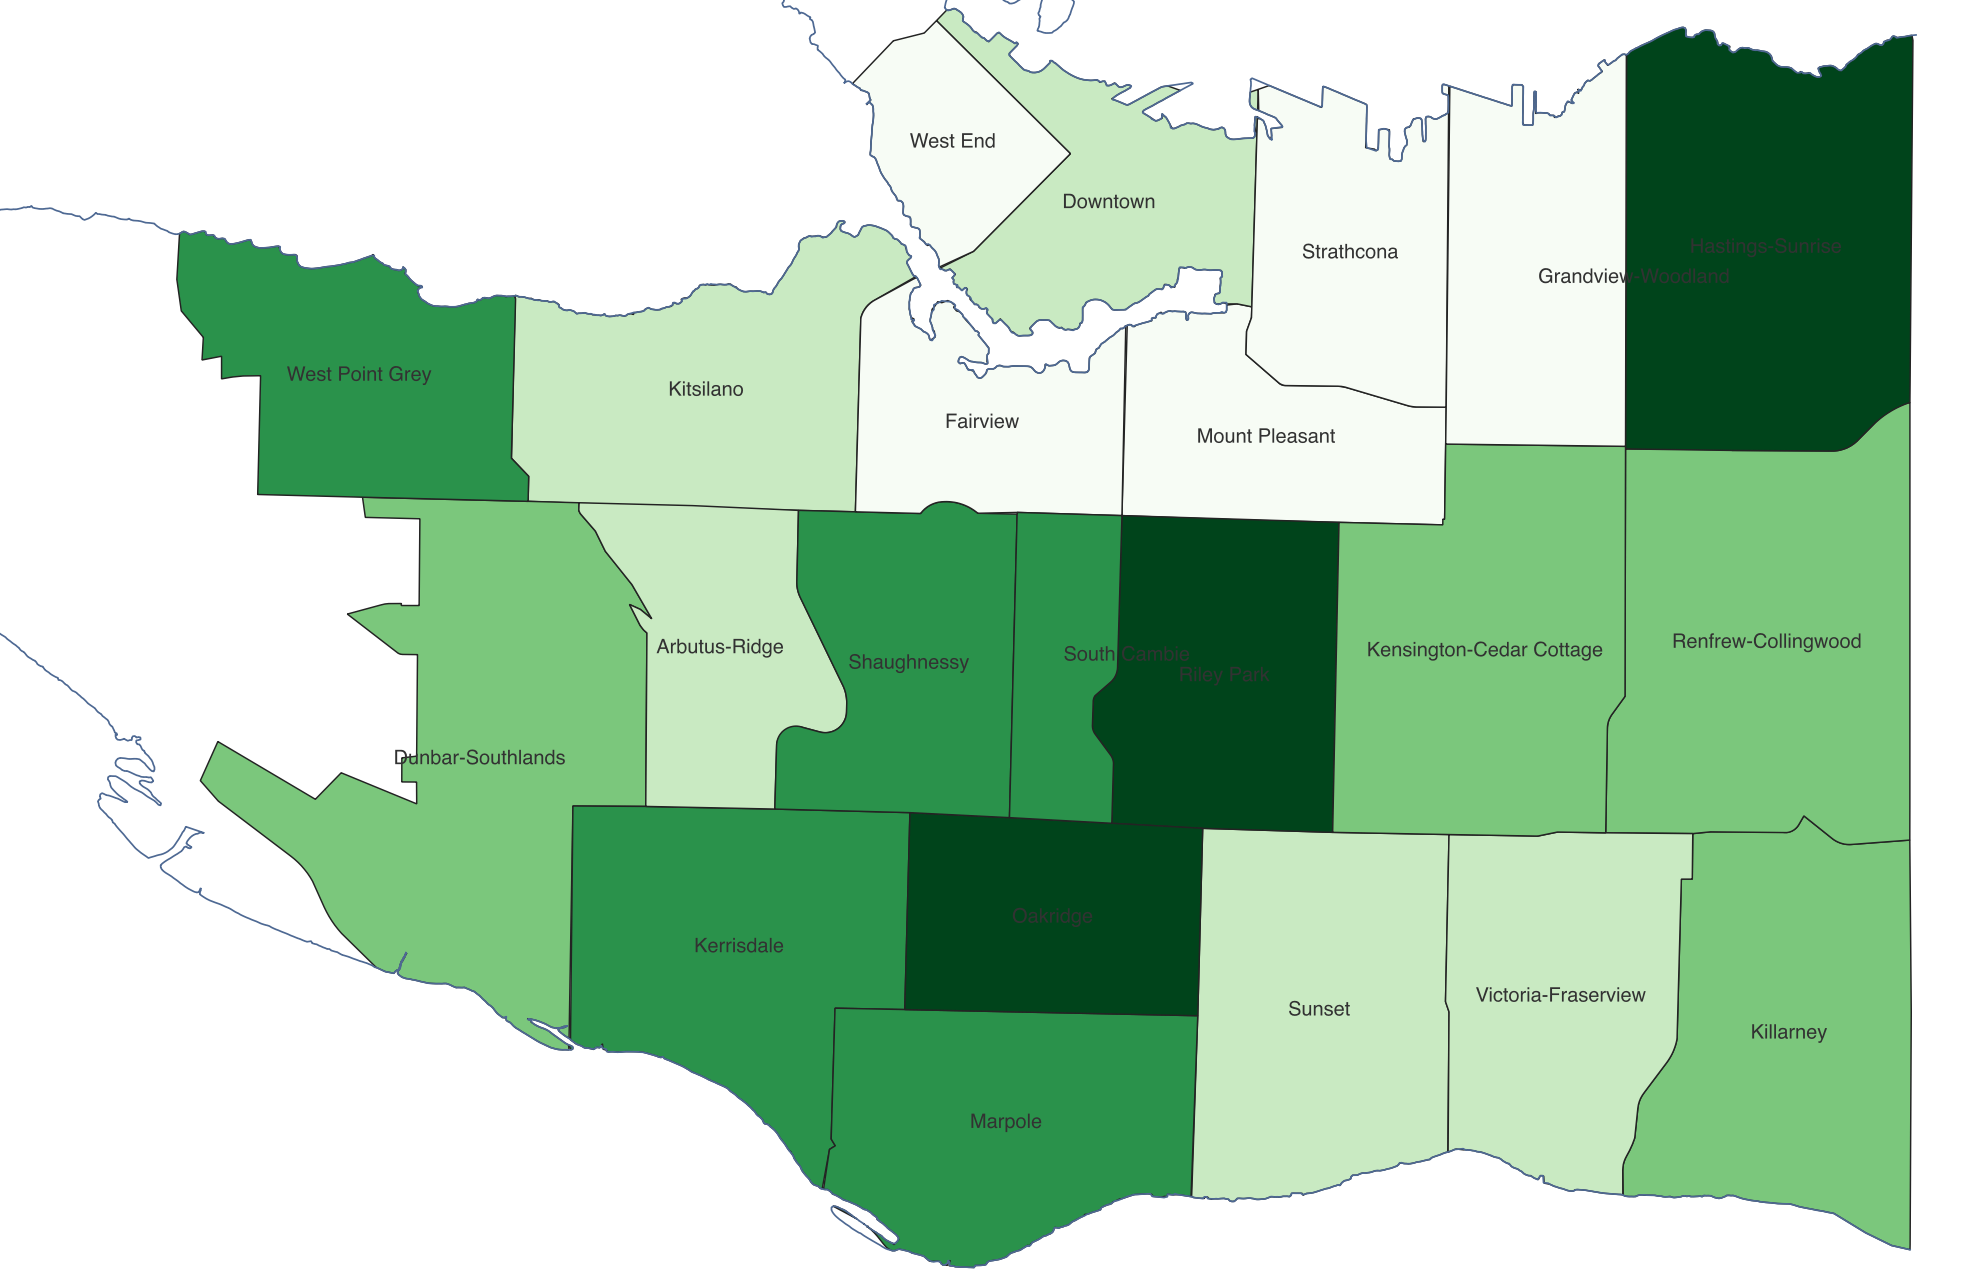
2 While labels appear for the neighbourhoods, they are a bit difficult to see. There are a couple things we can do to make the labels more visible.
- 2.1 Back in the Layers Properties, increase the font size to at least 12 Points.
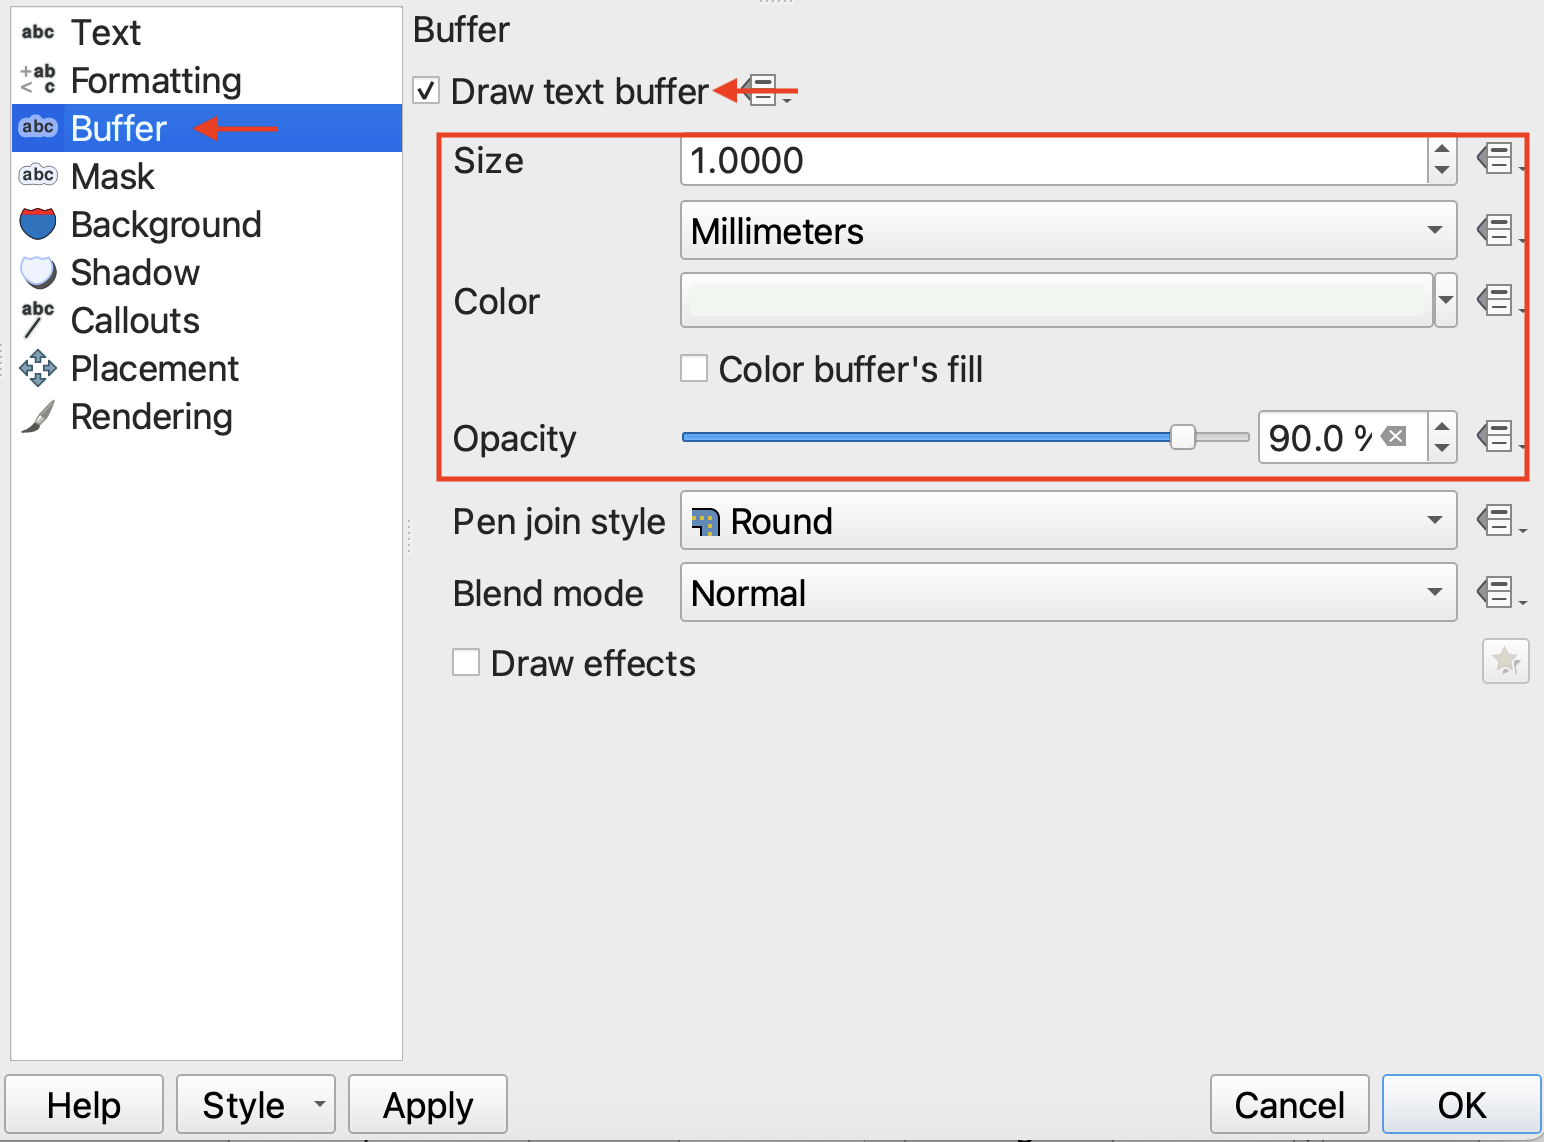
- 2.2 Add a Buffer around the text, something light colored like white but then drop the opacity a bit.
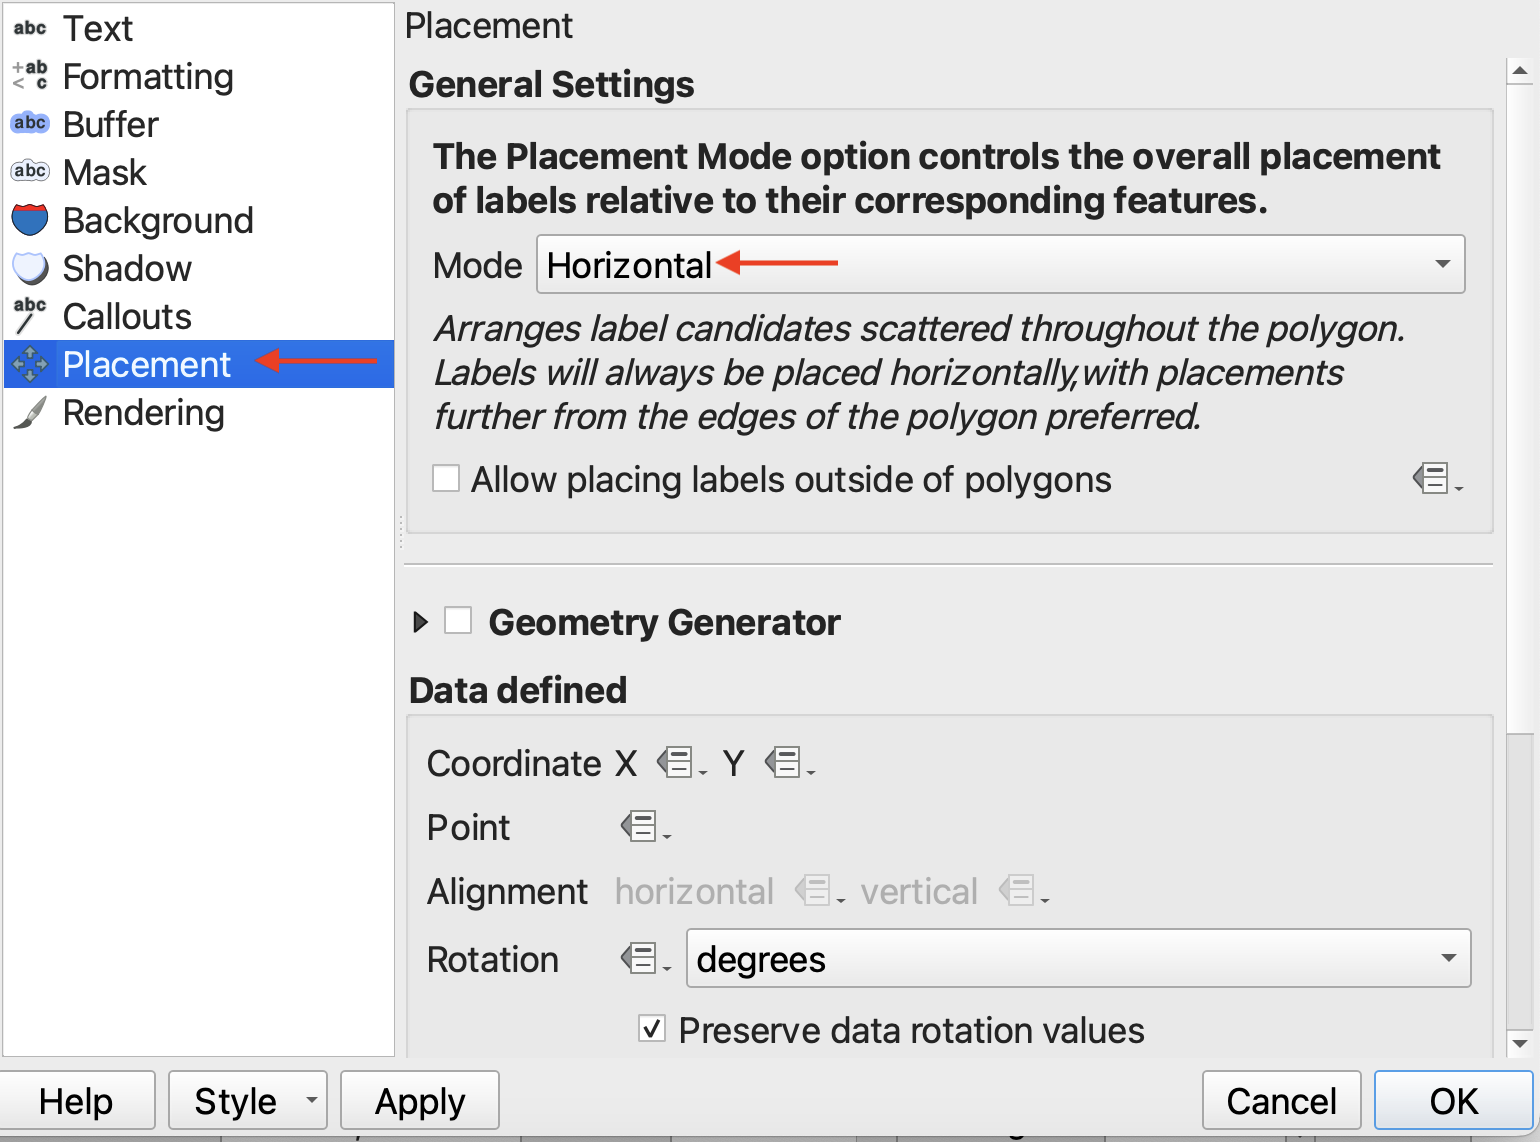
- 2.3 Then, go down to Placement and change the placement to horizontal.
Adding multiple labels
To label a layer based on multiple fields (such as Neighbourhood Name and Douglas Fir Count), you’ll need to write an expression.
If not already open, open Labels from your Layer Properties. Make sure Single Labels is still selected. Although we’ll build an expression, every feature, or neighbourhood, in the layer will be labelled in the same manner.
Currently, Name is the only field labelling the layer.
- Click on the Expression icon beside the Value parameter.
This will open the Expression Builder. Here again you can see that currently, Name is the only field labelling the layer.
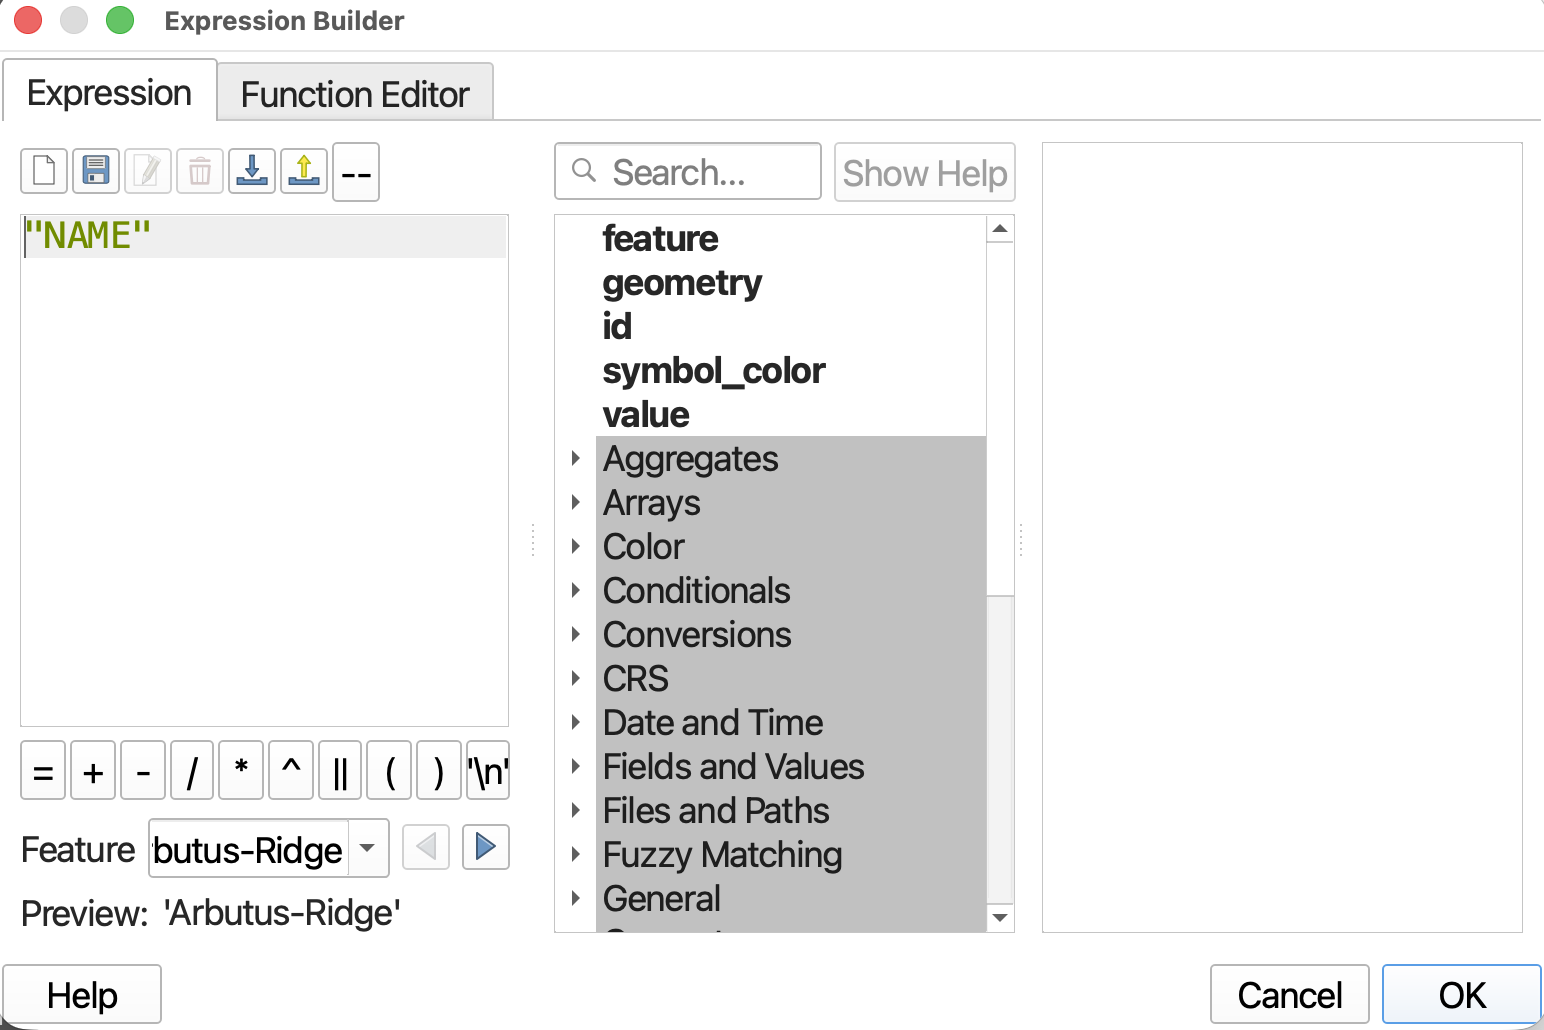
Just like when we built an expression to select only Douglas Firs, we can build an expression here for a more complex label.
The expression to add multiple fields to a label is as follows: "Field1" || ', ' || "Field2" etc. Or, if you want the labels separated by a linebreak, "Field1" || '\n' || "Field2".
Everything can be added using the options and operators in the Expression Builder. Just like when you built an expression to select attributes, you can use the Fields and Values option in the center column to add Fields to your expression.
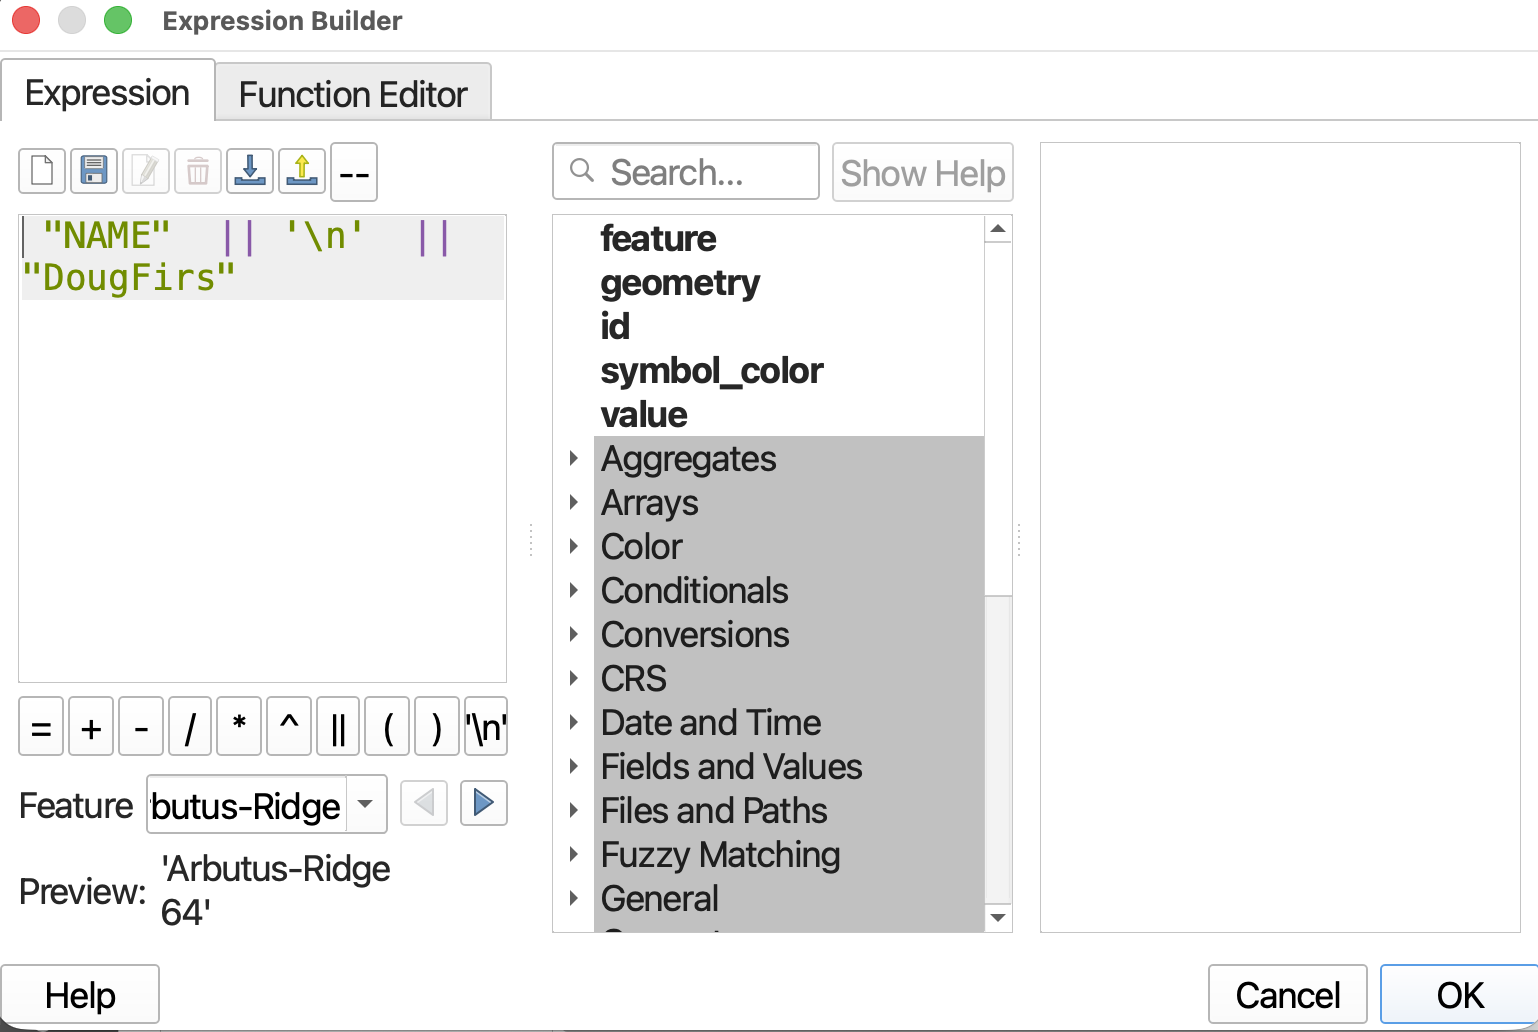
- Build the following expression:
"NAME" || '\n' || "DougFirs"then click OK and OK again. Refer back to your Map Canvas to see the new labels. Save your Project!
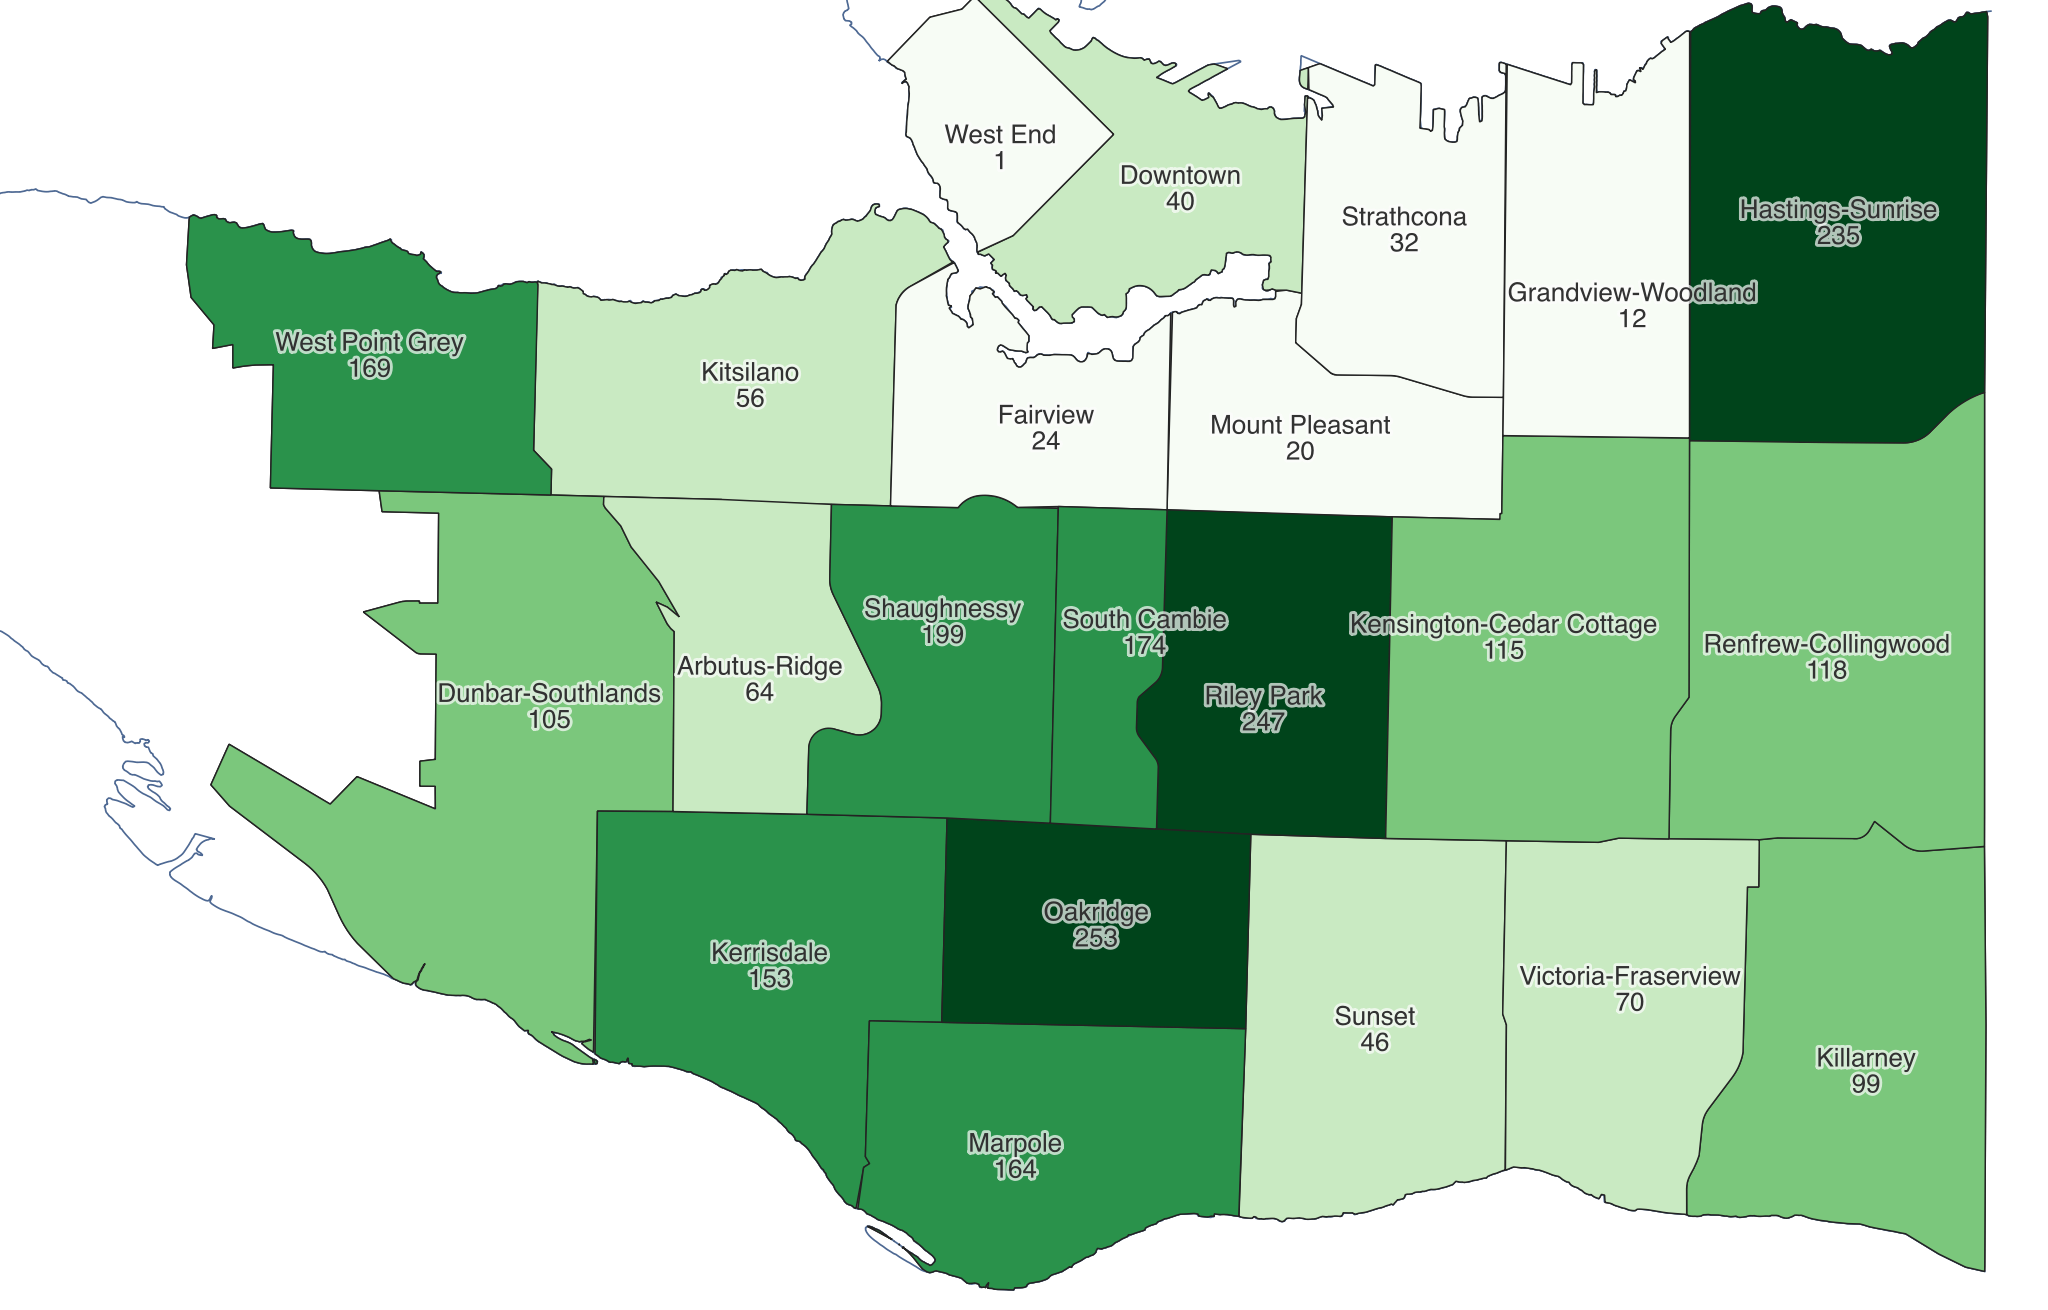
Label Proportional Symbols
Now, let’s add the total number of Douglas Firs in each neighbourhood to our proportional symbol map.
1 Turn the proportional symbol layer back on. You’ll notice the neighbourhood labels obscure some of the symbols. You can Toggle on and off a layer’s labels (without deleting your label settings) by right-clicking the layer, and selecting Show Labels. If labels are on, they will turn off, and vice versa.
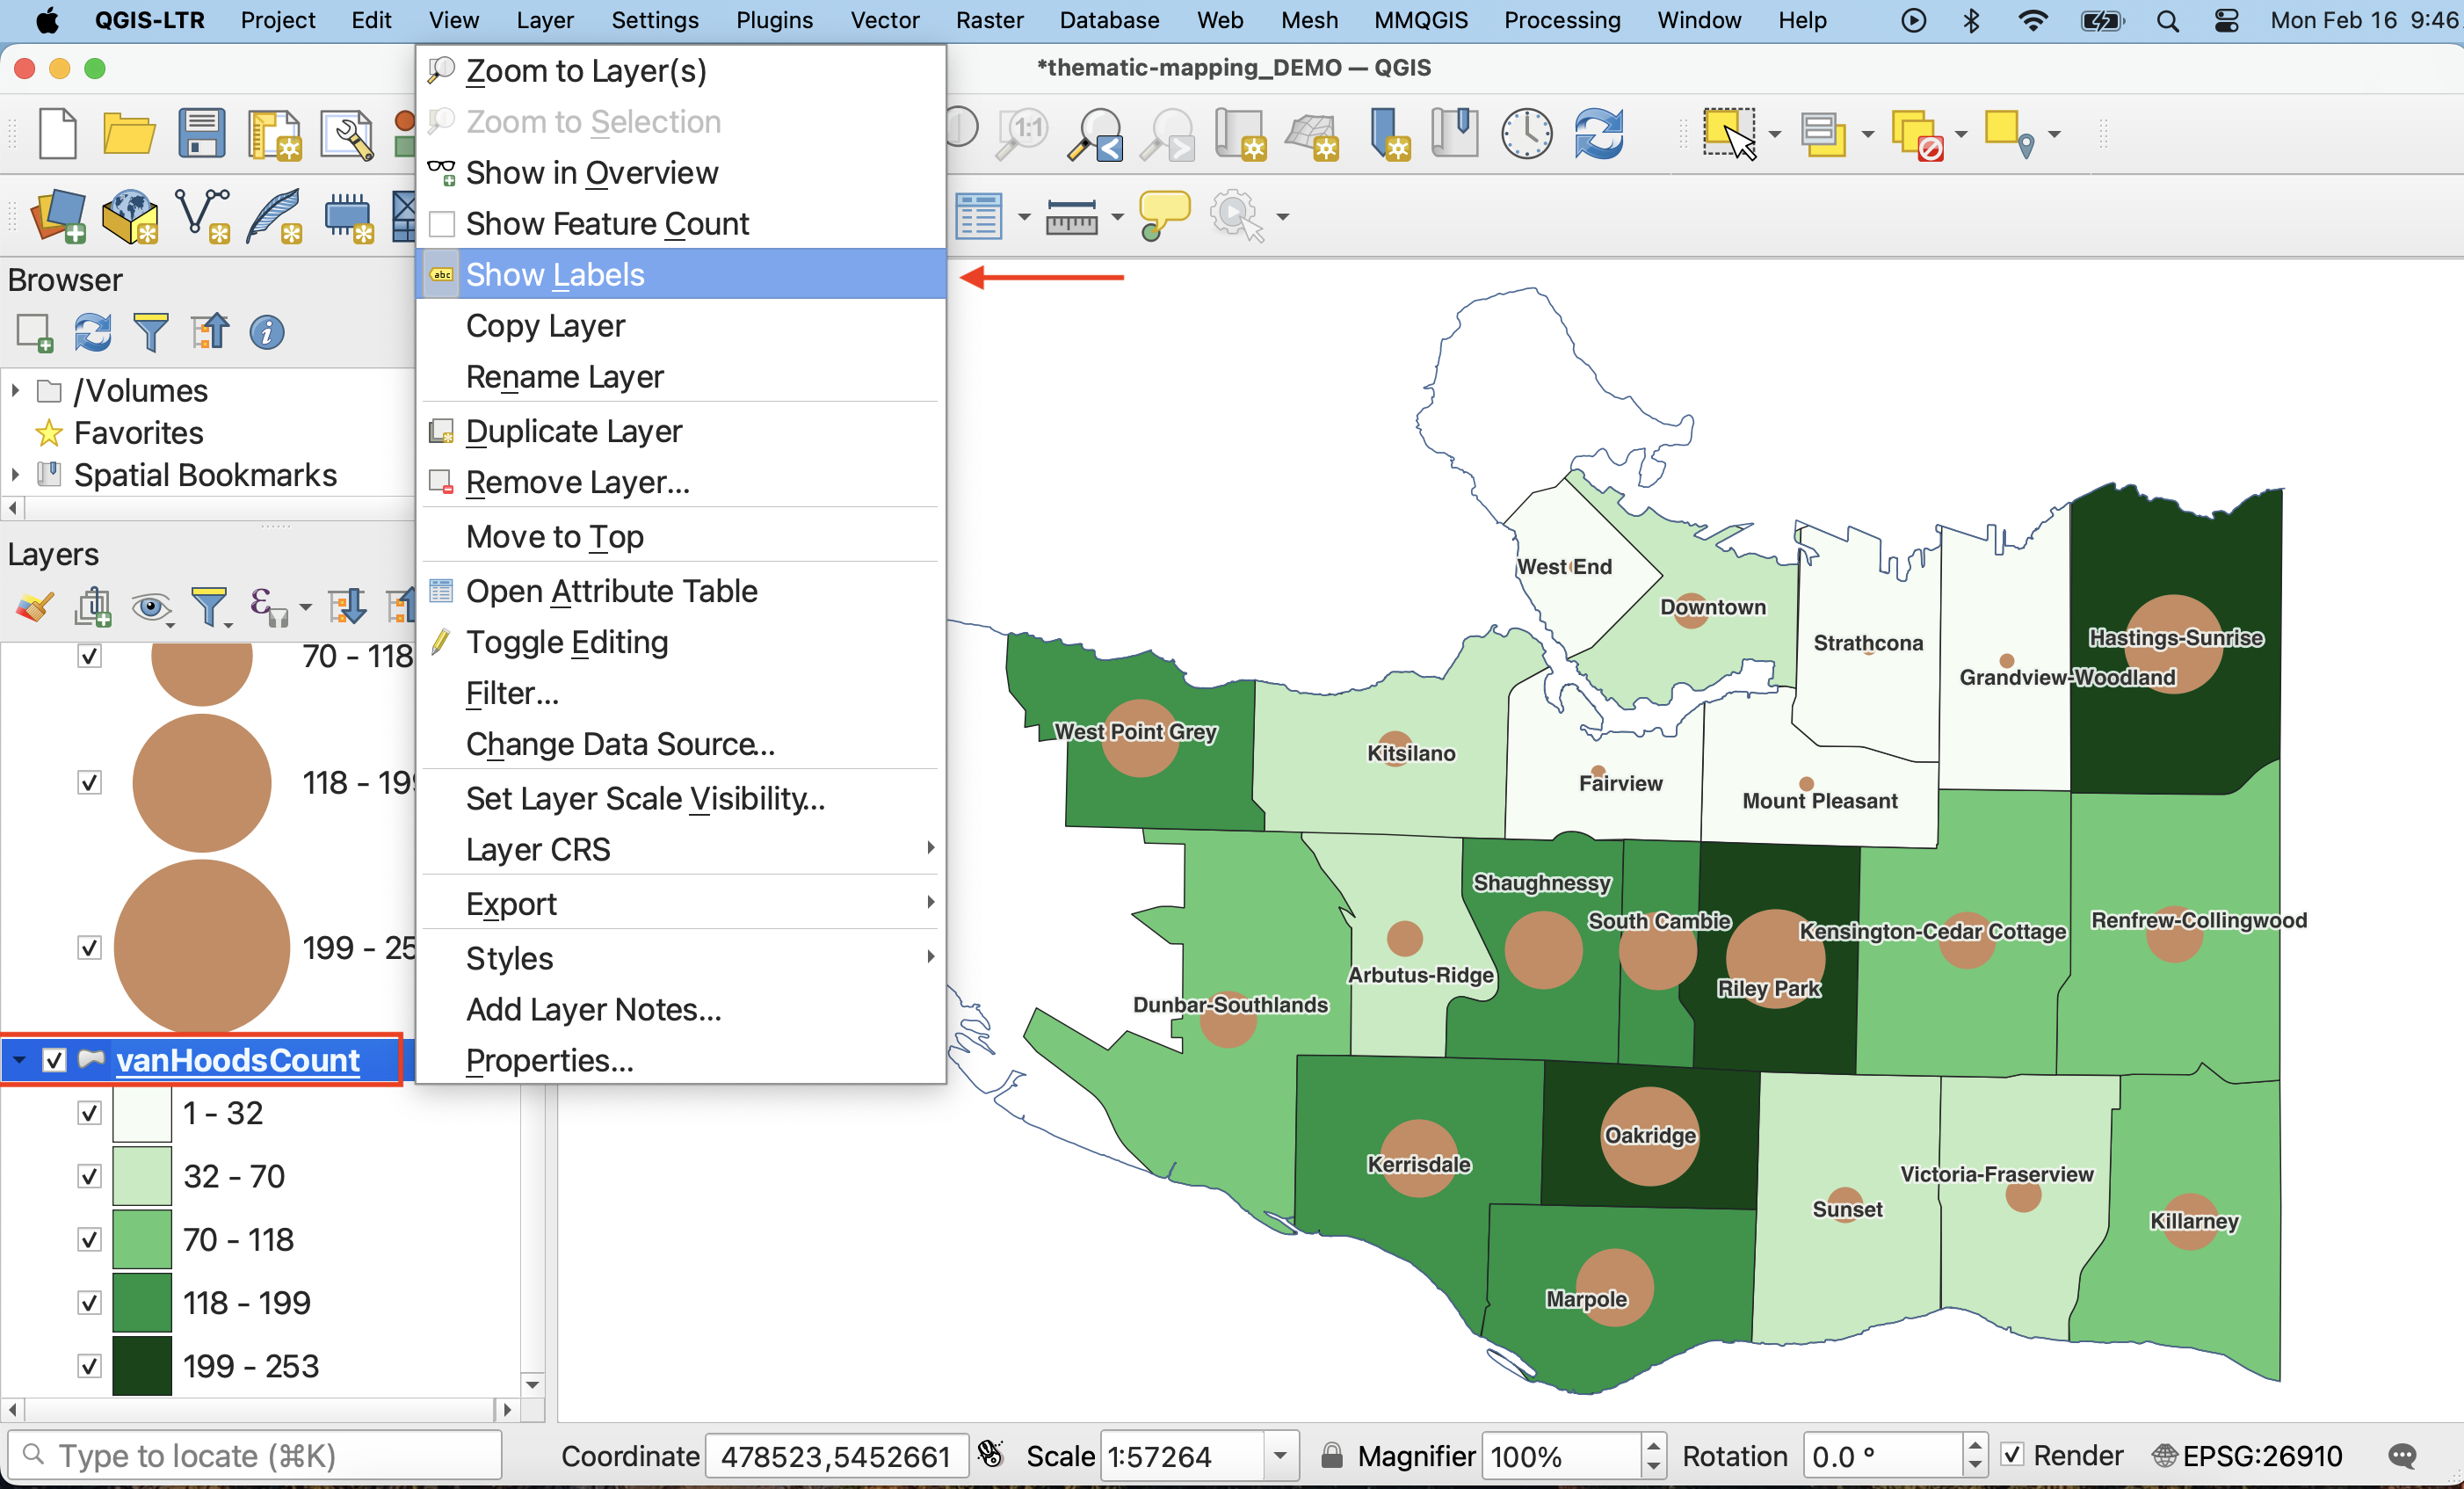
2 Now, just like above, open the Layer Properties for vanHoodsCount-centroids and navigate to Labels. Currently, no labels are set.
3 Set labelling to Single Labels and set the Value to DougFirs (or Count). Click Apply and see what the map looks like.
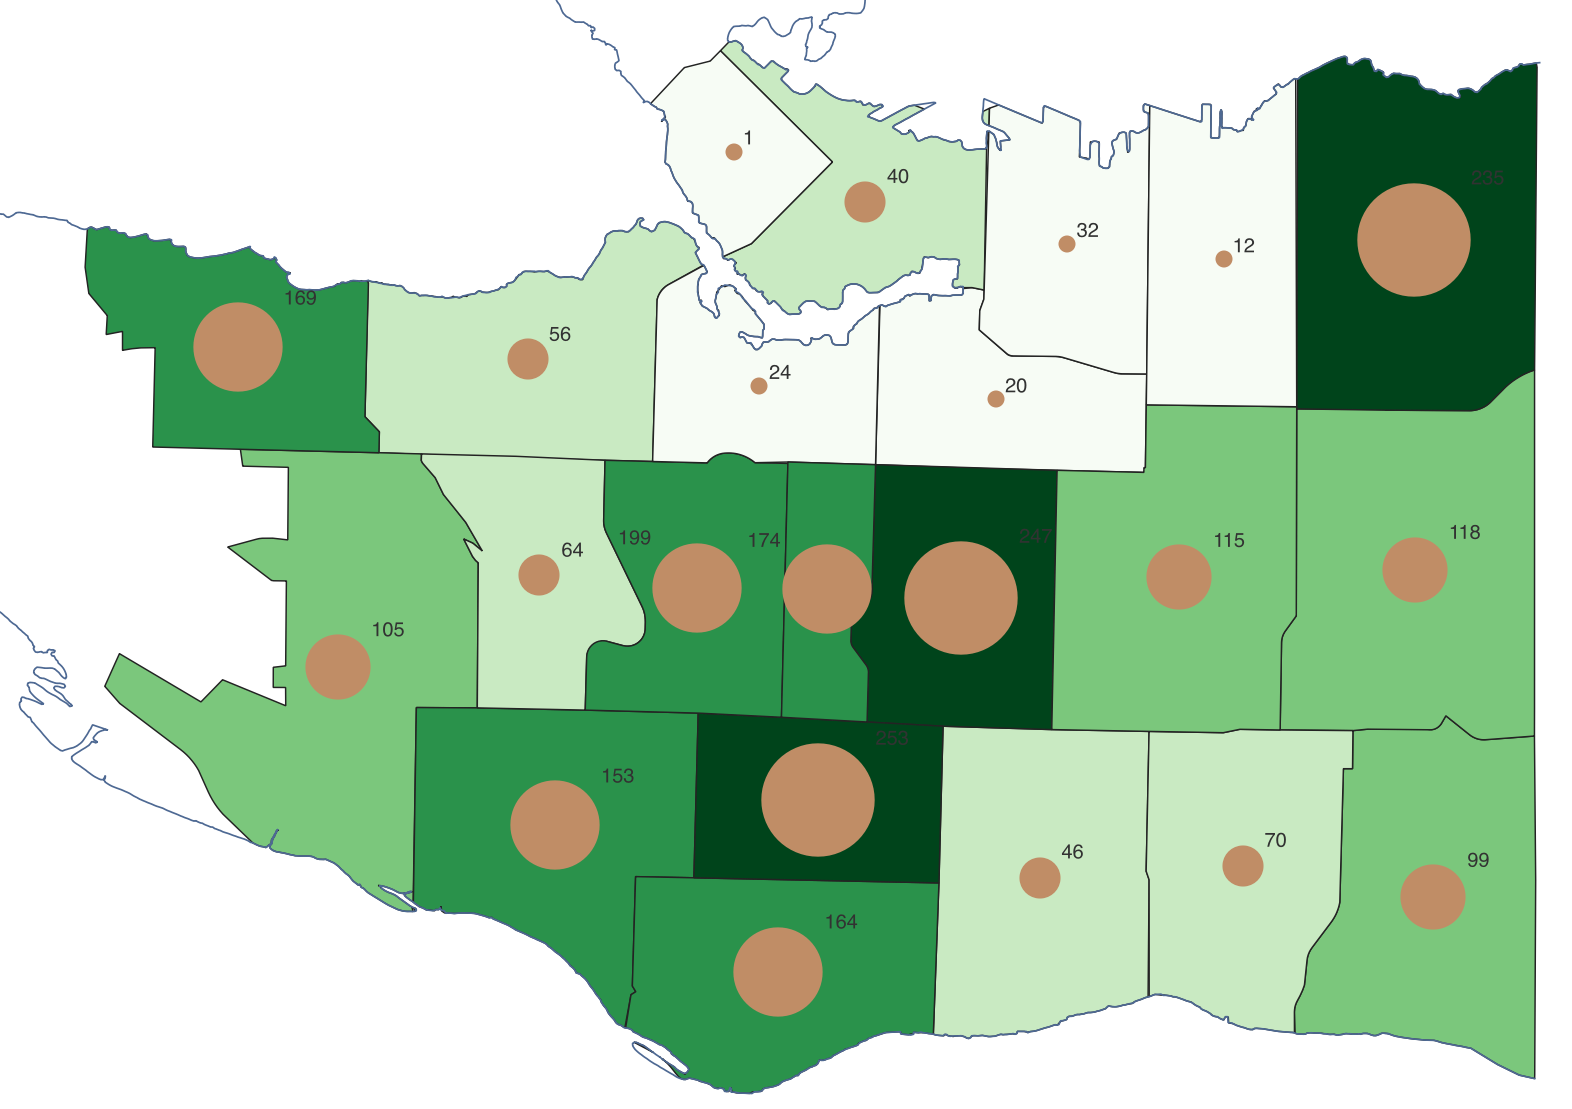
4 Just like before, adjust the font size and color, and change the Placement mode, this time to “Offset from Point”. This will allow you to visualize the number above the symbol.
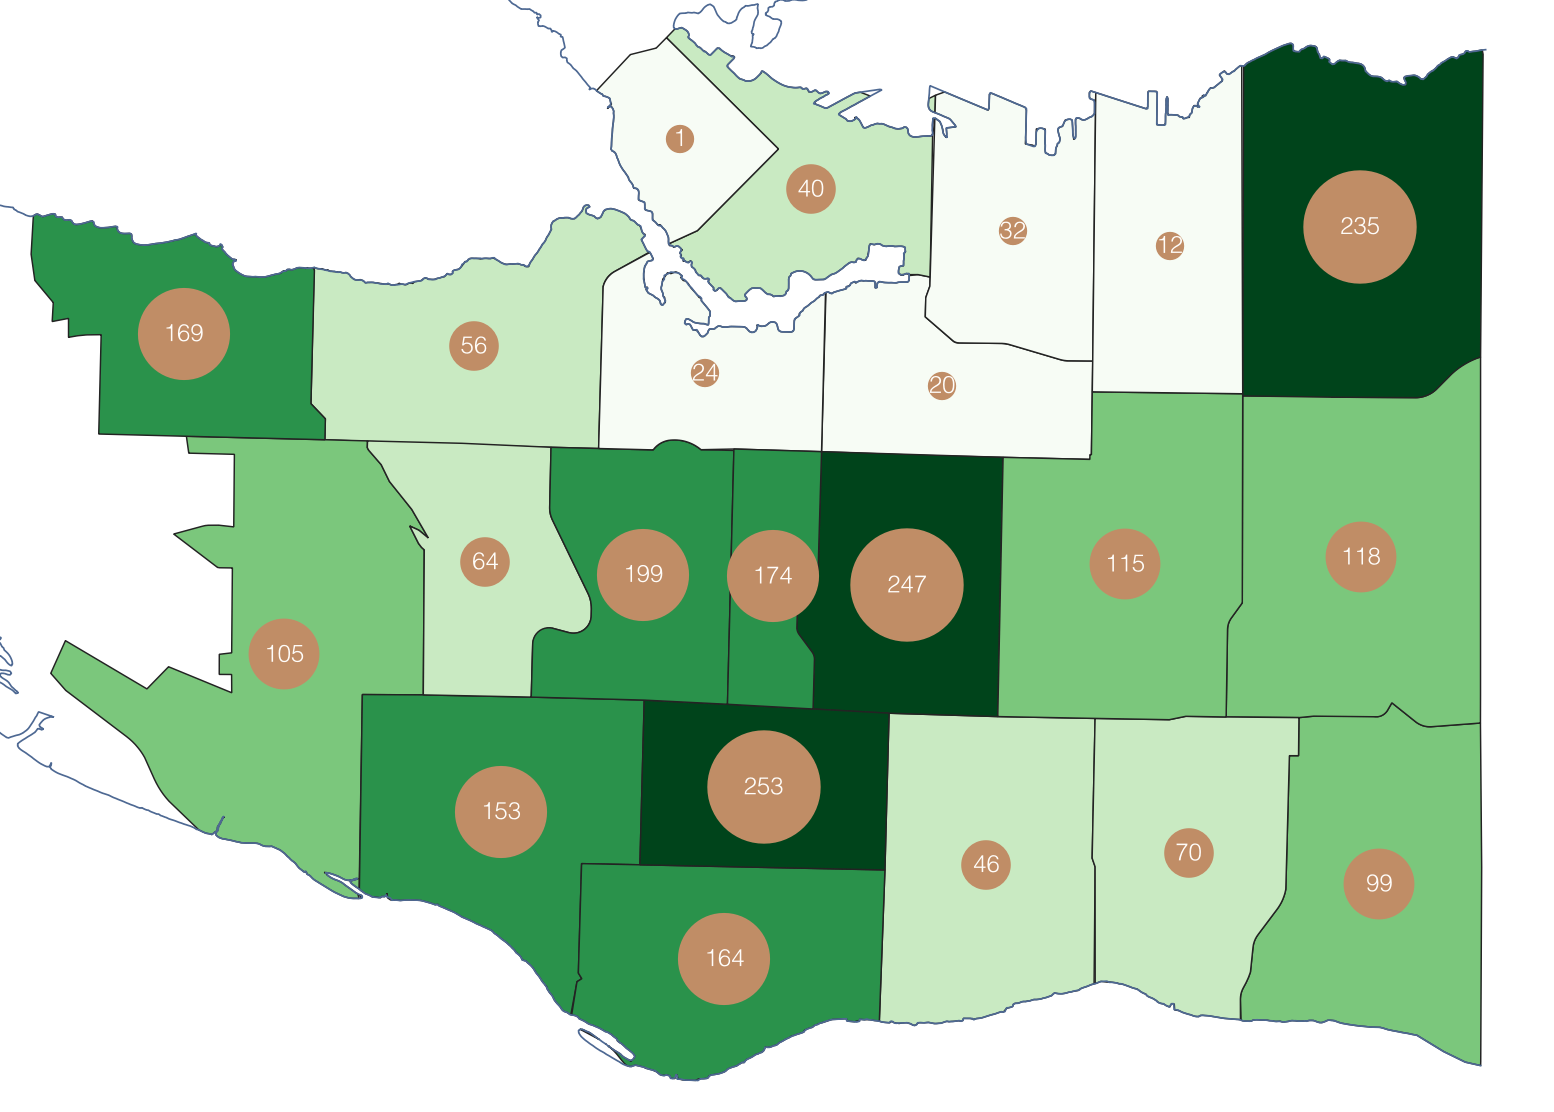
Label Visibility
You may notice that the labels are lost over the smaller points, which means you might want to increase the size of the smallest points in your symbology.
If you just want to have proportionals symbols against the neighbourhoods, consider adding vanHoods back to your map as a baselayer.
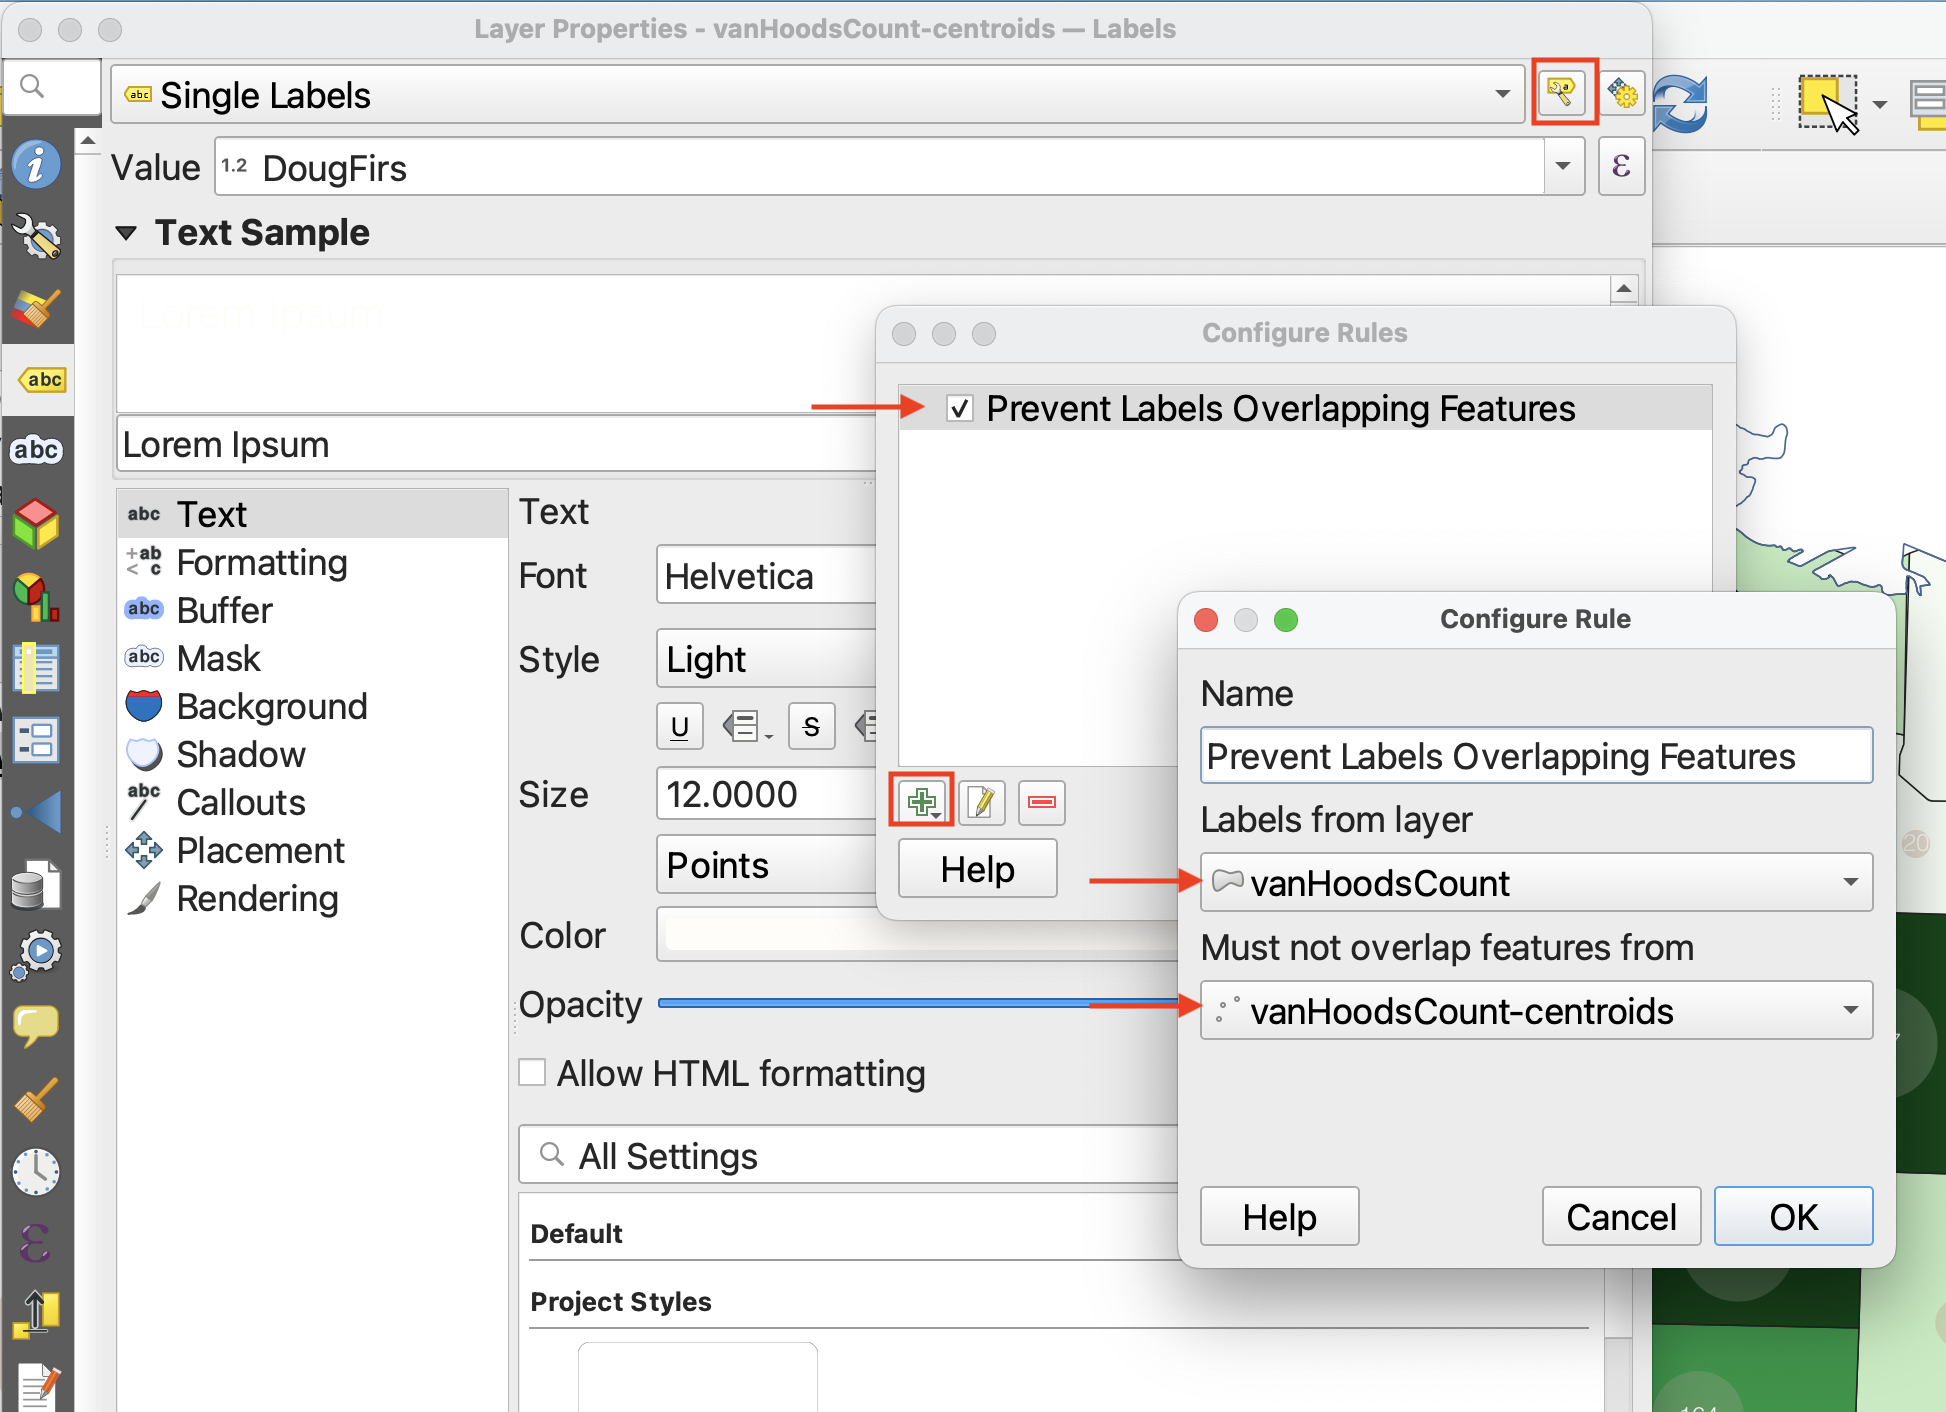
If you want your map to have both layers, you might need to adjust the Placement of one or both labels. Alternatively, you can tell QGIS not to overlap layer labels by “configuring project labeling rules”.
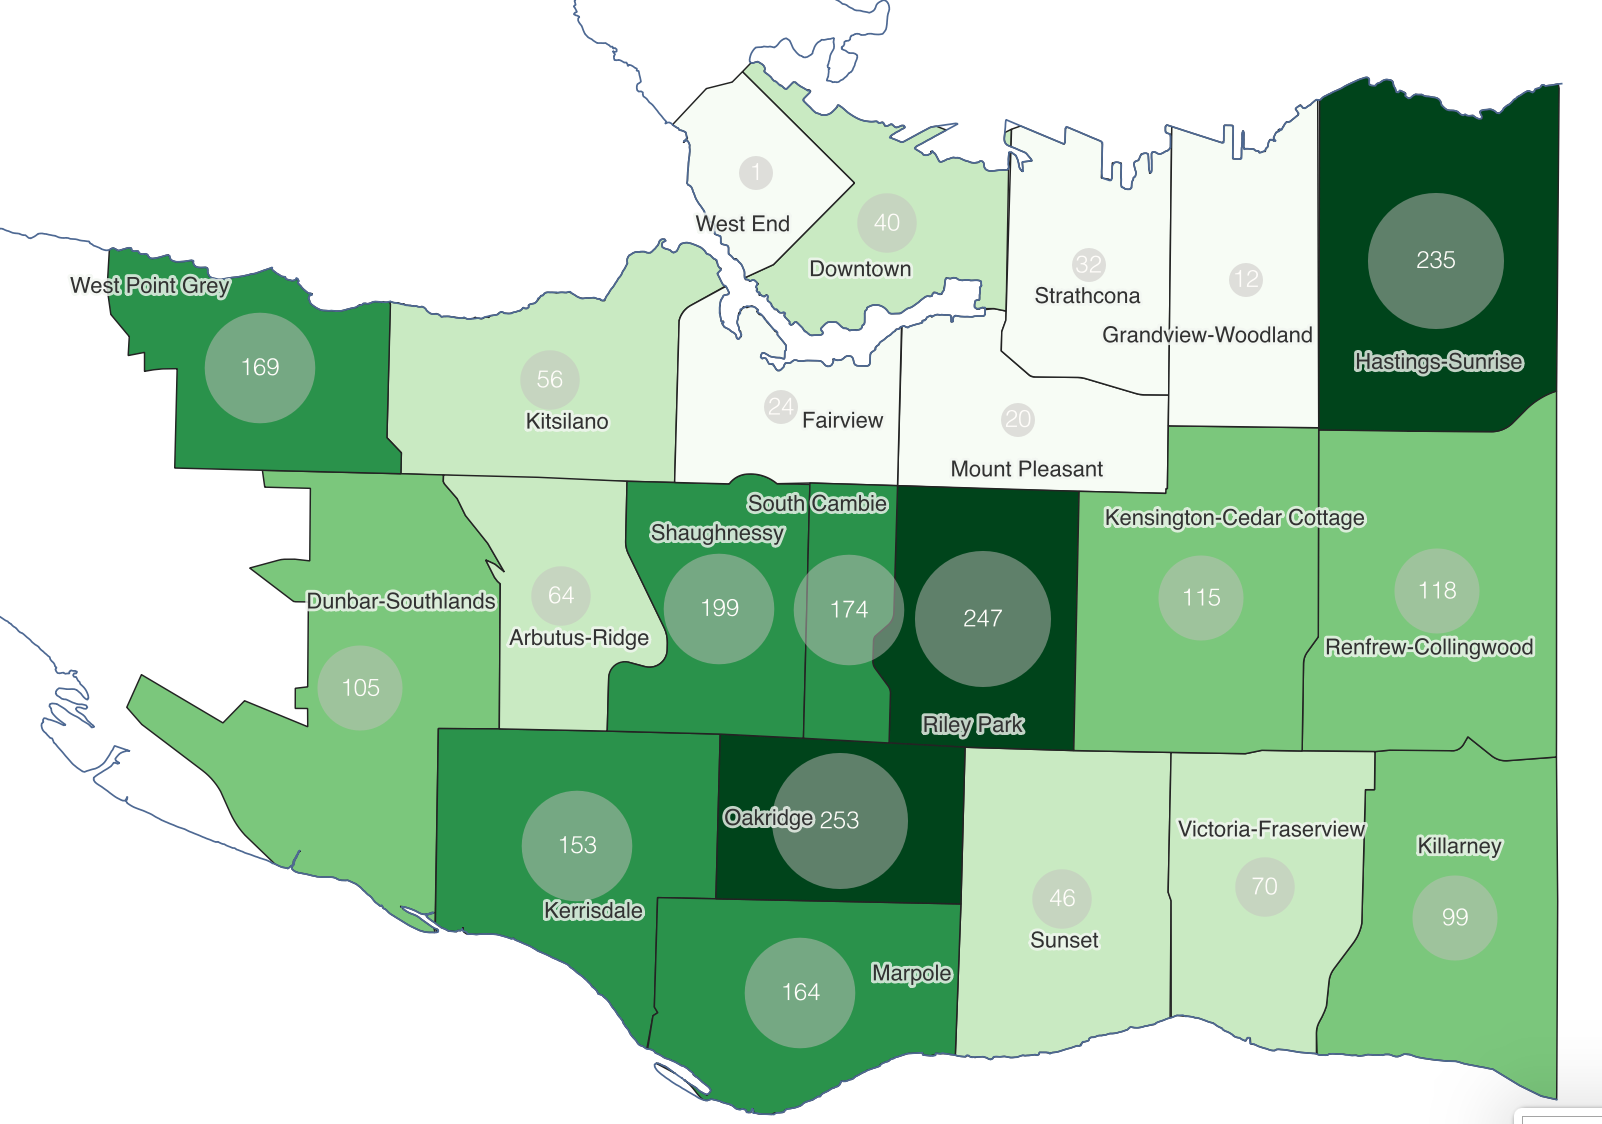
Once you are finished symbolizing your maps and adding labels, remove any unnecessary layers from your QGIS project.
Loading last updated date...