Learning About Shiny App Structure
The goal of this section is to orient ourselves within the structure of RShiny apps.
How to Open the Shiny Web App Script
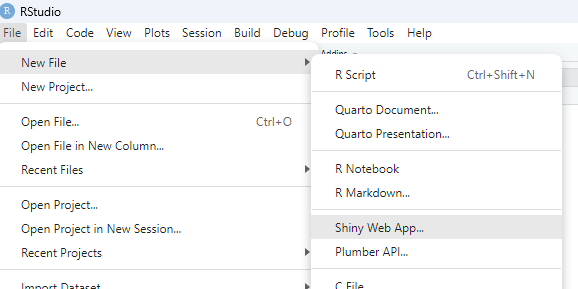
In RStudio, click File > New File > Shiny Web App
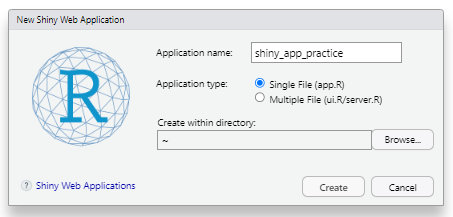
Once you’ve selected to create a new Shiny app, this window will pop up, prompting you to name the app. Choose a descriptive name if possible, then click Create.
How to Run an RShiny app
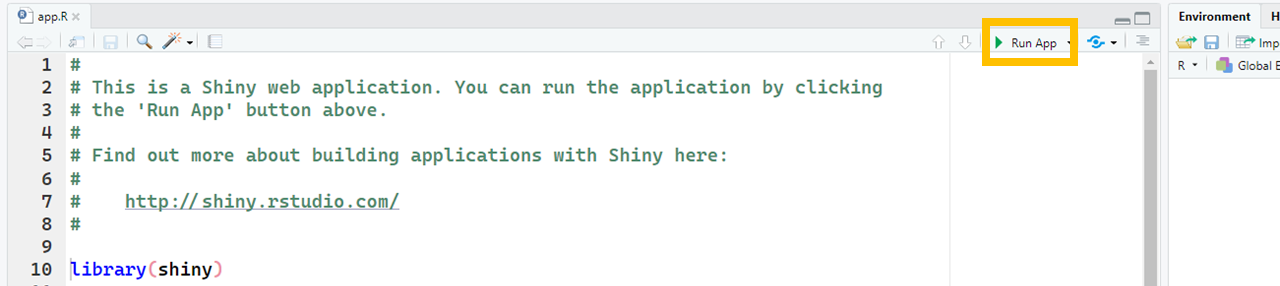
After creating the new app, the script on the left will be pre-loaded. This is a chance for you to look at the structure of a Shiny app and play around with one. To run the pre-loaded app, click the Run App button.
Time to explore the RShiny Example
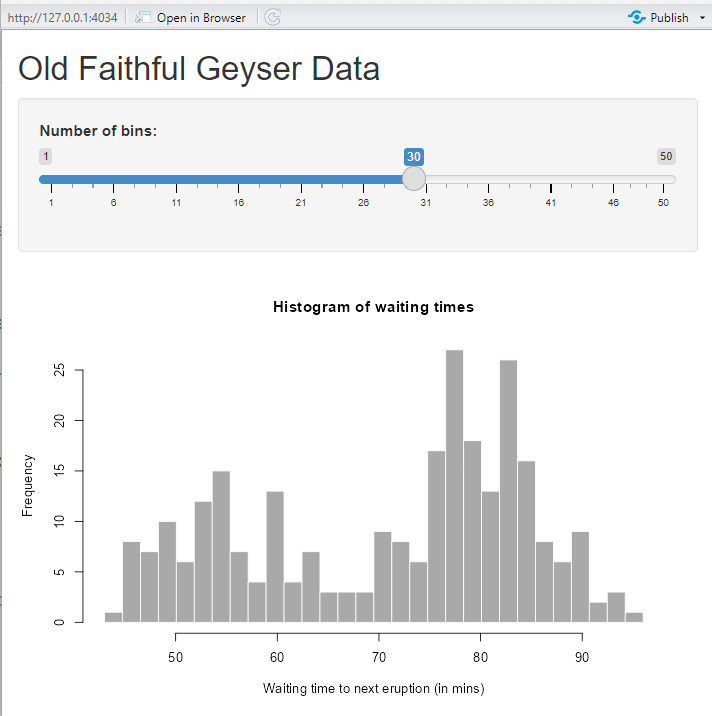
Now that you have run the app, you should see the Shiny app in a new window.
Parts of the Shiny App
Shiny apps have two parts. The ui (user interface) and the server (the computing behind the scenes).
Have a look at the pre-loaded app code. The code has distinct parts.
-
Loads the Shiny app with
library(Shiny)to tell R that we are making a Shiny app. -
Has the
uiandserversections of the app. -
At the end, the
shinyApp(ui = ui , server = server)is what allows you to run the app.
Why do the different parts matter?
Different parts of code belong in different parts of the app. The ui is the app layout piece while the server is the actual computing part that responds to use input.
Parts of the ui
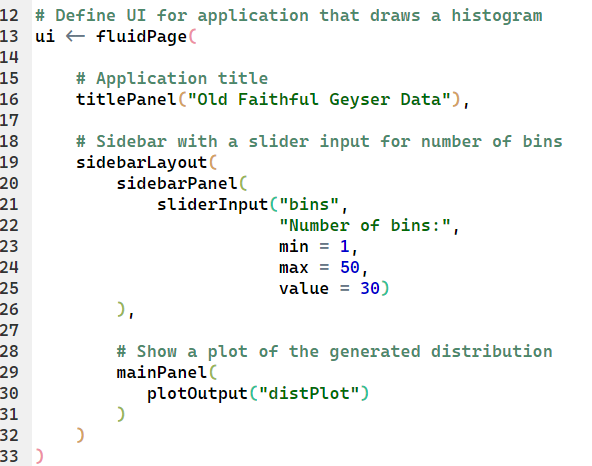
In the pre-loaded example, the ui is a fluidPage type. Within the fluidPage, we have three sections: the titlePanel, the sidebar, and the mainPanel.
If we look to the example app, we see that the titlePanel is what generates the title of the app.
The sidebar contains multiple sections:
-
The
Number of binstext is the title of the slider in the app. -
The
min,max, andvaluearguments are the default values that get pre-loaded into the app when it is run. -
The remaining argument,
binsis what allows the app to be interactive. Findbinsin the server section of the app!
The mainPanel contains a single section, plotOutput. This tells the Shiny app to plot the output of the distPlot (the histogram in the app), which is generated in the server.
Parts of the server
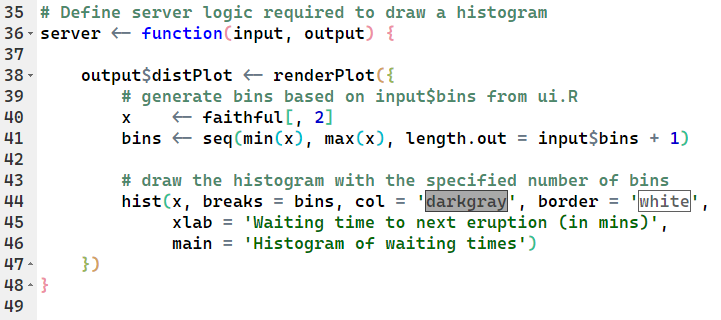
The first thing to notice in the server is that it is built as a function
server <- function(input, output) { }
-
The input is the user input of sliding the slider to select a number of bins.
- You can figure this out by looking at the
bins <- seq(min(x), max(x), length.out = input$bins + 1)line in the server. This line sets the number ofbinsfor thedistPlot.
- You can figure this out by looking at the
-
The output is the plot,
distPlot.Both of these elements (binsanddistPlot) are in theui. This is how the functionserverconnects to theui.
Concept check in
Do you remeber the difference between the ui and the server? Put your answer in the chat.