Let’s wrangle and plot some data
magrittr
You will notice the %>% or |> (both are same) symbol throughout the workshop. This is called a pipe operator and it is part of the magrittr package. It is used through the tidyverse to string many operations together.
UBC Library has another workshop, where we go over the pipe operator more in detail.
R has built in keyboard shortcuts (CMD+Shift+M for MAC; CTRL+Shift+M for PC) to get the pipe operator instead of actually typing out % > % every time.
tidyr
tidyr is a package that allows easy data manipulation. To see the full options and a tidyr cheat sheet, go to their website.
Today, we will talk about pivoting data, which is an important first step before analyzing and plotting data sets.
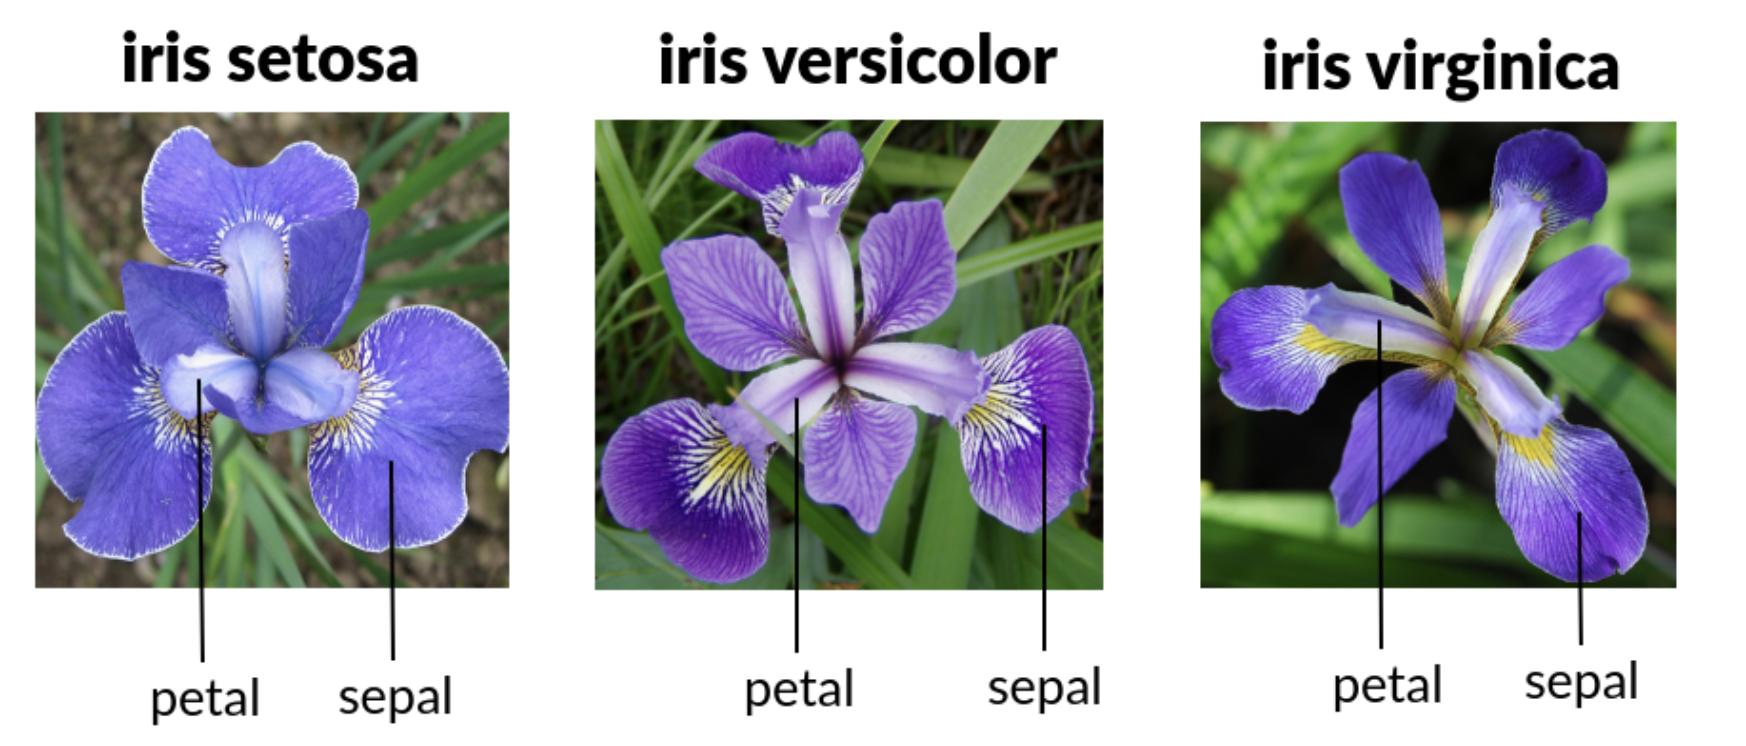
We will work with the iris data
# open the dataset to see what it looks like right now
View(iris)
The iris data is currently in a “wide” format. Let’s change it into a “long” format.
# change to long format
iris.longer = iris |> pivot_longer(cols=c(1:4),
                                    names_to = "metric_name",
                                    values_to = "metric_value")

# open again to see what happened
View(iris.longer)
# See how we went from 5 columns to 3?
dplyr
dplyr is a package that helps with summarizing data. For the full list of what that means go to their website.
Let’s say we want to find some means and sample numbers in the iris.longer dataset
iris.summarised = iris.longer |>
  group_by(Species, metric_name) |>
  summarise(
    sample.size = length(metric_value),
    metric.mean = mean(metric_value)
    )
We are going to keep using dplyr and use a cheat to add the summarized data back into the longer iris dataset.
iris.full = full_join(iris.longer, iris.summarised)
How did this join work? Do you know of other joins?
UBC Library has a workshop about joins.
ggplot2
ggplot2 is a plotting package that is highly customizable. For the full resources go to their website.
You can also refer to the library workshop about ggplot2.
The customization is built on a standardized syntax:
ggplot(data, aes(x = xvariable, y = yvariable)) +
  geom_plottype() +
  other_customizations
ggplot2 example
## basic box plot
ggplot(iris, aes(x=Species, y=Petal.Length))+
         geom_boxplot()

## basic box plot + customization
  ## can customize insides aes() or in additional elements strung on to the base plot code with a +
    ## sometimes you need to do both. set the color variable in aes() but the list of colors to use is in a new section
ggplot(iris, aes(x=Species, y=Petal.Length, color=Species))+
  geom_boxplot()+
  theme_bw()+
  labs(x="Species", y="Length", color="Species")+
  scale_color_manual(values=c("#08ff0a","blue", "#d600ff"))
stringr
stringr is a package that let’s you easily manipulate character data. For the full resources go to their website.
Data formatting (stringr)
Let’s say we want to change the names of the iris species in our dataset to include the full common name of the iris.
iris$Species=str_replace(iris$Species, # to the Species column in the iris dataframe
            "virginica", # find the pattern "virginica"
            "Virginia blueflag") # replace the pattern "virginica" with "Virginia blueflag"
Repeat this activity with the setosa iris in the iris dataset (answer below)
Answer
iris$Species=str_replace(iris$Species,
            "setosa",
            "bristle-pointed iris")
Let’s do the same thing, but with the example that comes up when you type ?str_replace in the R console.
fruits <- c("one apple", "two pears", "three bananas")
fruits2=str_replace(fruits, # in fruits
            "[aeiou]", # find any of these letters
            "-") # replace the letters in the [] above with
What differences in structure within the str_replace function do you notice between this example and the example we just ran through with the iris data? Hint, iris is a dataframe and fruits is a vector.
Data extracting (stringr)
The changes we just made to the iris dataset names are cute, but they are too long. Let’s use str_sub to extract the first 3 characters of the species name.
iris$Species.Short = str_sub(iris$Species,
                             start=1,
                             end=3)
The point of this example is to show why str_sub is different from str_replace:
str_sub counts to extract information.
str_replace looks for perfect matches and does something with those perfect matches.
In situations where you have different string of letters (like in many DNA sequences), using perfect matches to extract a subset of your data for further analysis, like merging with other DNA sequences, is not possible because it is not reasonable to type out hundreds of sequences manually and look for matches that way.
A note on lubridate: lubridate helps R users format date and time data. We won’t cover it today, but see their website for more.
Loading last updated date...