Creating graphs: part 1
Tableau is sophisticated software with many features. In this introductory workshop we will cover a small number of features as we create two graphs:
- Add labels
- Filter the data displayed
- Use calculations
- Group values
The measure named Statistical Weight is the number of people in the total population represented by each row. The sum of the Statistical Weight field for a given month represents the Canadian population covered by the survey, “the non-institutionalized population 15 year of age and over” (see the Guide to the Labour Force Survey for details).
Bar graph: unemployment rate
The data in the sample dataset is the same used to produce Statistics Canada table 14-10-0017-02, Labour force characteristics by province, monthly, unadjusted for seasonality. We can use Tableau to reproduce the figures in the Statistics Canada table and present them visually.
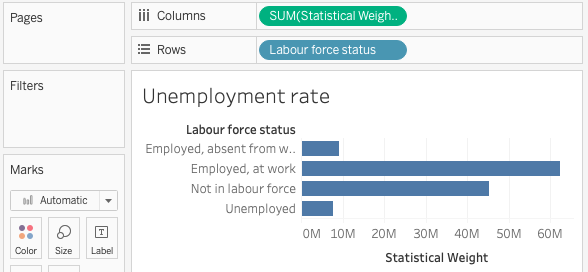
1 The foundation: adding dimensions and measures
- Go to Worksheet -> New Worksheet
- Right-click the new worksheet tab (bottom of the screen) and Rename the sheet to “Unemployment rate”
- Drag Labour Force Status to Rows
- Drag Statistical weight to Columns
Tip: An alternative to dragging dimensions/measures to the sheet is to double-click the dimension/measure name.
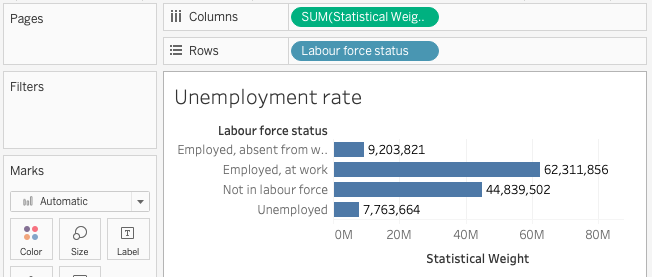
2 Adding labels
There are at least two ways to add labels showing the sum of Statistical Weight for each Labour force status:
Open the Analysis menu and select Show Mark Labels, OR
In the Marks card, click Label then put a check next to Show mark labels
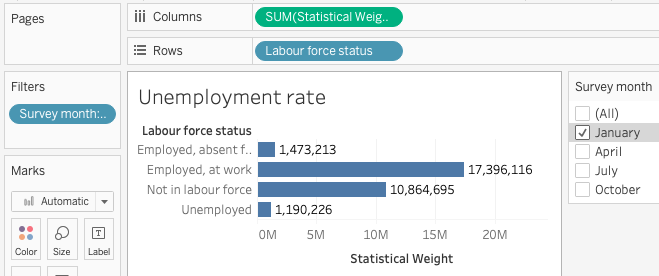
3Add a filter
We now have a bar graph showing an estimate of the population in each Labour Force Status category. But this number is four times too high because we have four months of data. To see the number of unemployed people in a single month, limit to January survey responses in one of two ways:
Right-click Survey month and select Show Filter, OR
Drag Survey month onto the Filters card
4Show as percentage of total
We are interested in the unemployment rate which is represented as a percentage of the population, but our labels show the actual population. To show percentages instead of sums:
Right-click the green Statistical Weight pill in the Columns shelf and select Quick Table Calculation -> Percent of Total
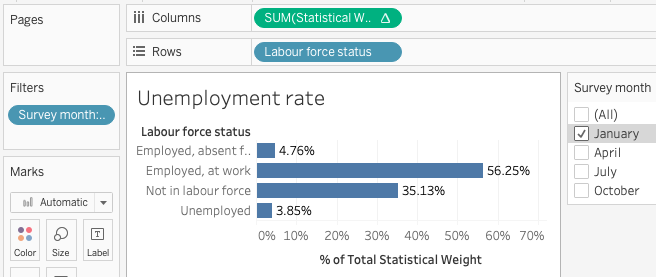
Exercise
The unemployed row shows 3.85% but this is not actually correct: Statistics Canada unemployment rate calculations exclude people “Not in labour force.”
Take a moment to explore and see if you can solve this problem. What is the actual unemployment rate for January 2020?
Click here for solutions
Solution 1: on the bar graph, right click the label "Not in labour force" and select Exclude. (Notice that this adds a new Labour force status filter to to the Filters card.)
Solution 2: drag theLabour Force Surveydimension from the left menu to theFilterscard and exclude "Not in labour force".
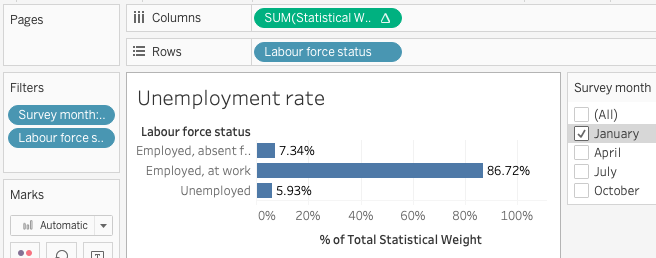
Canada's unemployment rate for January 2020 was 5.93%
Loading last updated date...