Load data to your new QGIS Project
Once you’ve created and saved a new QGIS Project, it’s time to add your data. This page will guide you through loading vector data as well as a CSV layer to QGIS.
Page Contents
Loading Vector Data
There are a couple ways to add data to your map canvas.
- Browser panel From the Browser panel, likely docked to the left of your screen, expand the
Homedirectory (aka folder) and navigate to your workshop data folder. Expand that folder to see the data inside, then double-click or drag and drop each file to add it to your project. Alternatively, you can add a Favorite connection in the Browser panel to save you the trouble of finding your data folder. To do this, click “Favorites” at the top of the Browser panel’s list and connect the workshop data folder as a favorite directory. Make sure not to click into, merely select it. - Data Source Manager The Data Source Manager is the same sort of portal as the Browser, just in a separate dialogue box rather than a docked panel. You can open the Data Source Manager by double-clicking the 3 colorful squares icon in the Toolbar, or from the Layer menu at the top of your screen.
- Layer menu A third way to add layers to your map canvas is through the Layer menu at the top of your screen. Under Layer, navigate to Add Layer (it should be the third item down) and select Add Vector Layer… or Add Raster Layer…. This will open the same Data Source Manager dialogue box as before.
- Drag and drop files from your data folder directly onto your map canvas.
To Do
Because our data is all organized in a single folder, we you can drag and drop to add our vector data to your project. Or, establish a Favorite Directory connection in the Browser Panel.
Add your vector data to your QGIS project in the following order:
local-area-boundaries.shpcensus-tracts.shpvan-parks.shpburnaby-parks.shp- The parks you downloaded yourself
cultural-spaces.geojson
Accept any transformation warnings.
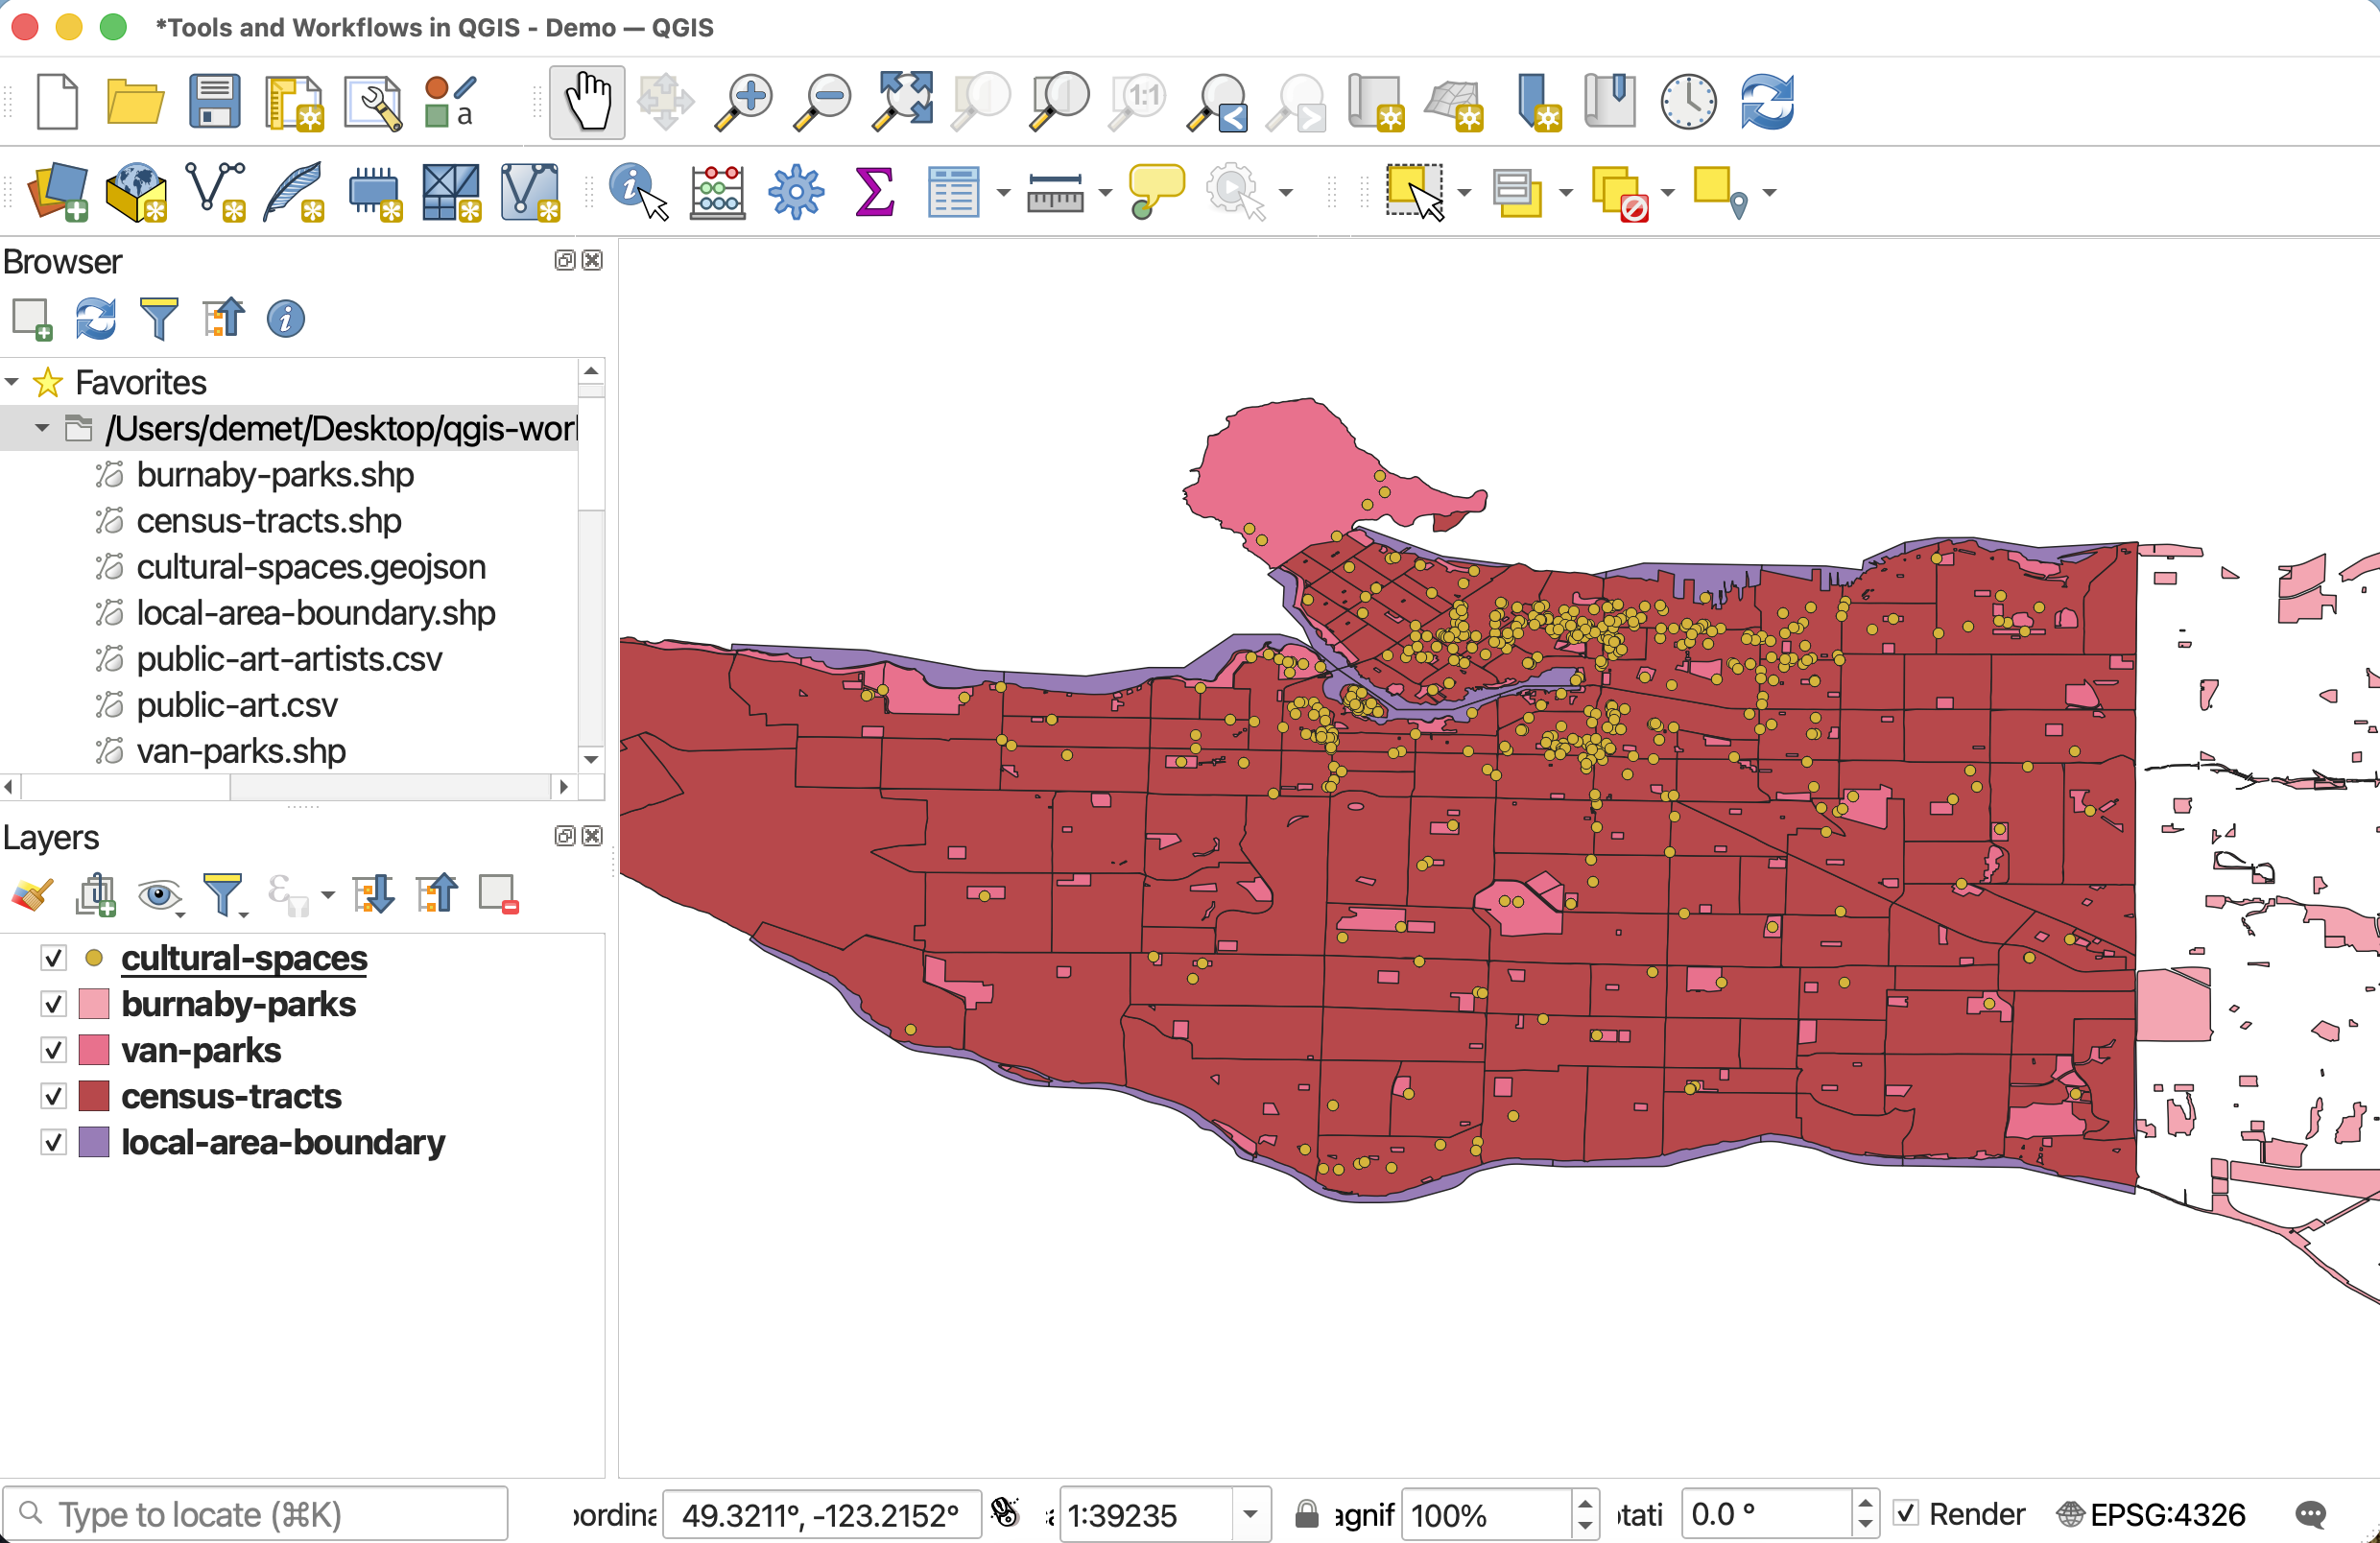
You should see the layers add to your screen.
Set the Project CRS
Your map might look a little wonky or warped. This is a projection issue. Each spatial dataset you add as a layer to your QGIS comes with it’s unique CRS, or Coordinate Reference System, which tells GIS how to visualize information pertaining to the 3-dimensional Earth in the 2-dimensional screen-space of your computer. A CRS is comprised of a Geographic Coordinate System (or GCS, measured in decimal degrees) and, often though not necessarily, a Projected Coordinate System (or PCS, measured in metric units). (See here for more.) Representing the earth in two dimensions necessarily involves distortion. While there are numerous Coordinate Reference Systems available (and you can even create your own), each has it’s advantages given what is being mapped — the whole world, a specific country or city, the polar regions, ocean navigation, area comparisons, etc. — because of their differential preservation of distance, direction, area, size, angles, and/or shape.
Now it’s is not unusual to add multiple layers to a QGIS project, each having a different CRS. The trick is to set your QGIS Project CRS to the CRS best suited to your location and topic of mapping. That way, QGIS will reproject all the project layers “on the fly” to match a single projection. Note that this doesn’t change the CRS of individual layers — it simply reprojects them while they are inside this one specific QGIS Project.
The reason your map looks warped is because QGIS automatically sets the Project CRS to the CRS of the first loaded layer. Let’s go ahead and see what that projection was, and change it so our map looks a little less wonky.
To Do
You can access the Project Properties from the the Project menu at the top of your screen.
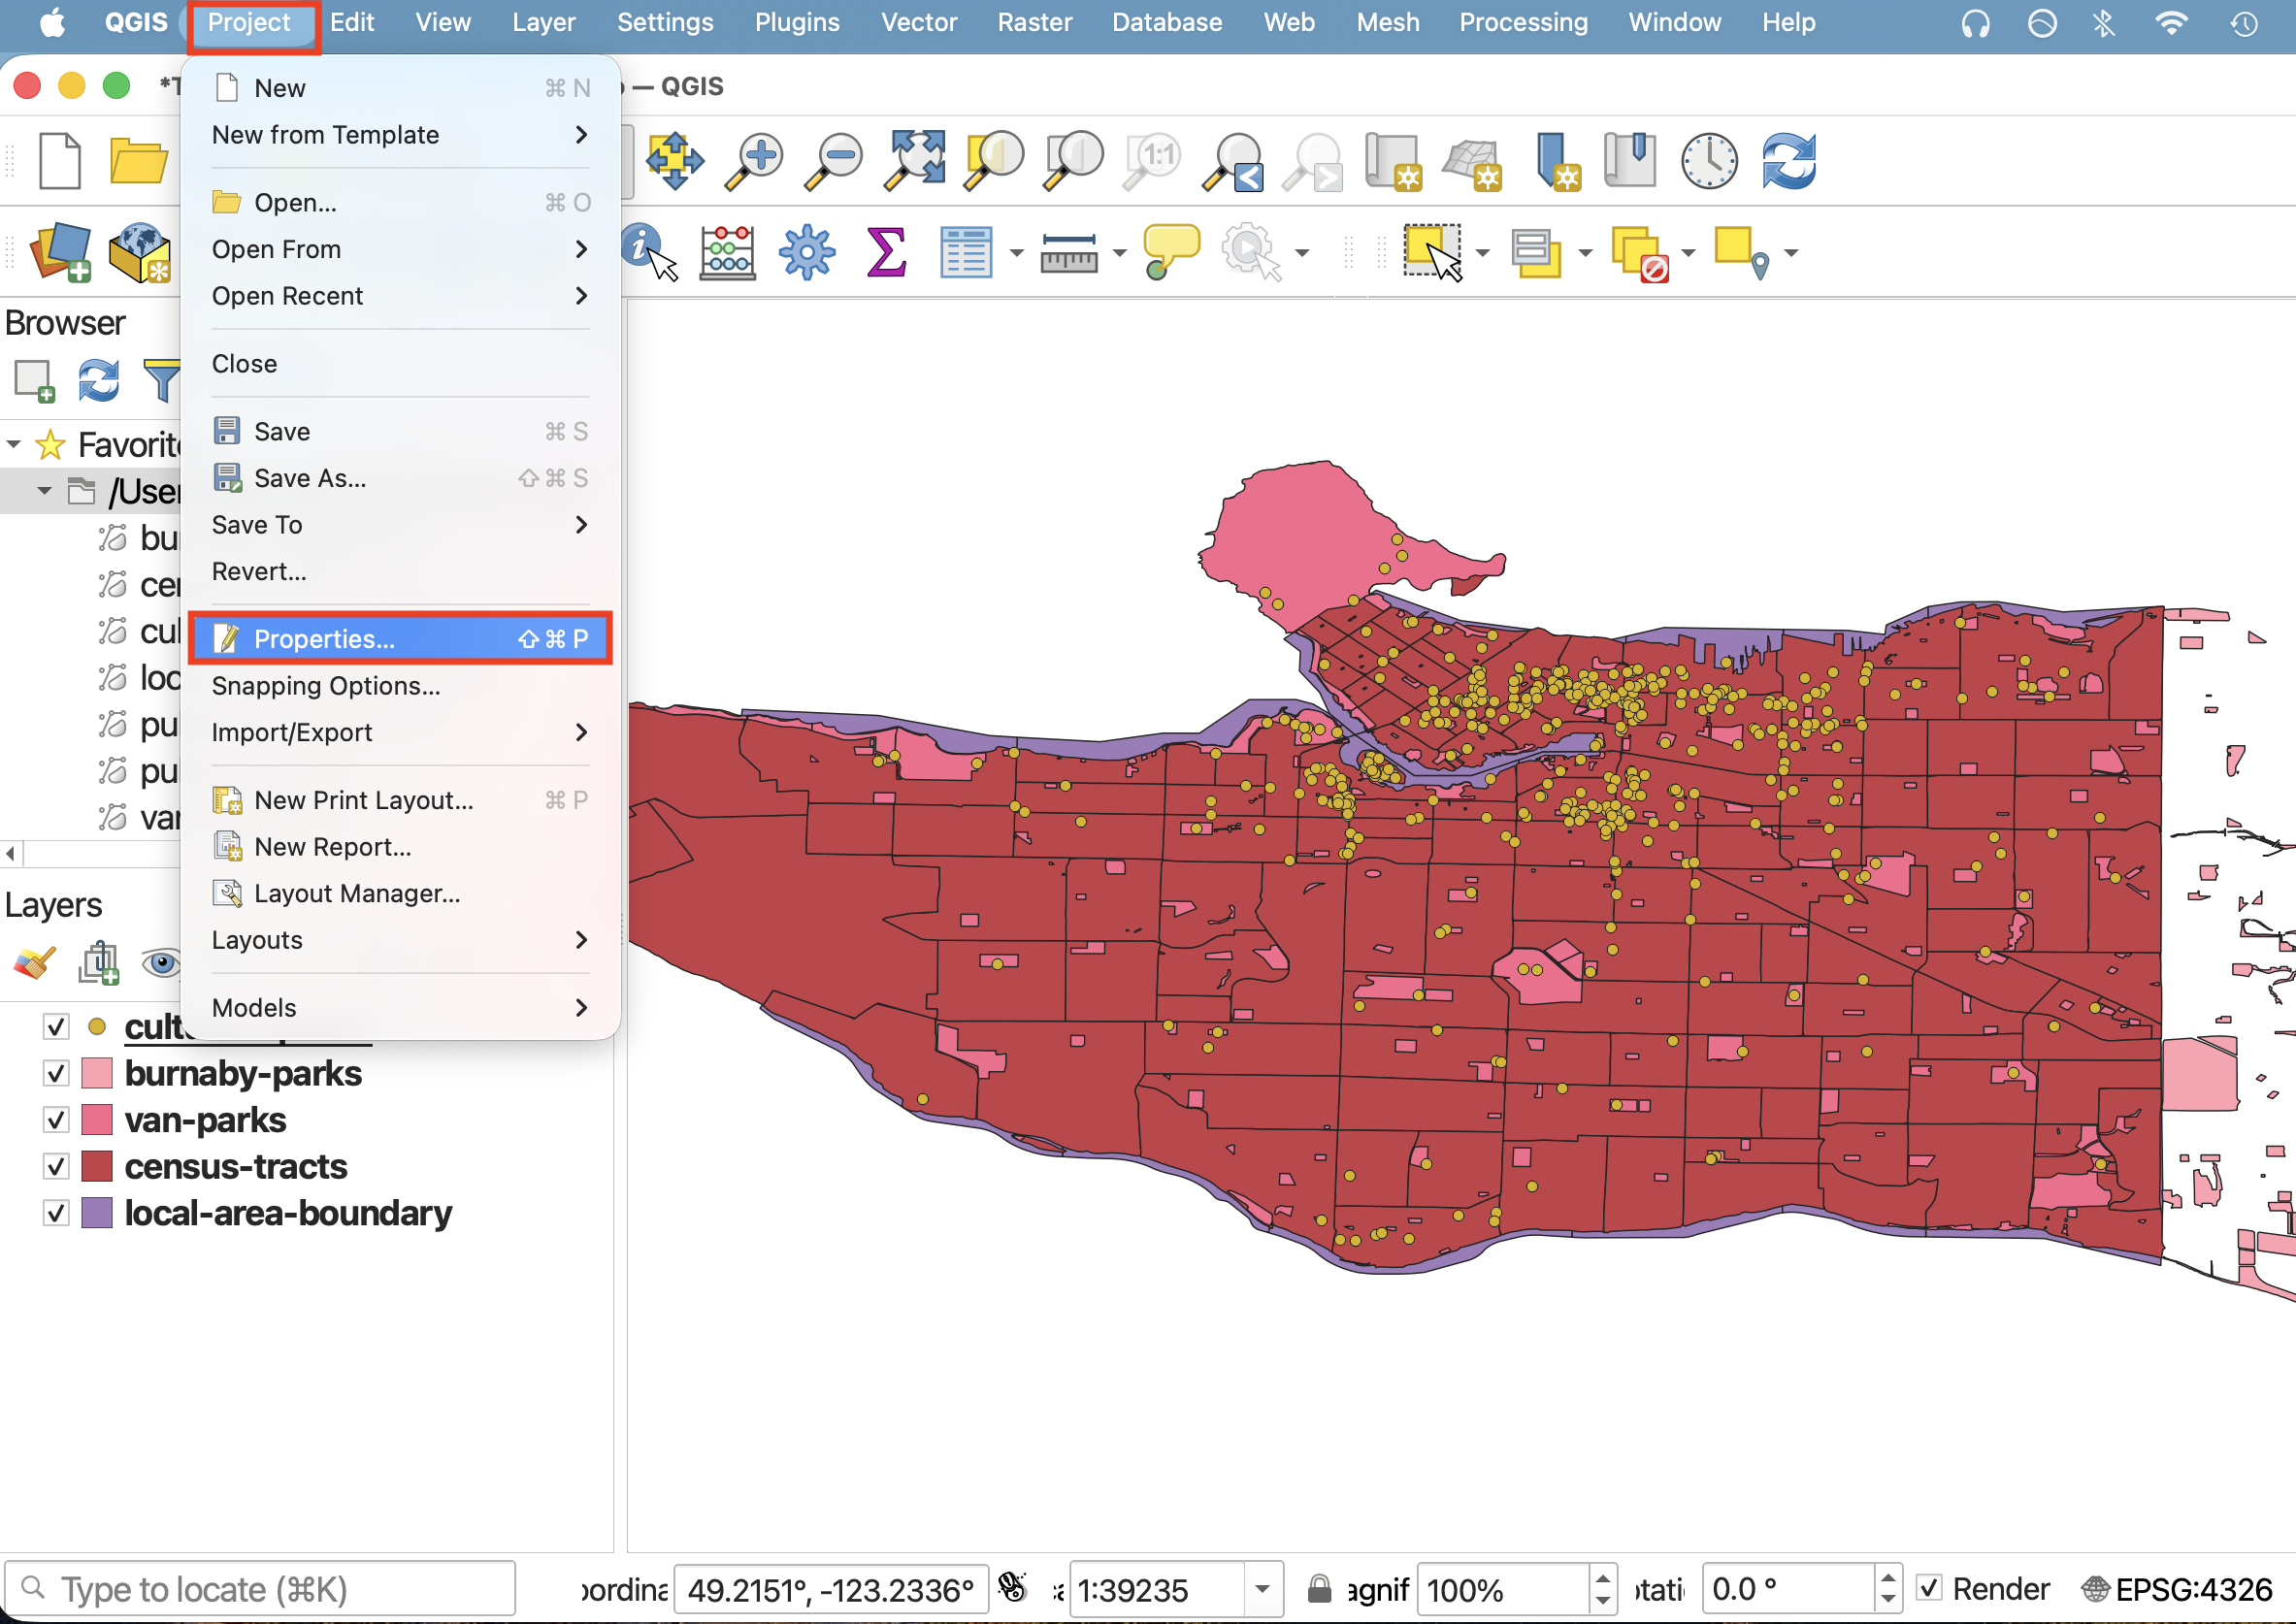
Open the Project Properties and click down to CRS. You can see the current project CRS is set to
WGS 84. You can see by the little map that this CRS is good for the whole Earth, but causes distortions to our data when zoomed-in at small scale. This is specifically becauseWGS 84uses latitude and longitude for coordinates whereas our data has been ‘projected’ into metric distance.
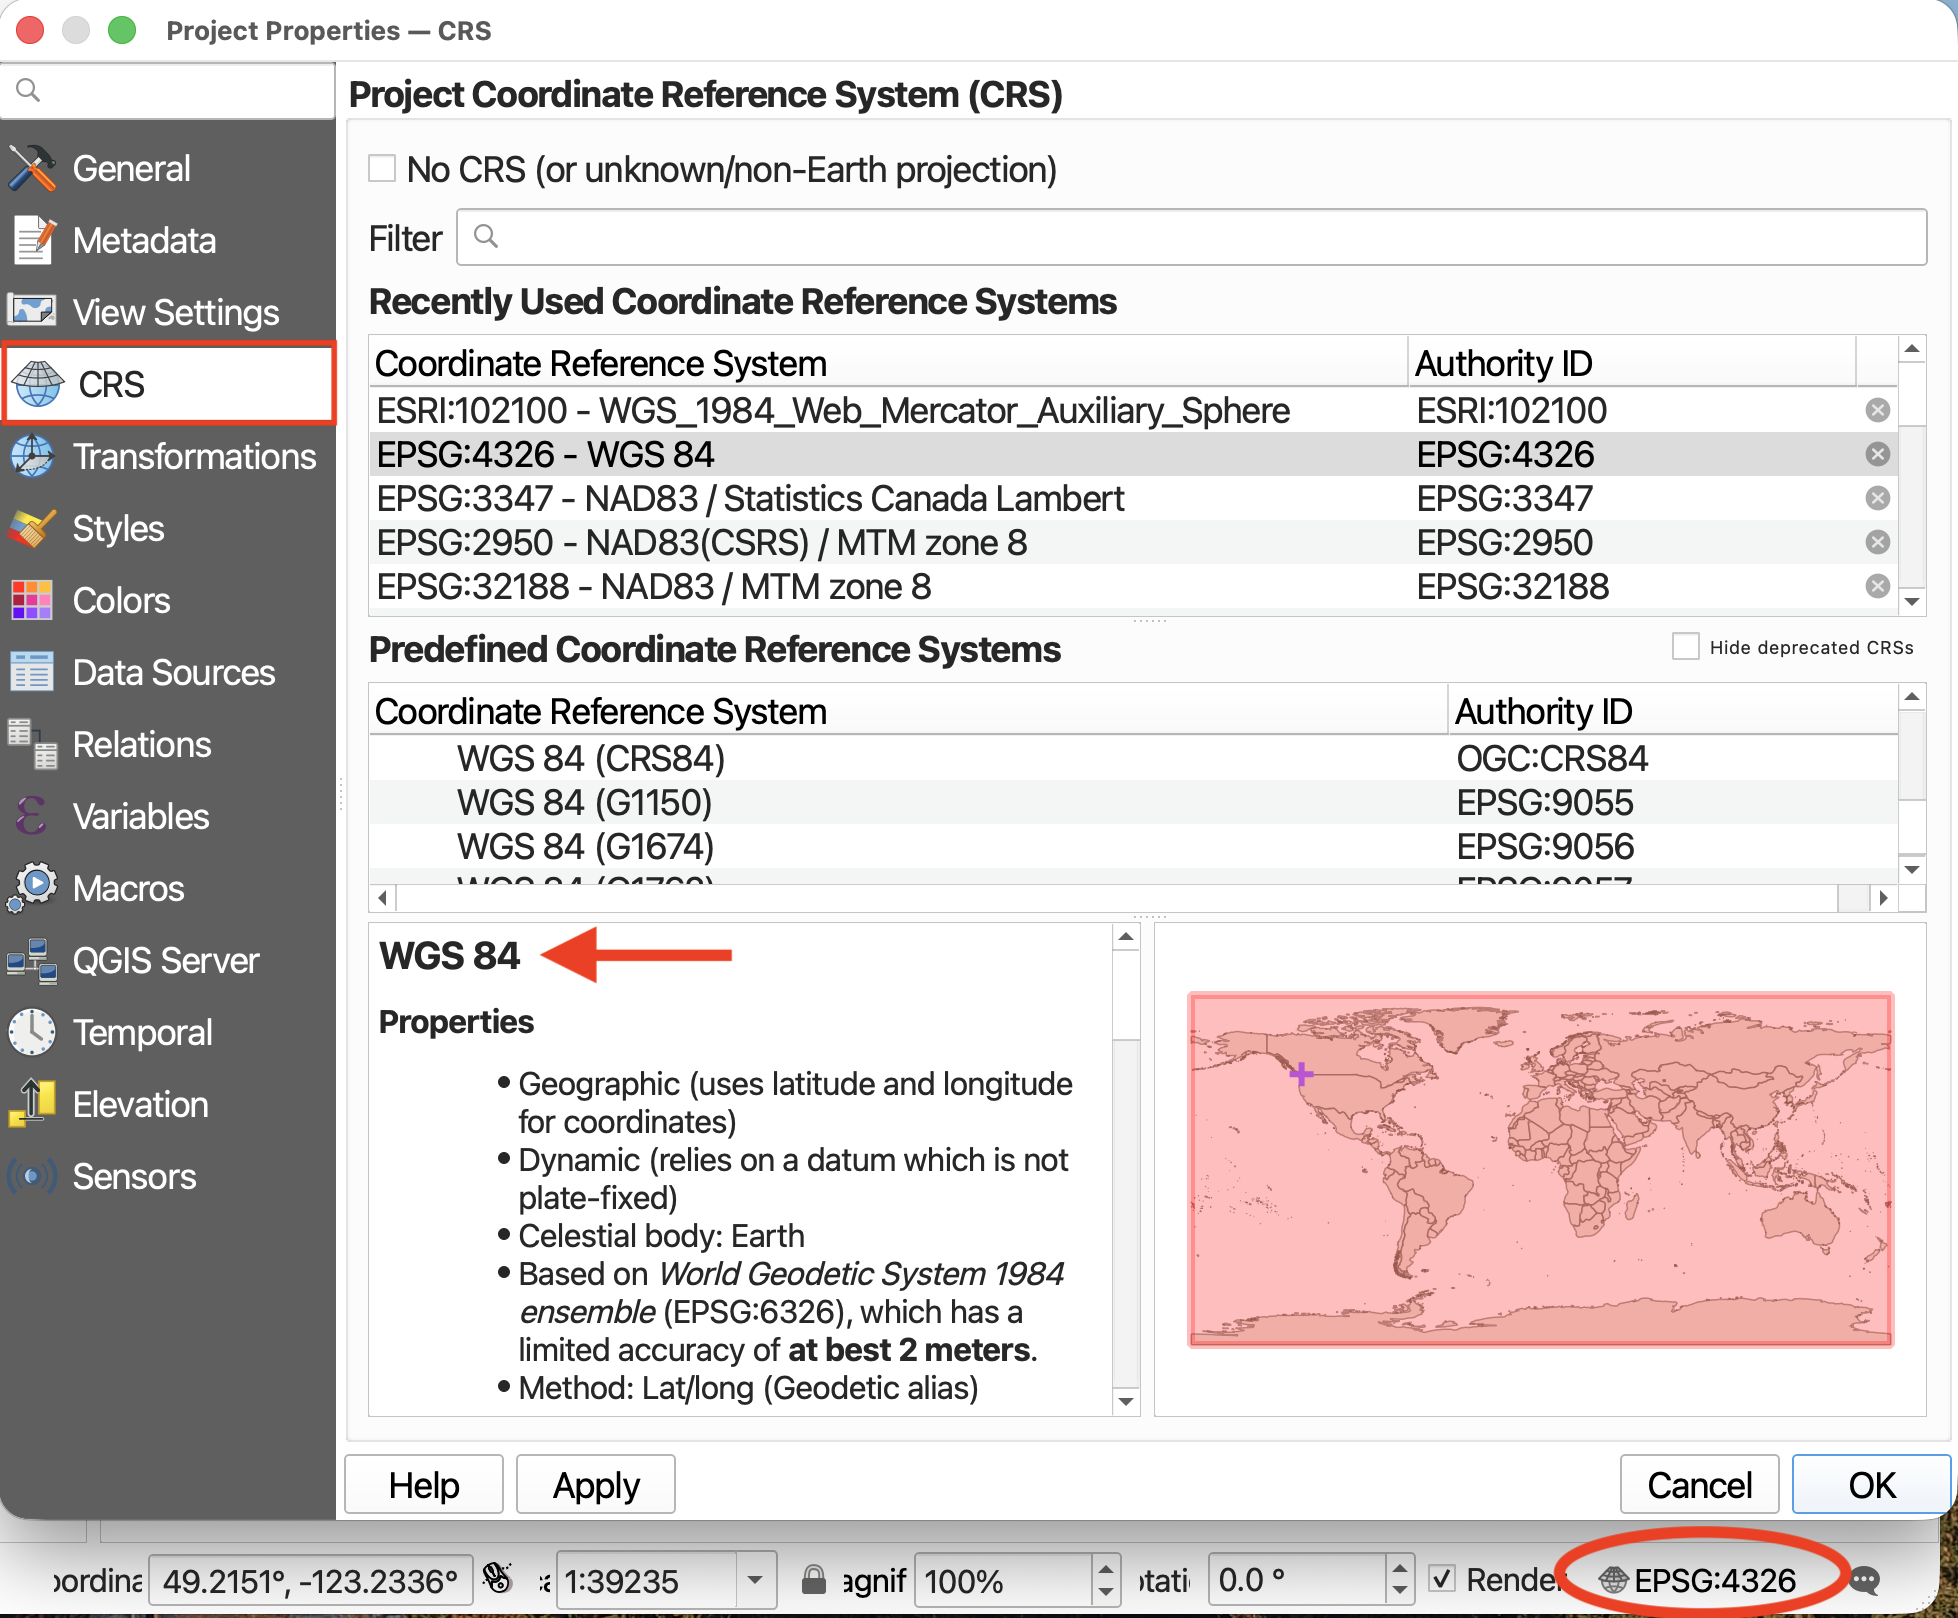
Note: You can also see the same CRS, although designated EPSG:4326, is visible in your main interface Status Bar. You can always click on the CRS in your Status Bar to bring you to your Project CRS.
Let’s first change the CRS to something specific to Vancouver. In the Filter search bar at the top of the window, copy/paste in the following CRS:
NAD83 / UTM zone 10N.
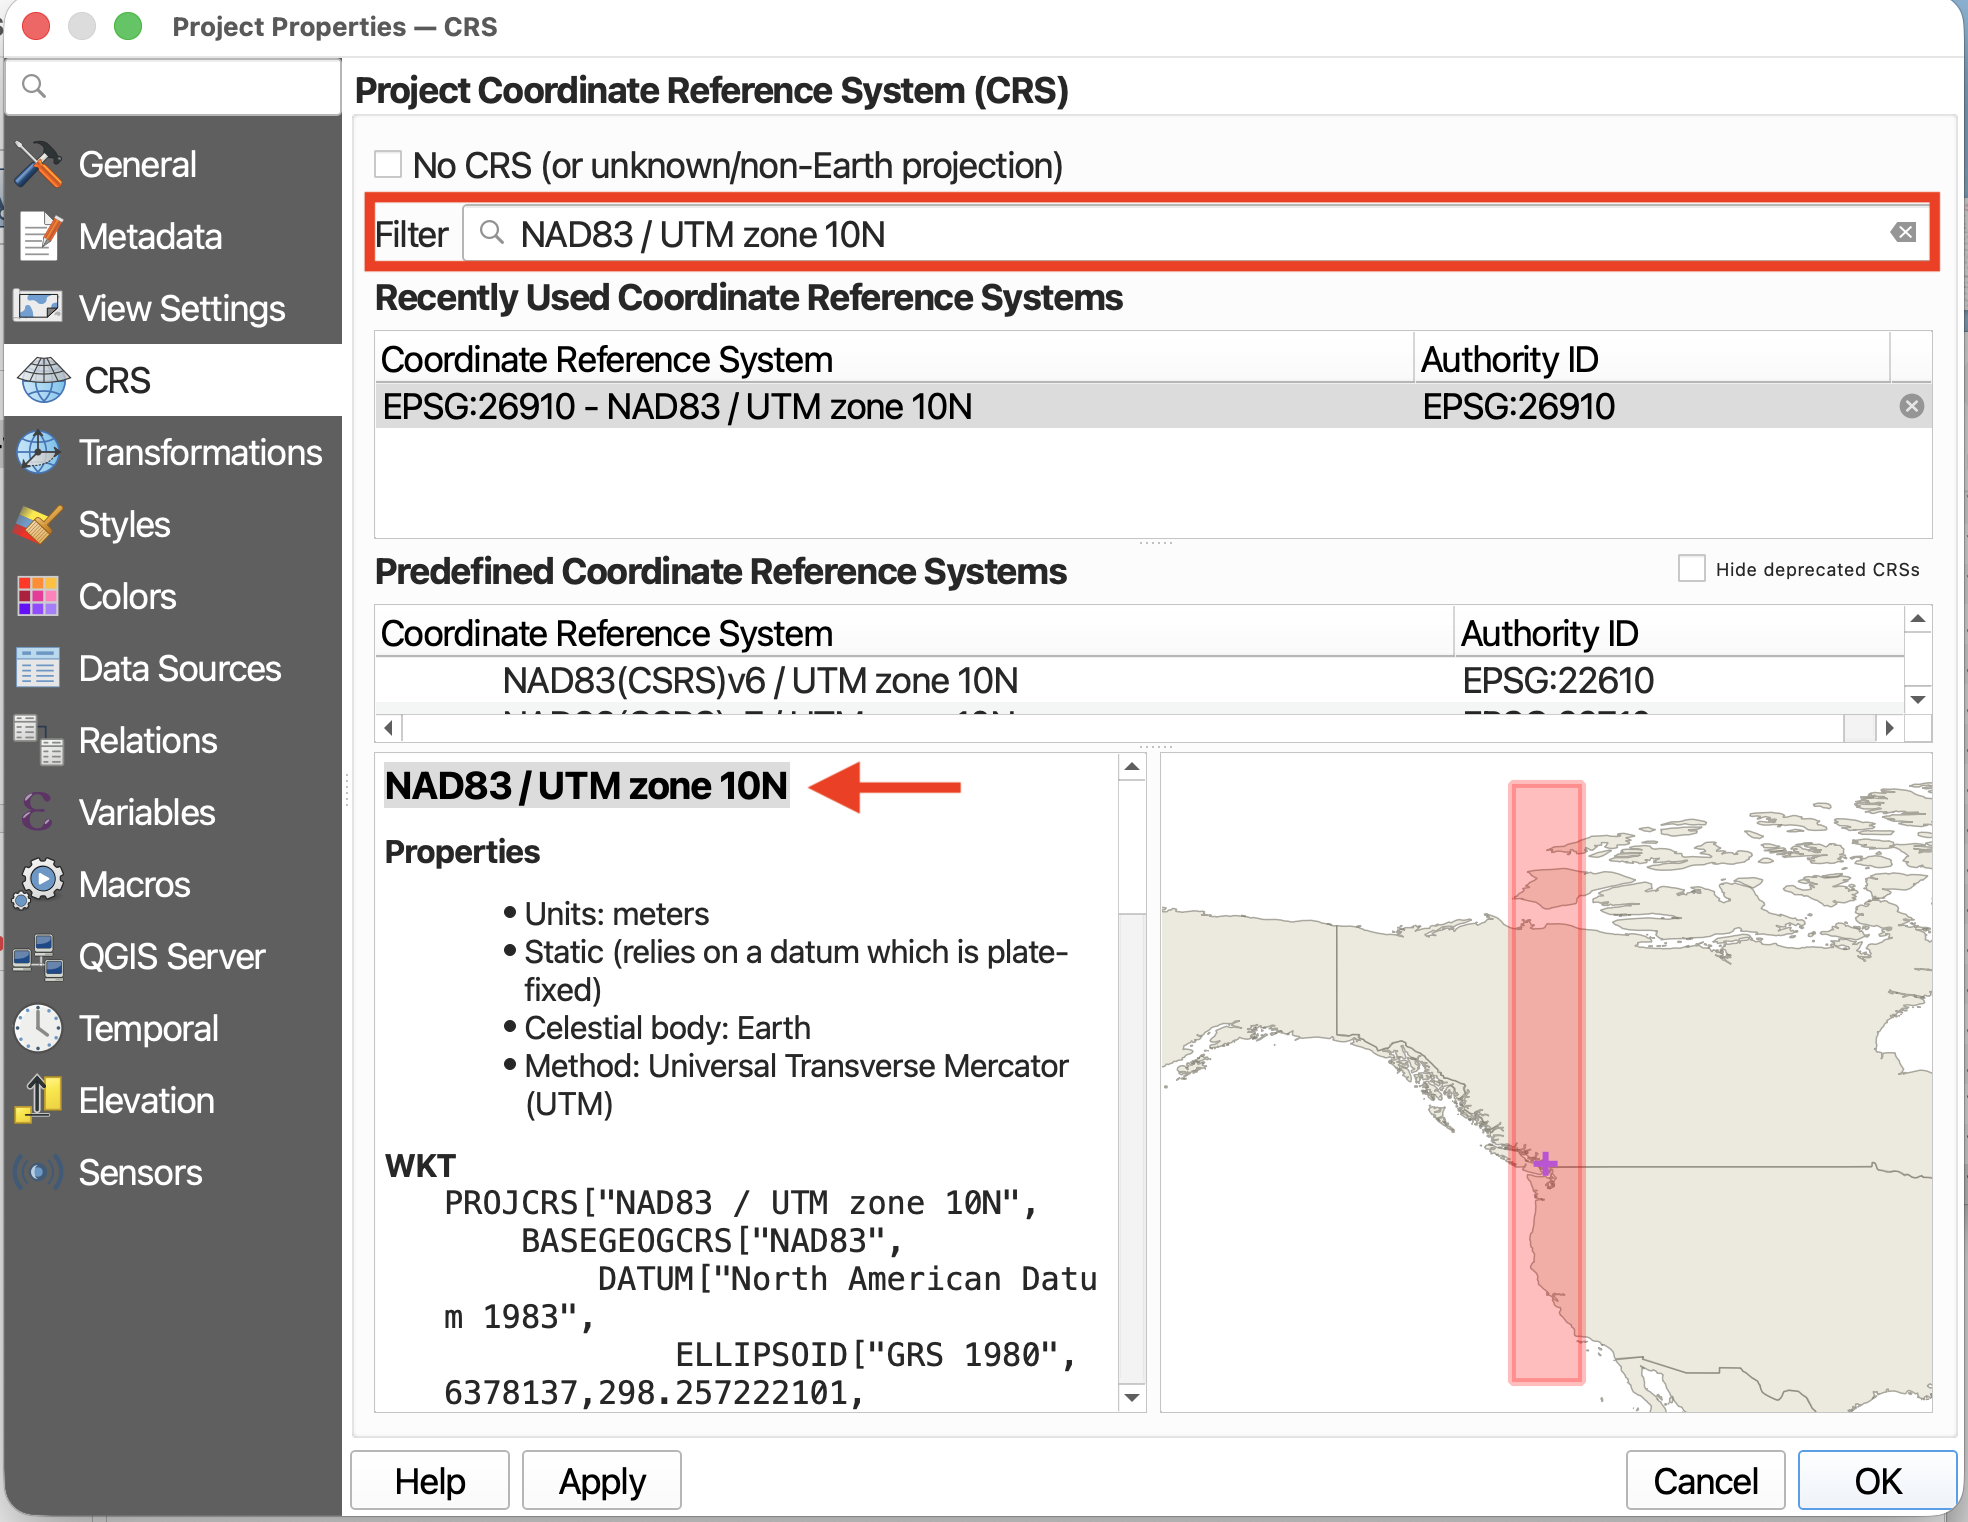
Click OK and your map should already look better.
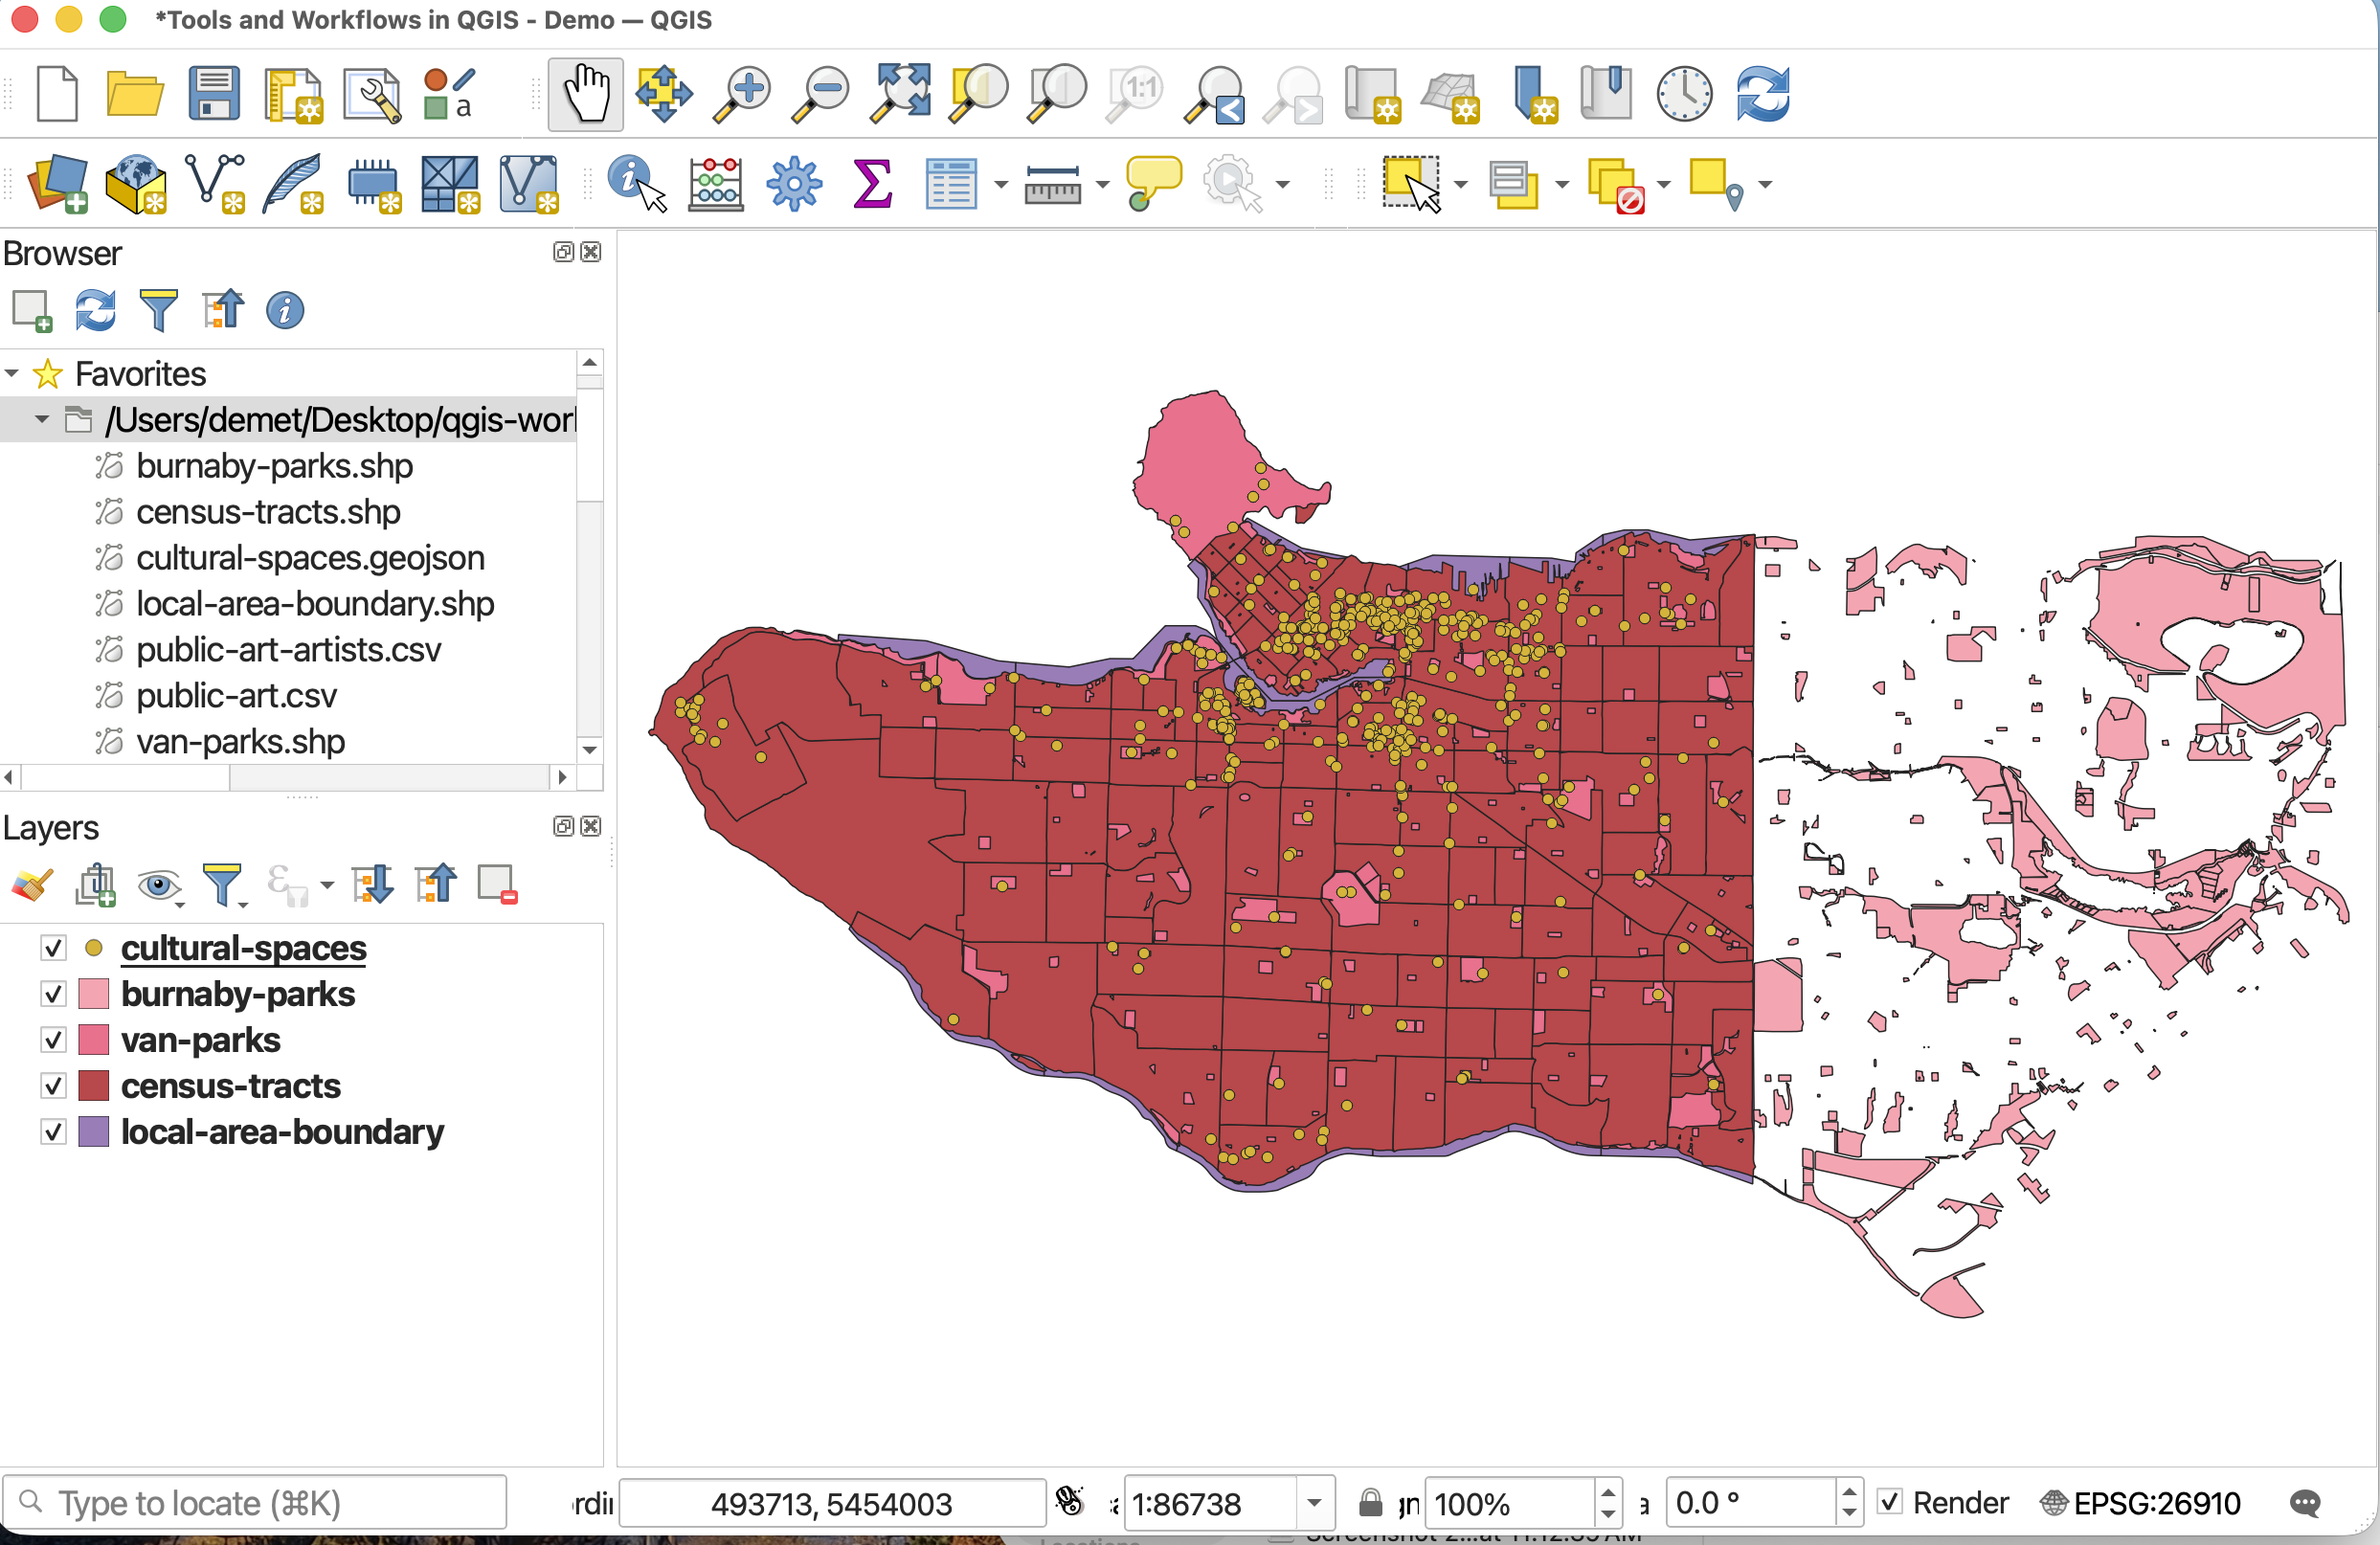
 Before continuing, SAVE your project.
Check
After setting the project CRS, check the units of measurement. Under General properties, make note of the units for area measurement.
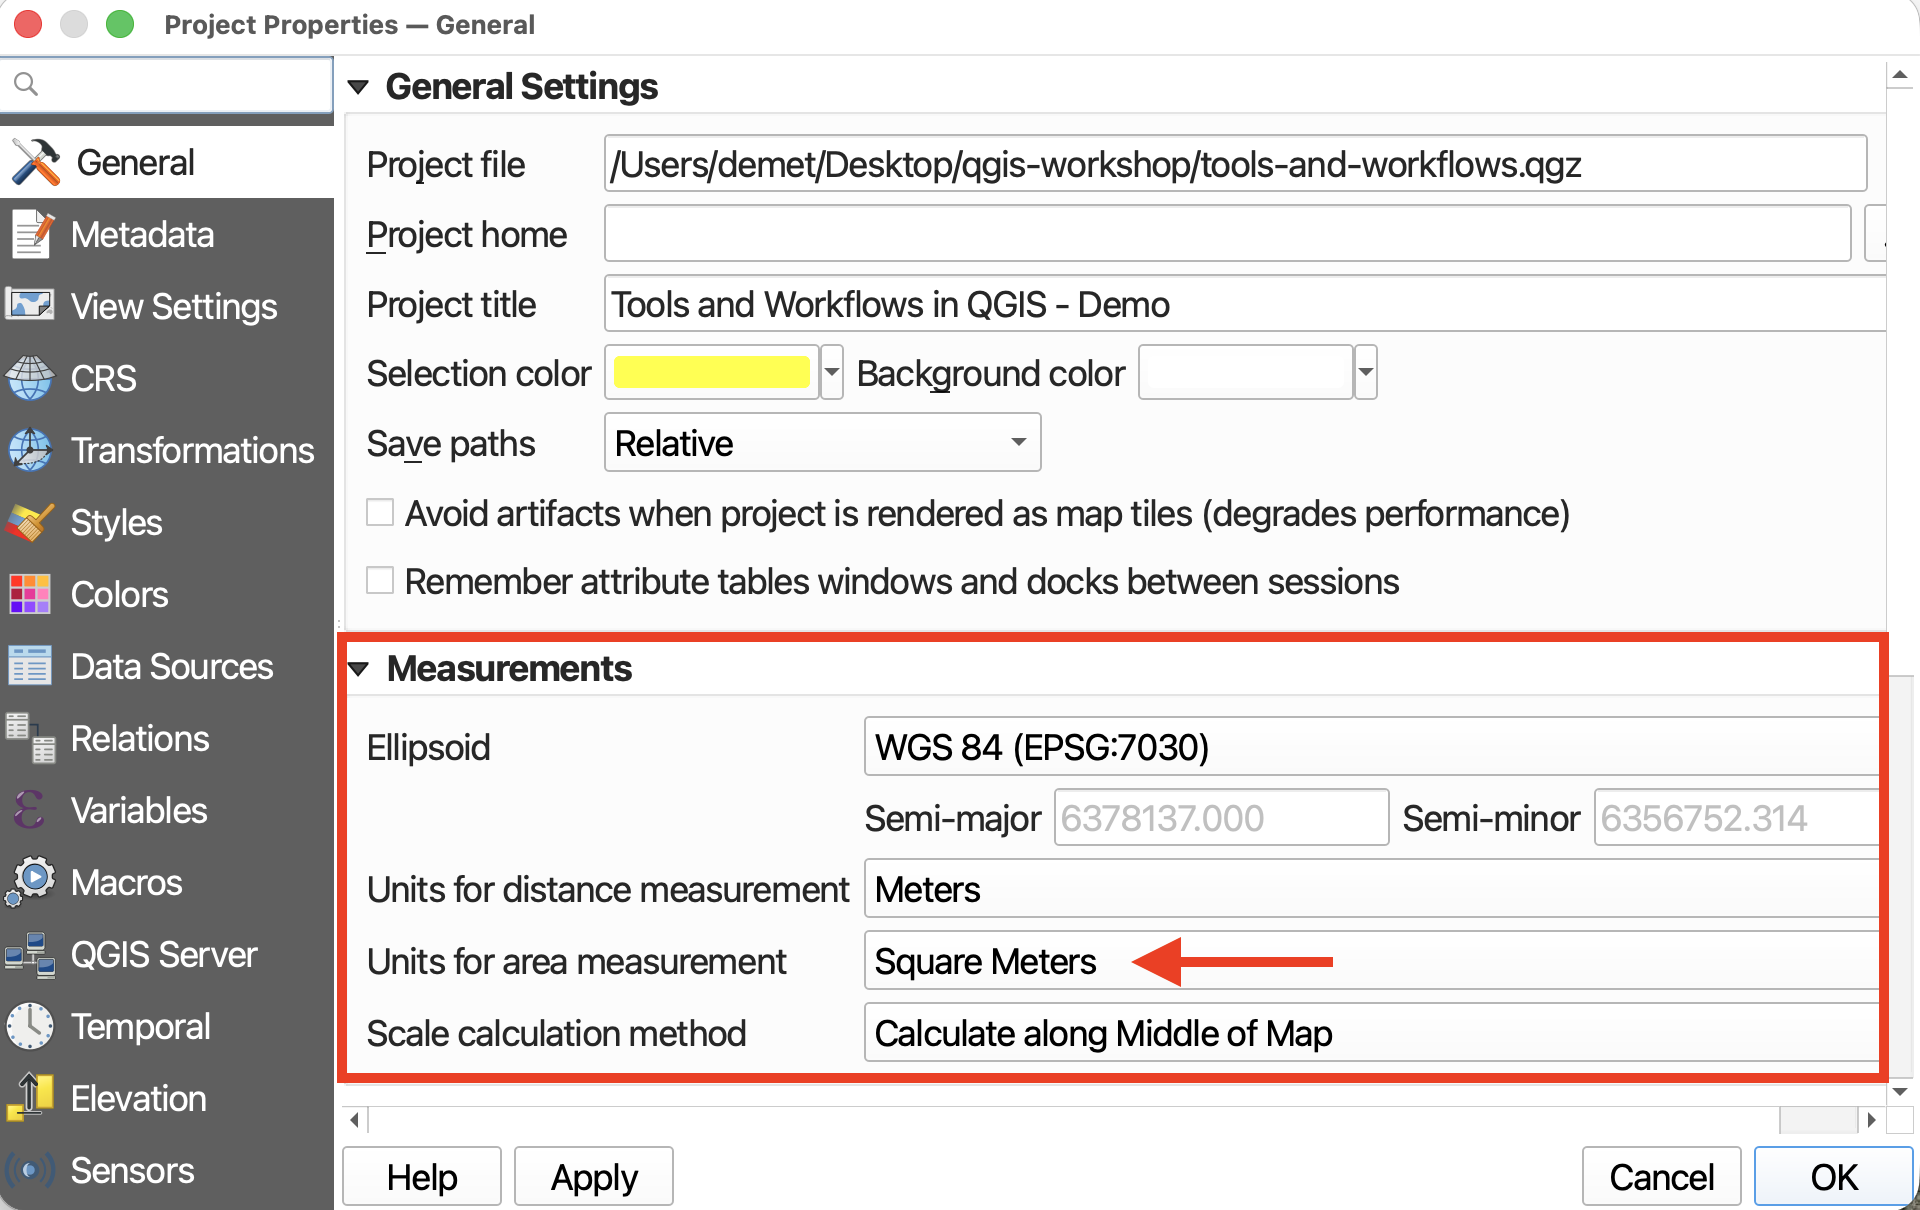
Loading CSV data to QGIS
If you try and drag public-art.csv or artist-info.csv to your map canvas, nothing will show up and the layer will look different in your Layers panel. That’s because these two files are formatted as CSVs.
Tabular data stored in CSV (comma separated value) files can be uploaded to a GIS and rendered spatial so long as latitude and longitude are given in two distinct columns and their values stored as numbers. Tabular data must be in a CSV file format with latitude and longitude stored as numbers in two separate columns before uploading to QGIS.
To Do
From the Layer menu at the top of your screen, go to Add Layer -> Add delimited text layer…
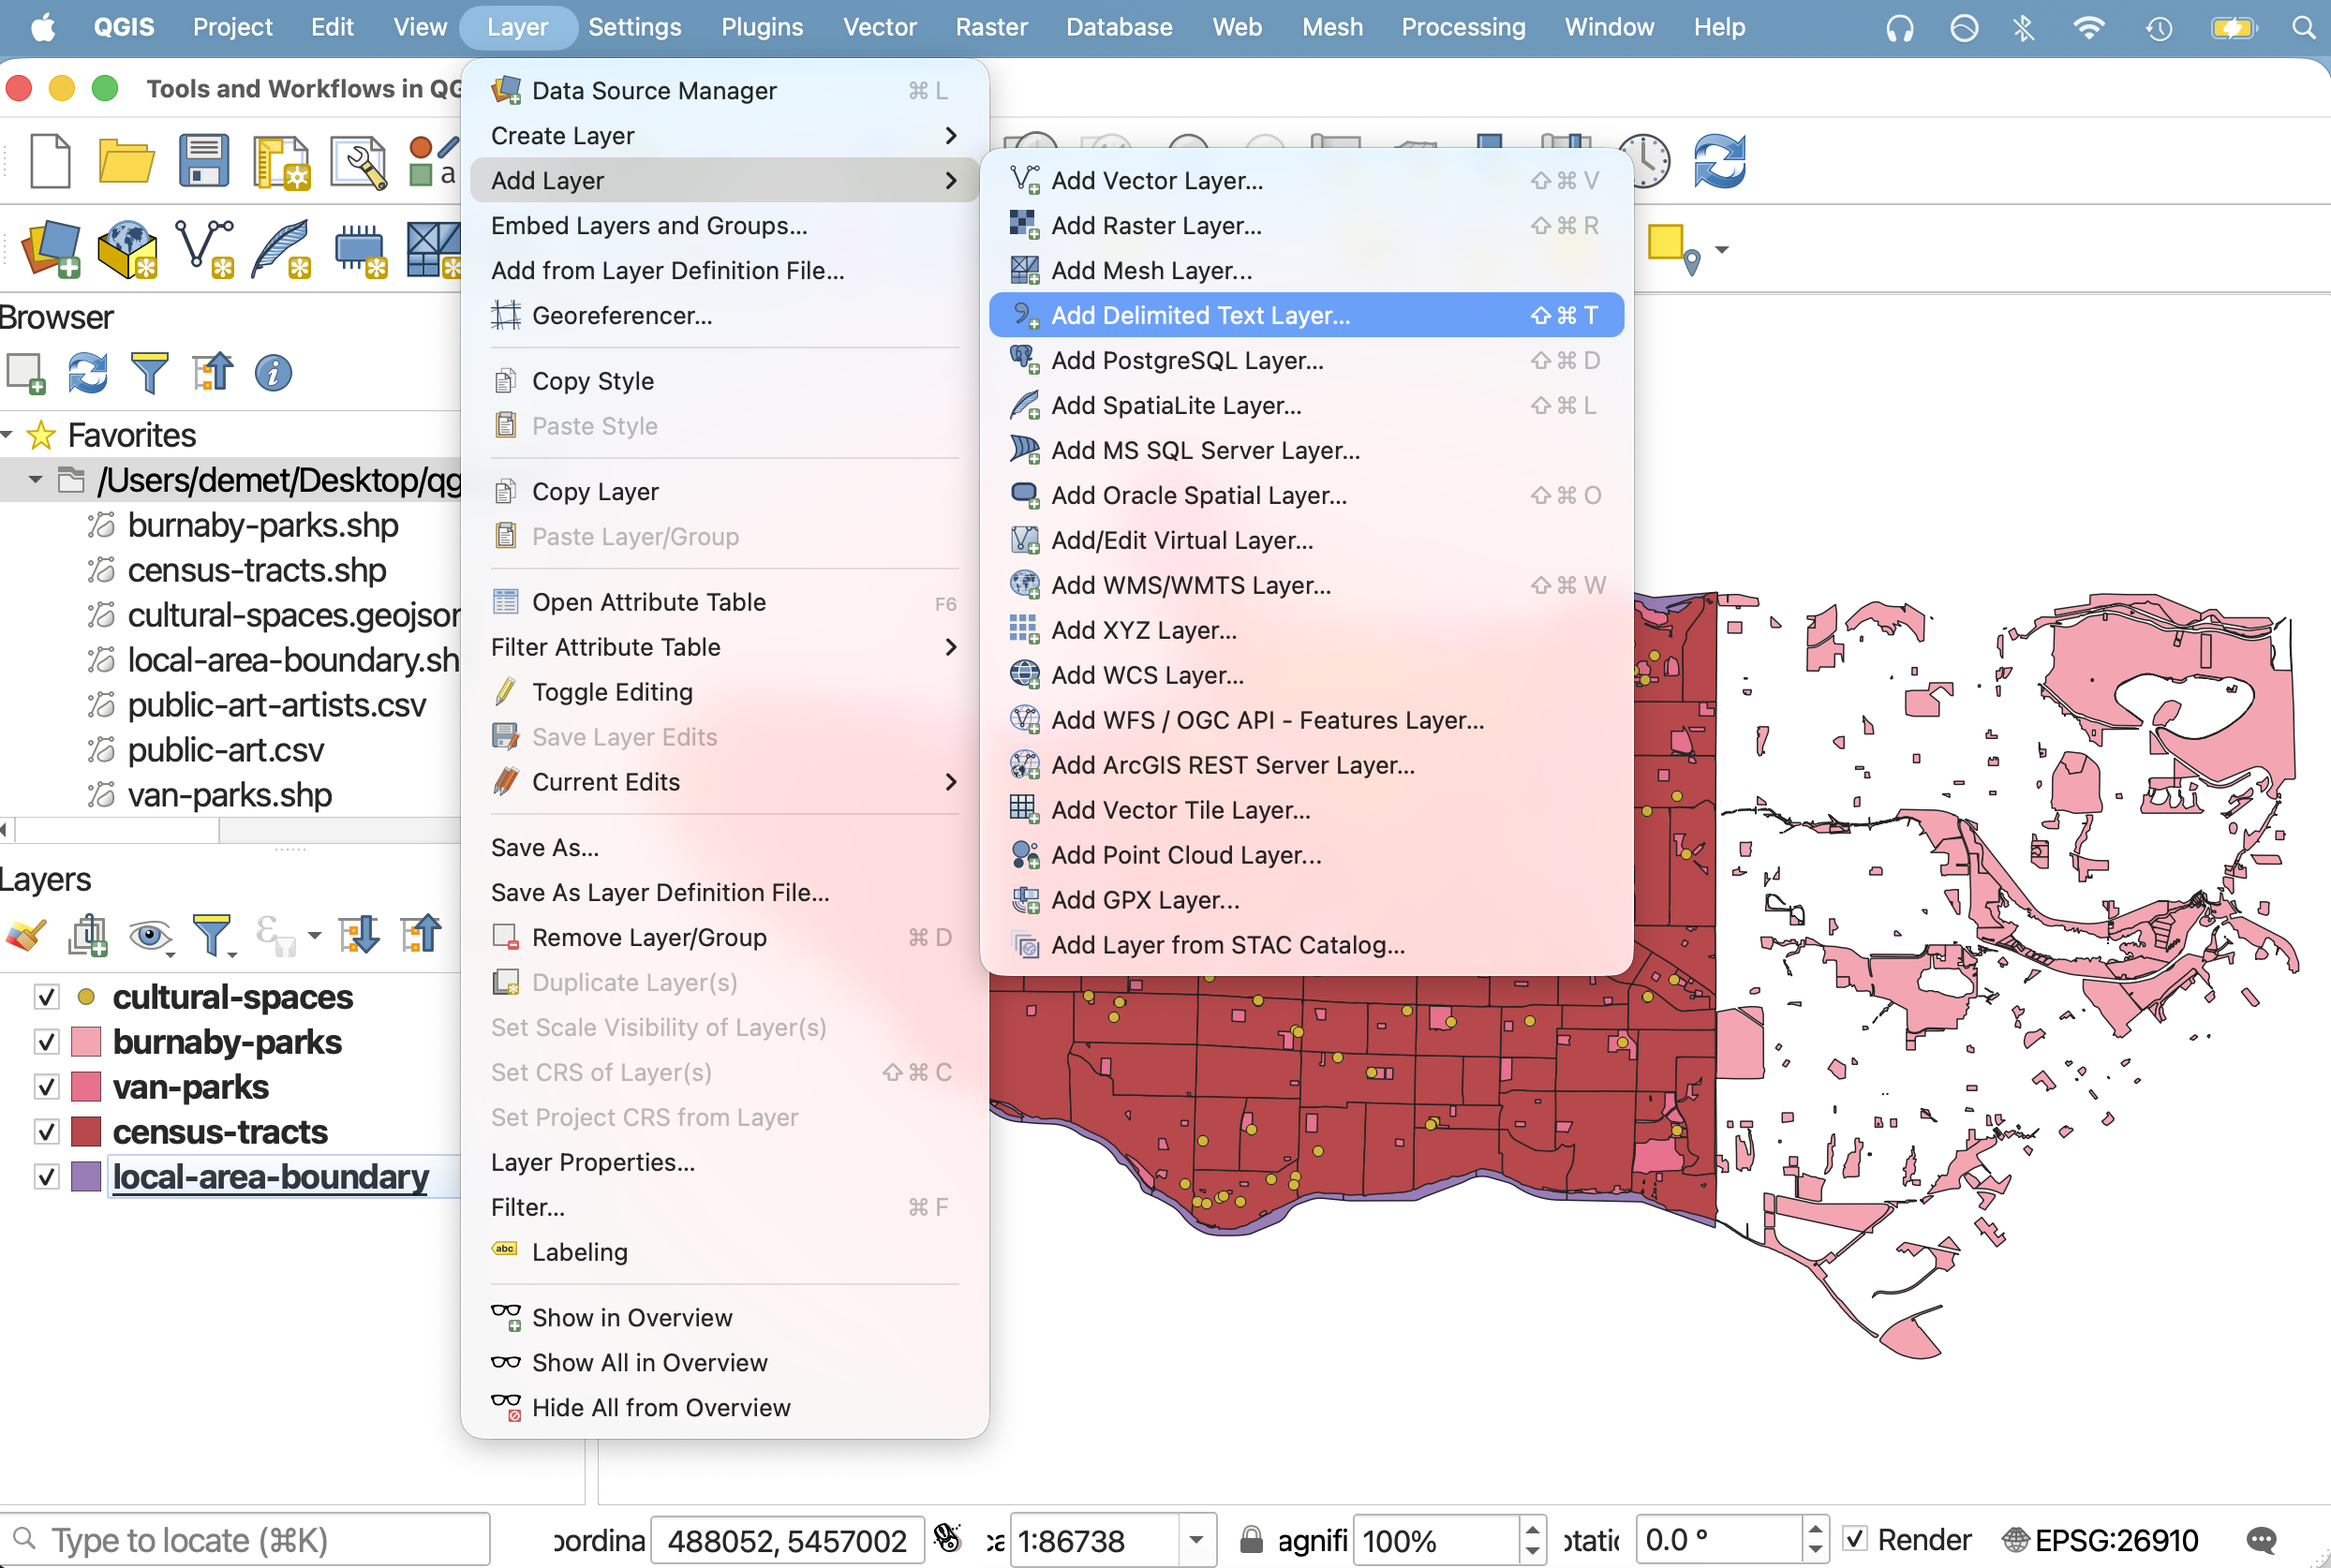
The Data Source Manager will open. Click the three dots
...beside File name to navigate topublic-art.csvand select it.
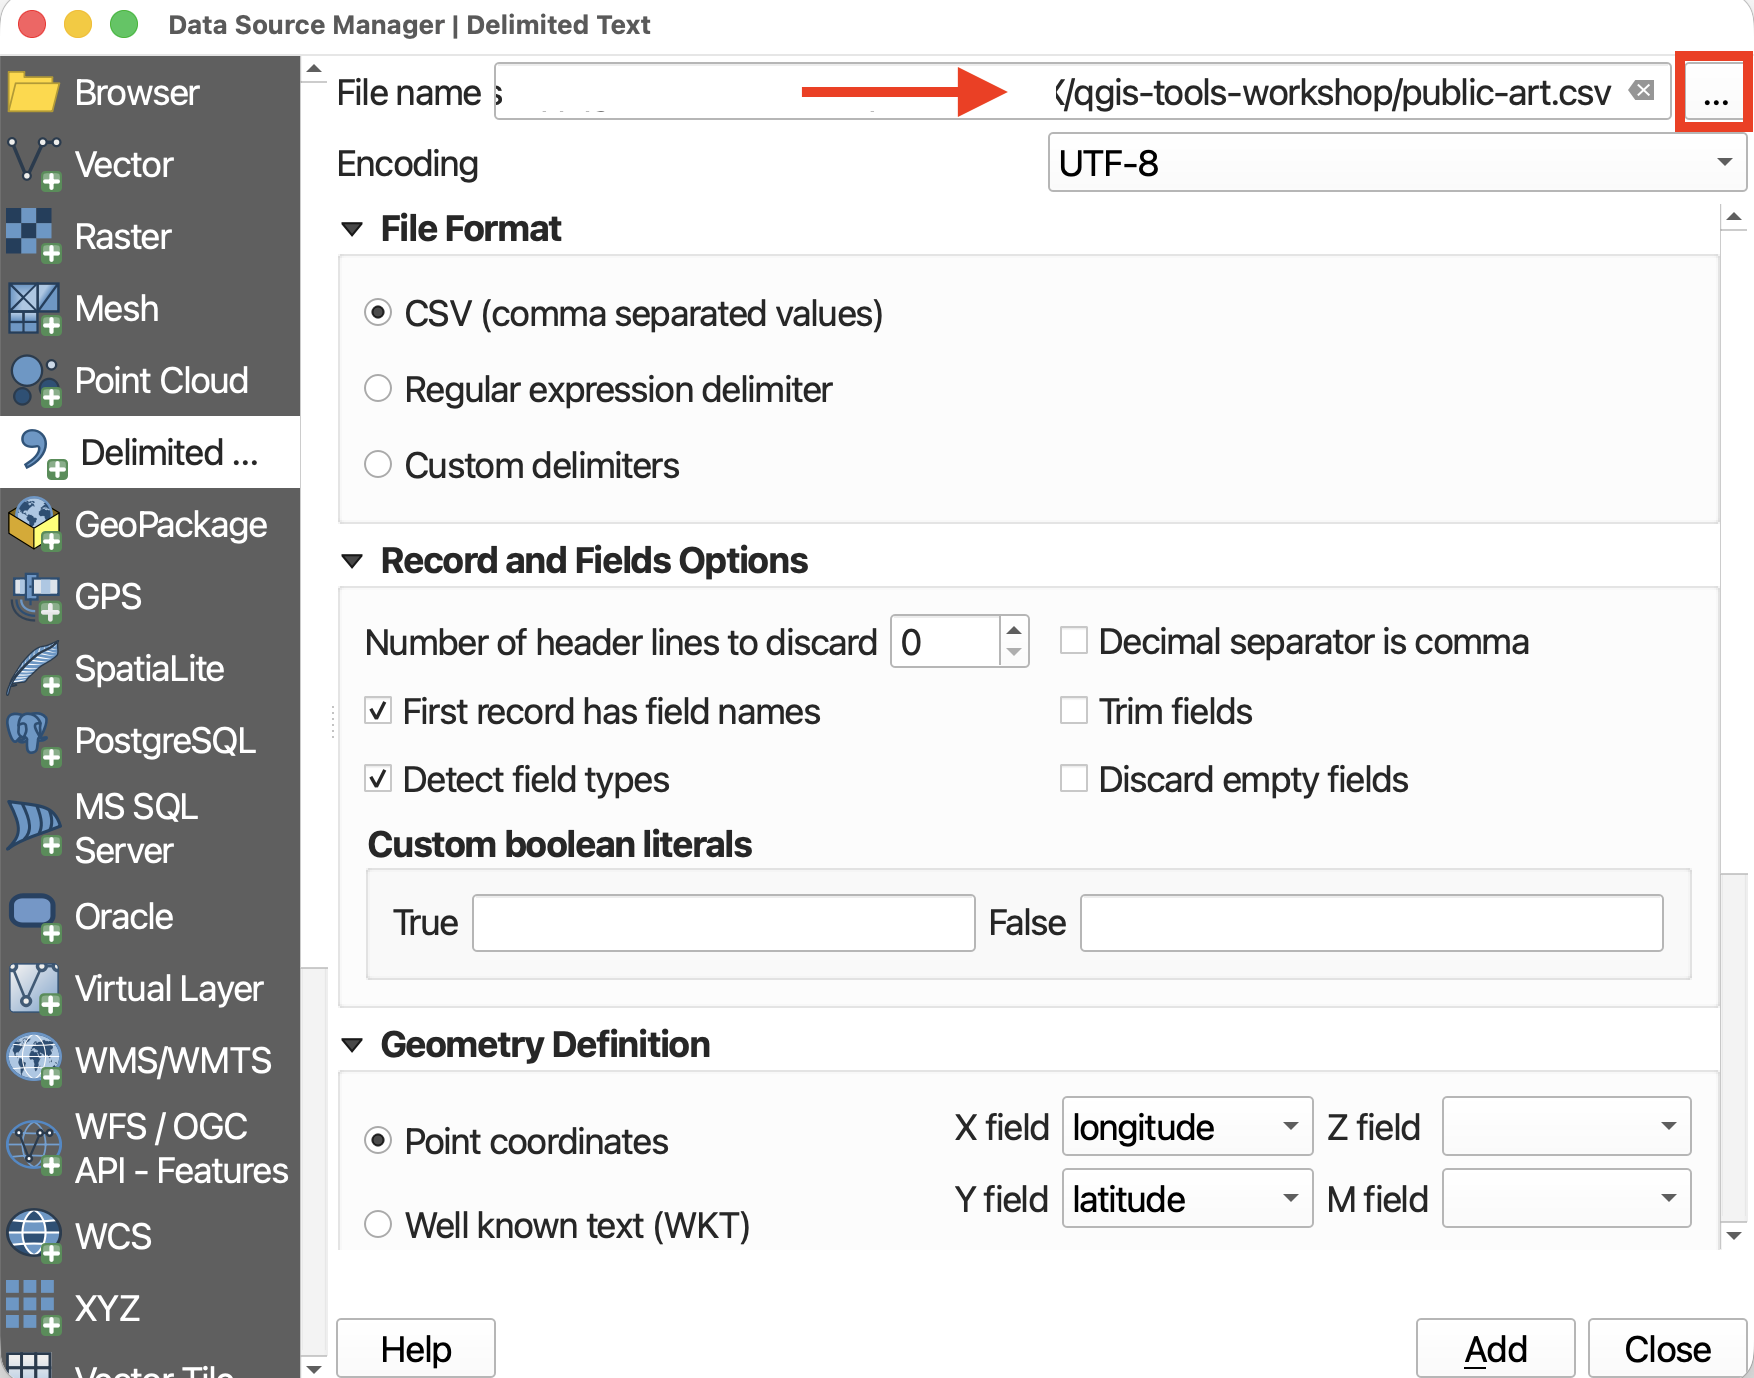
Scroll down to Geometry Definition, and ensure Point Coordinates is selected. Ensure the X field is set to longitude and the Y field is set to latitude. This may seem counter intuitive, but consider what values change as you move towards the north or south pole. As you move up or down towards the north or south pole — in other words, as you change along the Y-axis — you are changing latitudes. If you move east to west around the globe - constituting change in the X-axis direction - you are changing longitude. When uploading CSV data, it is important to know what CRS it was gathered/downloaded in. Since this dataset was downloaded from the City of Vancouver in
WGS 84, you can keep the default Geometry.
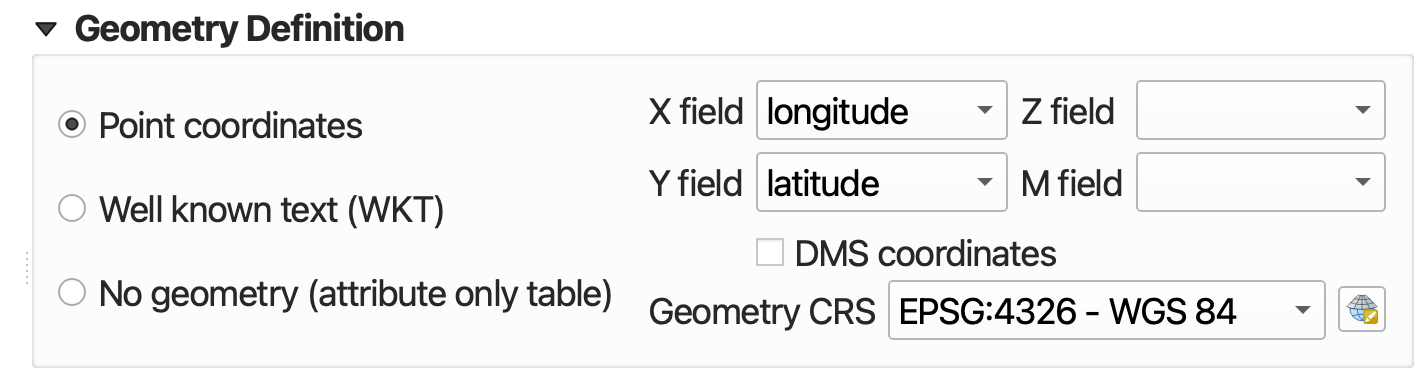
Now look below to the Sample Data section. This gives a preview of your dataset. The data is difficult to see because you cannot expand it, but scroll horizontally until you reach the last two fields (or whichever fields contain your personal data’s latitude and longitude). If you scroll vertically (I recommend using the up & down arrows, otherwise you may accidentally change the field type), values will be revealed line by line. Ensure the columns for latitude and longitude are being read as Decimal (double), not text.

Now click Add at the bottom right-hand corner to add your CSV as a spatial layer to your map. Once you add the layer, the Data Source Manager will not go away, so you’ll have to close it.
public-artshould now be added to your map canvas.
Zoom-to the new layer.
Export your spatialized CSV layer to a permanent spatial file
There is one last step. Importantly, this file is still a CSV. It’s simply been spatialized by QGIS. In order to edit the file, you’ll have to export it in a geospatial file format such as a GeoJSON or Shapefile. To export a layer, right-click the layer and go to “Export”. Then give it a name and location by clicking the tree dots next to the Layer Name input. Change the file format to GeoJSON. Because this file is point data containing coordinate data, we will set the CRS to WGS84.
Drag the new spatial layer of
public-artto the top of your Layers panel, and remove the CSV from your map.
Your data isn’t saved inside your QGIS project. Rather, the filepath connections are saved, as well as any modifications to symbology made to the layers in QGIS. When mapping in QGIS, it’s important to keep track of where the data you’re working with is stored. If you move your data, QGIS won’t know where to look for it and a red exclamation mark will appear in the Layers Panel. You can click on this warning to tell QGIS where the data is now stored.
Managing and Interacting with Layers
For a review of how to interact with Layers and stay organized, please see our Intro to Mapmaking with QGIS resource which was a prerequisite for attending this workshop.
Resources for Data Wrangling
- Spatial data is stored in a variety of file formats. See the QGIS Documentation for Opening Data to learn more.
- Working with Spatial Data by Lincoln Mullen
- Concordia’s Guide to geospatial data
- Creating data freehand with geojson.io
- Terrastories, a tool by Awana Digital, is a great resource for collecting place-based data on the go.
- ArcGIS Survey 124 allows you to collect surveys with spatial information.
- Creating a new shapefiles in QGIS
- Considerations for downloading data
- Geocoding in QGIS
- Tutorial on Spreadsheet Skills from Hands-On Data Visualization by Jack Dougherty & Ilya Ilyankou
Loading last updated date...