Data Wrangling
Although there is a lot of spatial data available for download which, with some modification (using tools and workflows largely introduced tomorrow), can suit a variety of mapping purposes, you will doubtless run into situations where you have to create your own data. For example, maybe you want to plot significant sites visited by the protagonist of a novel, or the opera houses frequented by a notable musician.
This page outlines common workflows and considerations — whether you are creating spatial data from scratch or simply turning latent spatial information into a form legible to mapping tools and platforms.
On this page:
Creating data freehand with geojson.io
You can easily create a dataset containing one or more points, lines or polygons using the online platform geojson.io. Here, you can click and draw on the interface, then save your dataset as multiple spatial file formats. Not only is Geojson.io an easy way to create a small set of point, line, or polygon data, it is also a great tool to quickly change between formats once your data is spatialized.
Create a point over UdeM
1Go to geojson.io 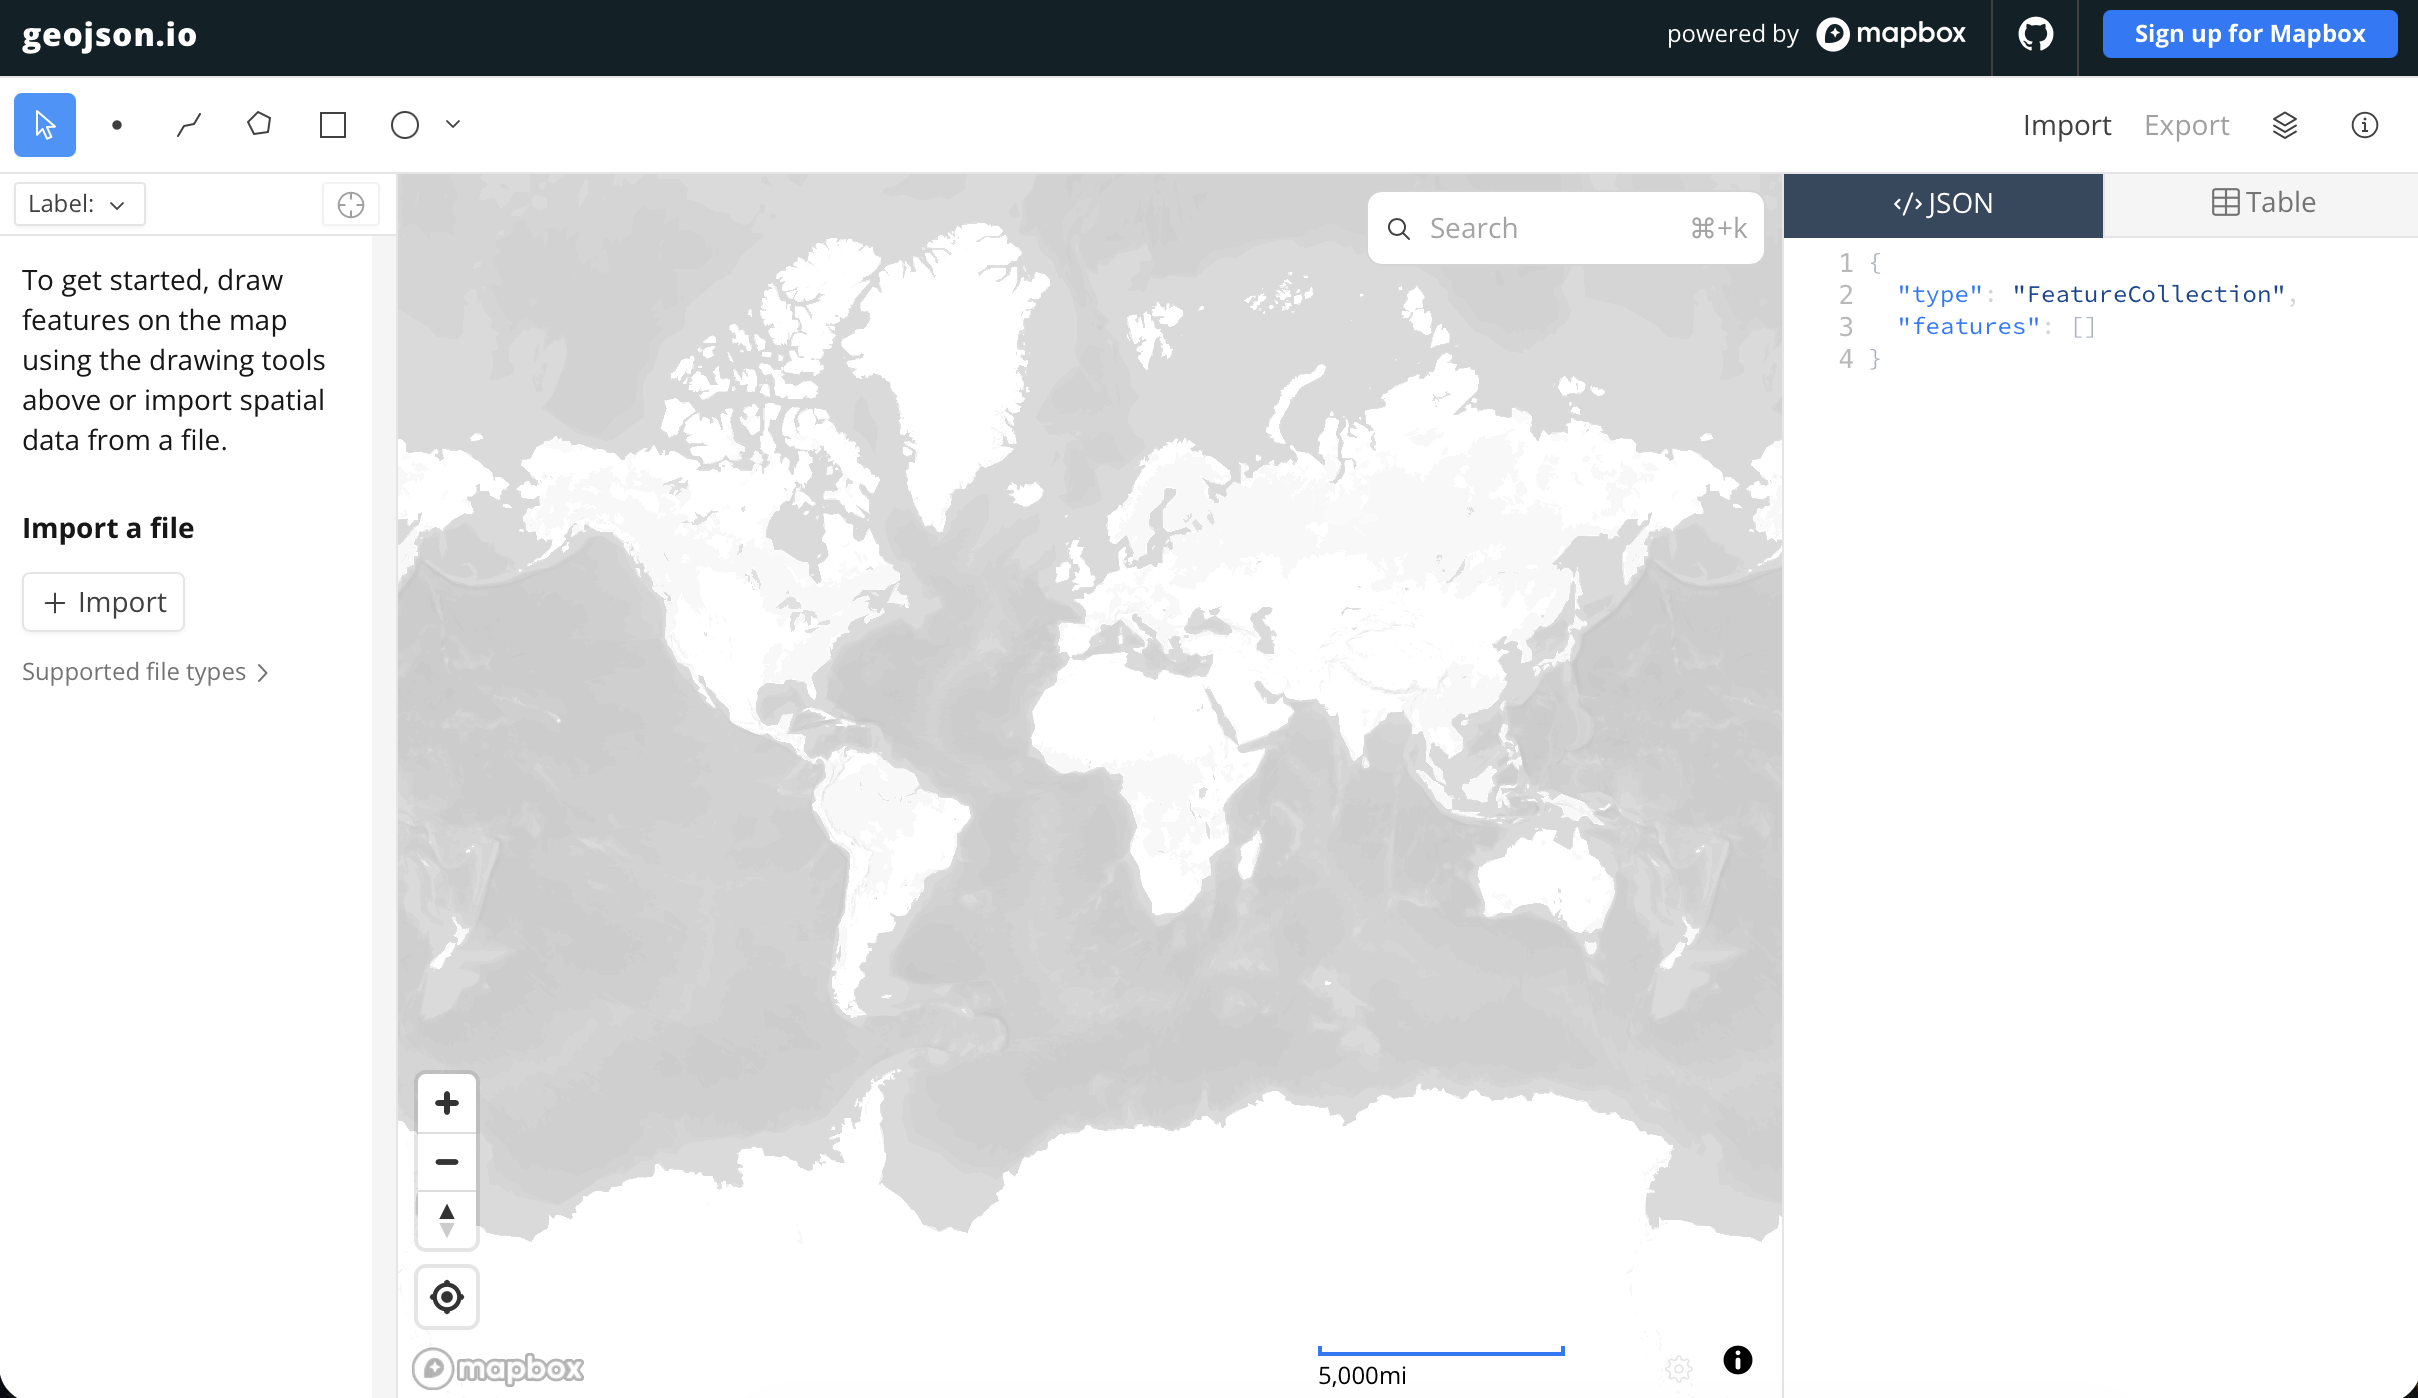
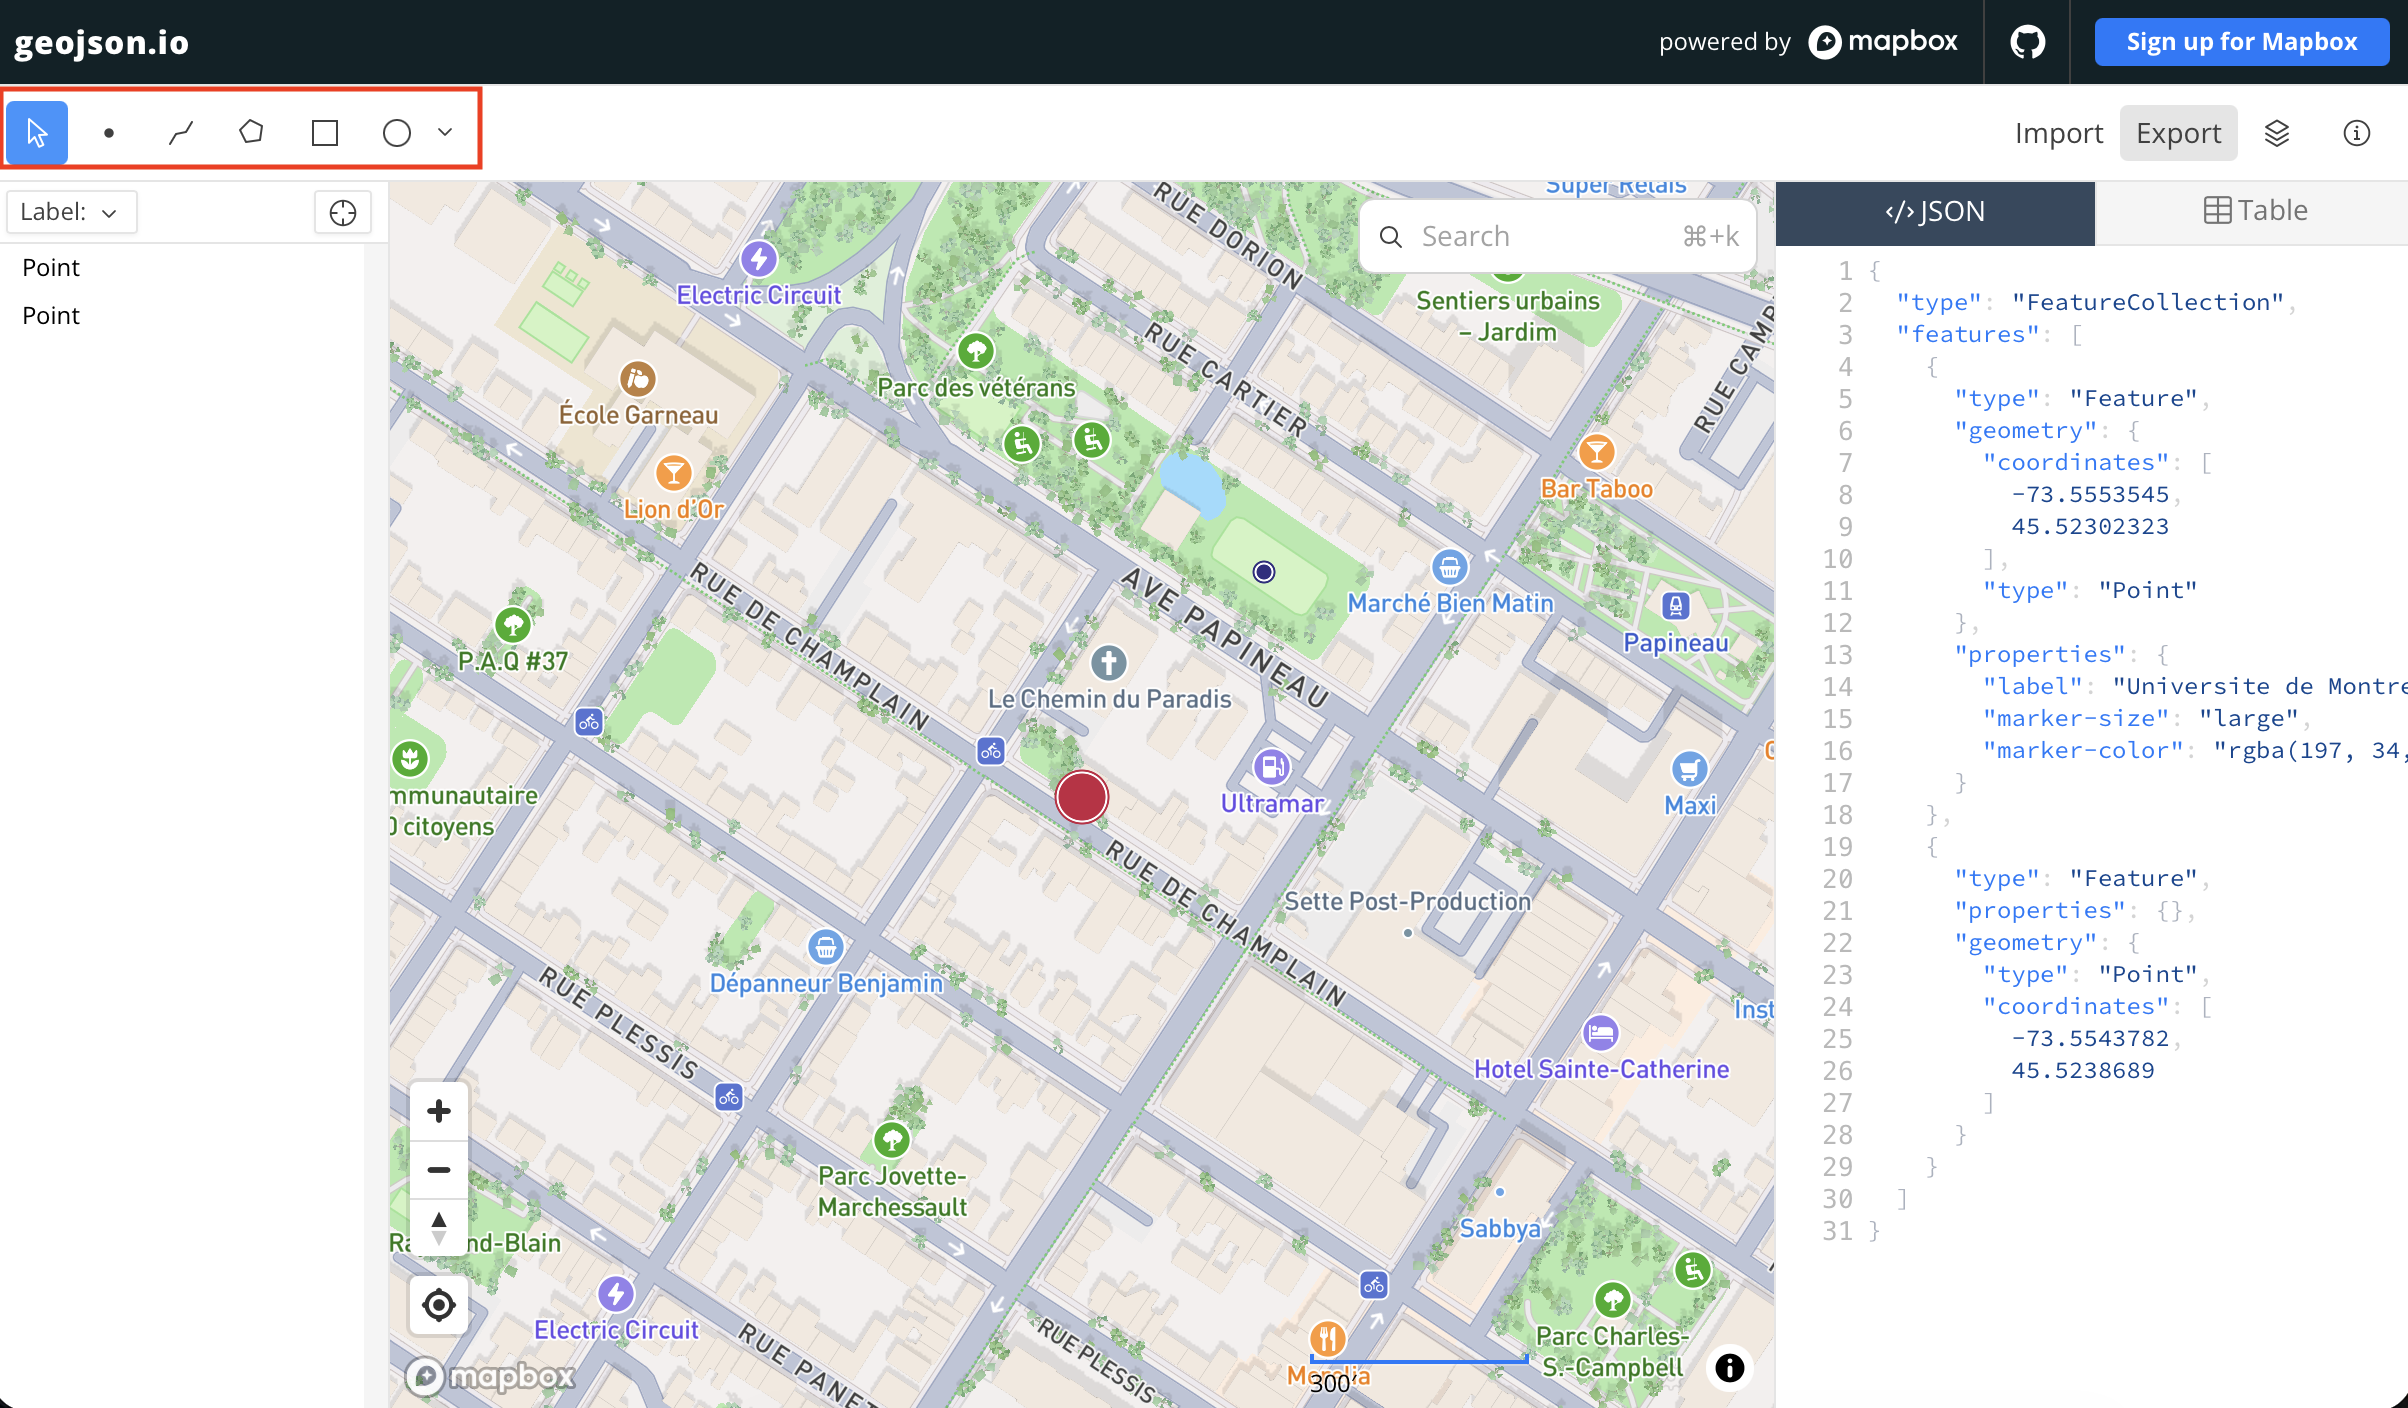
2 You can adjust the Basemap from the top right-hand corner. 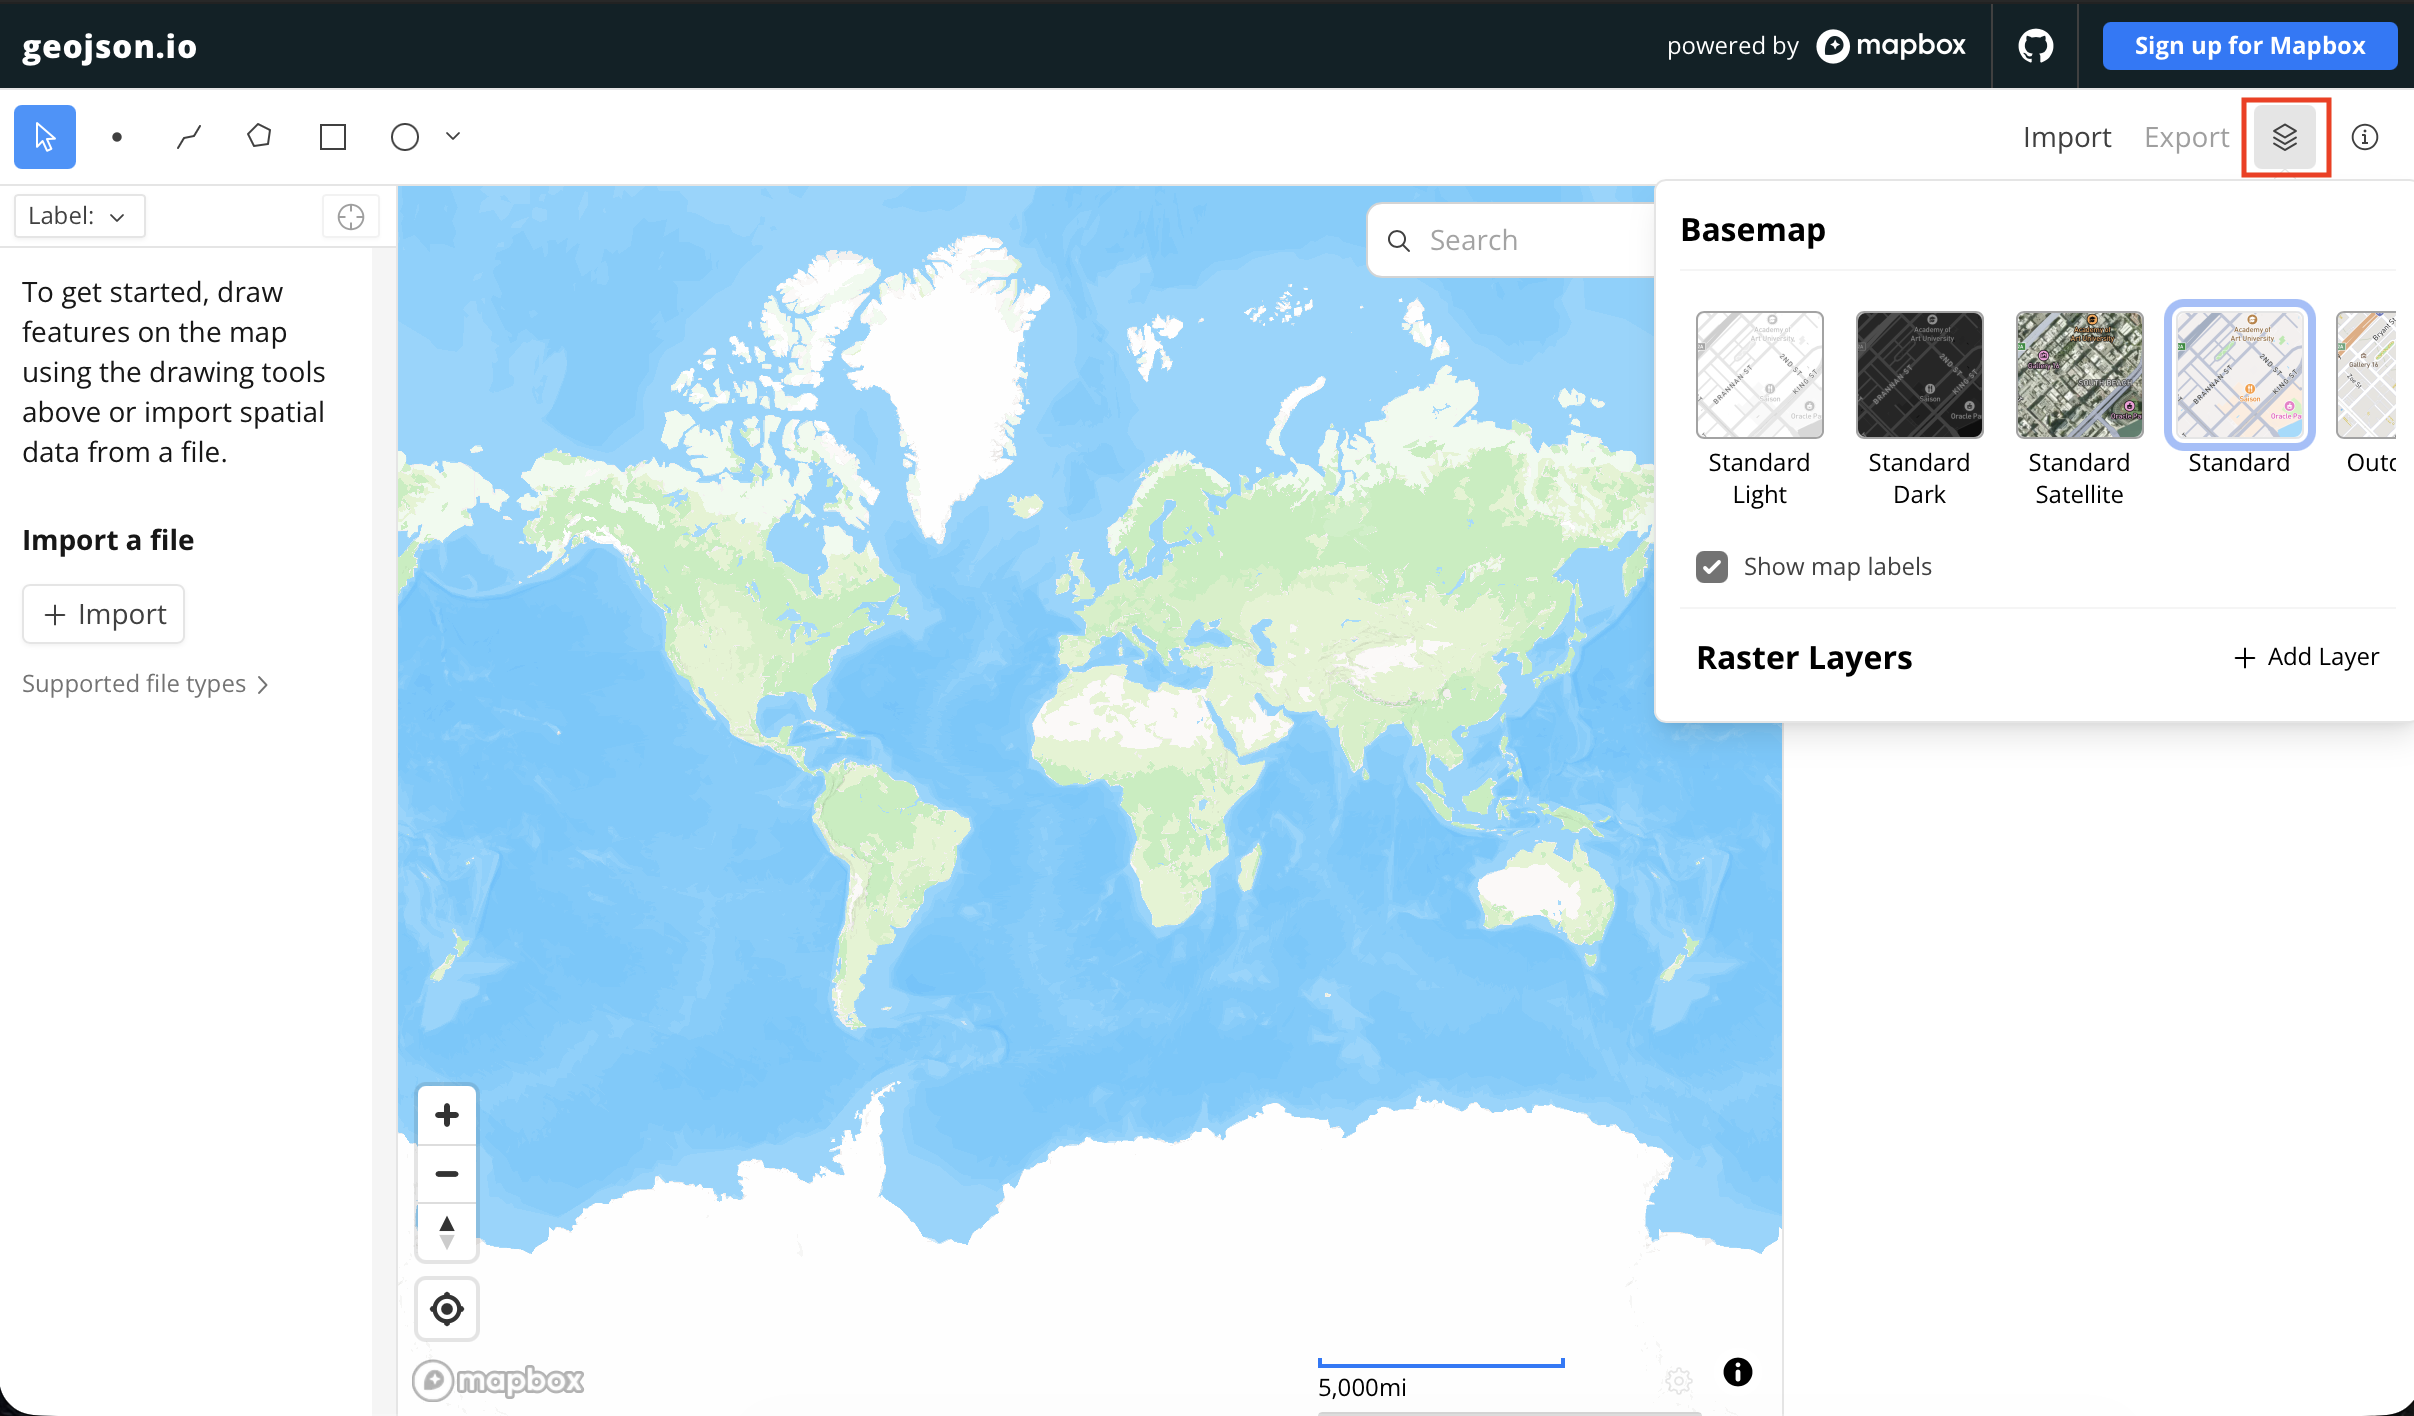
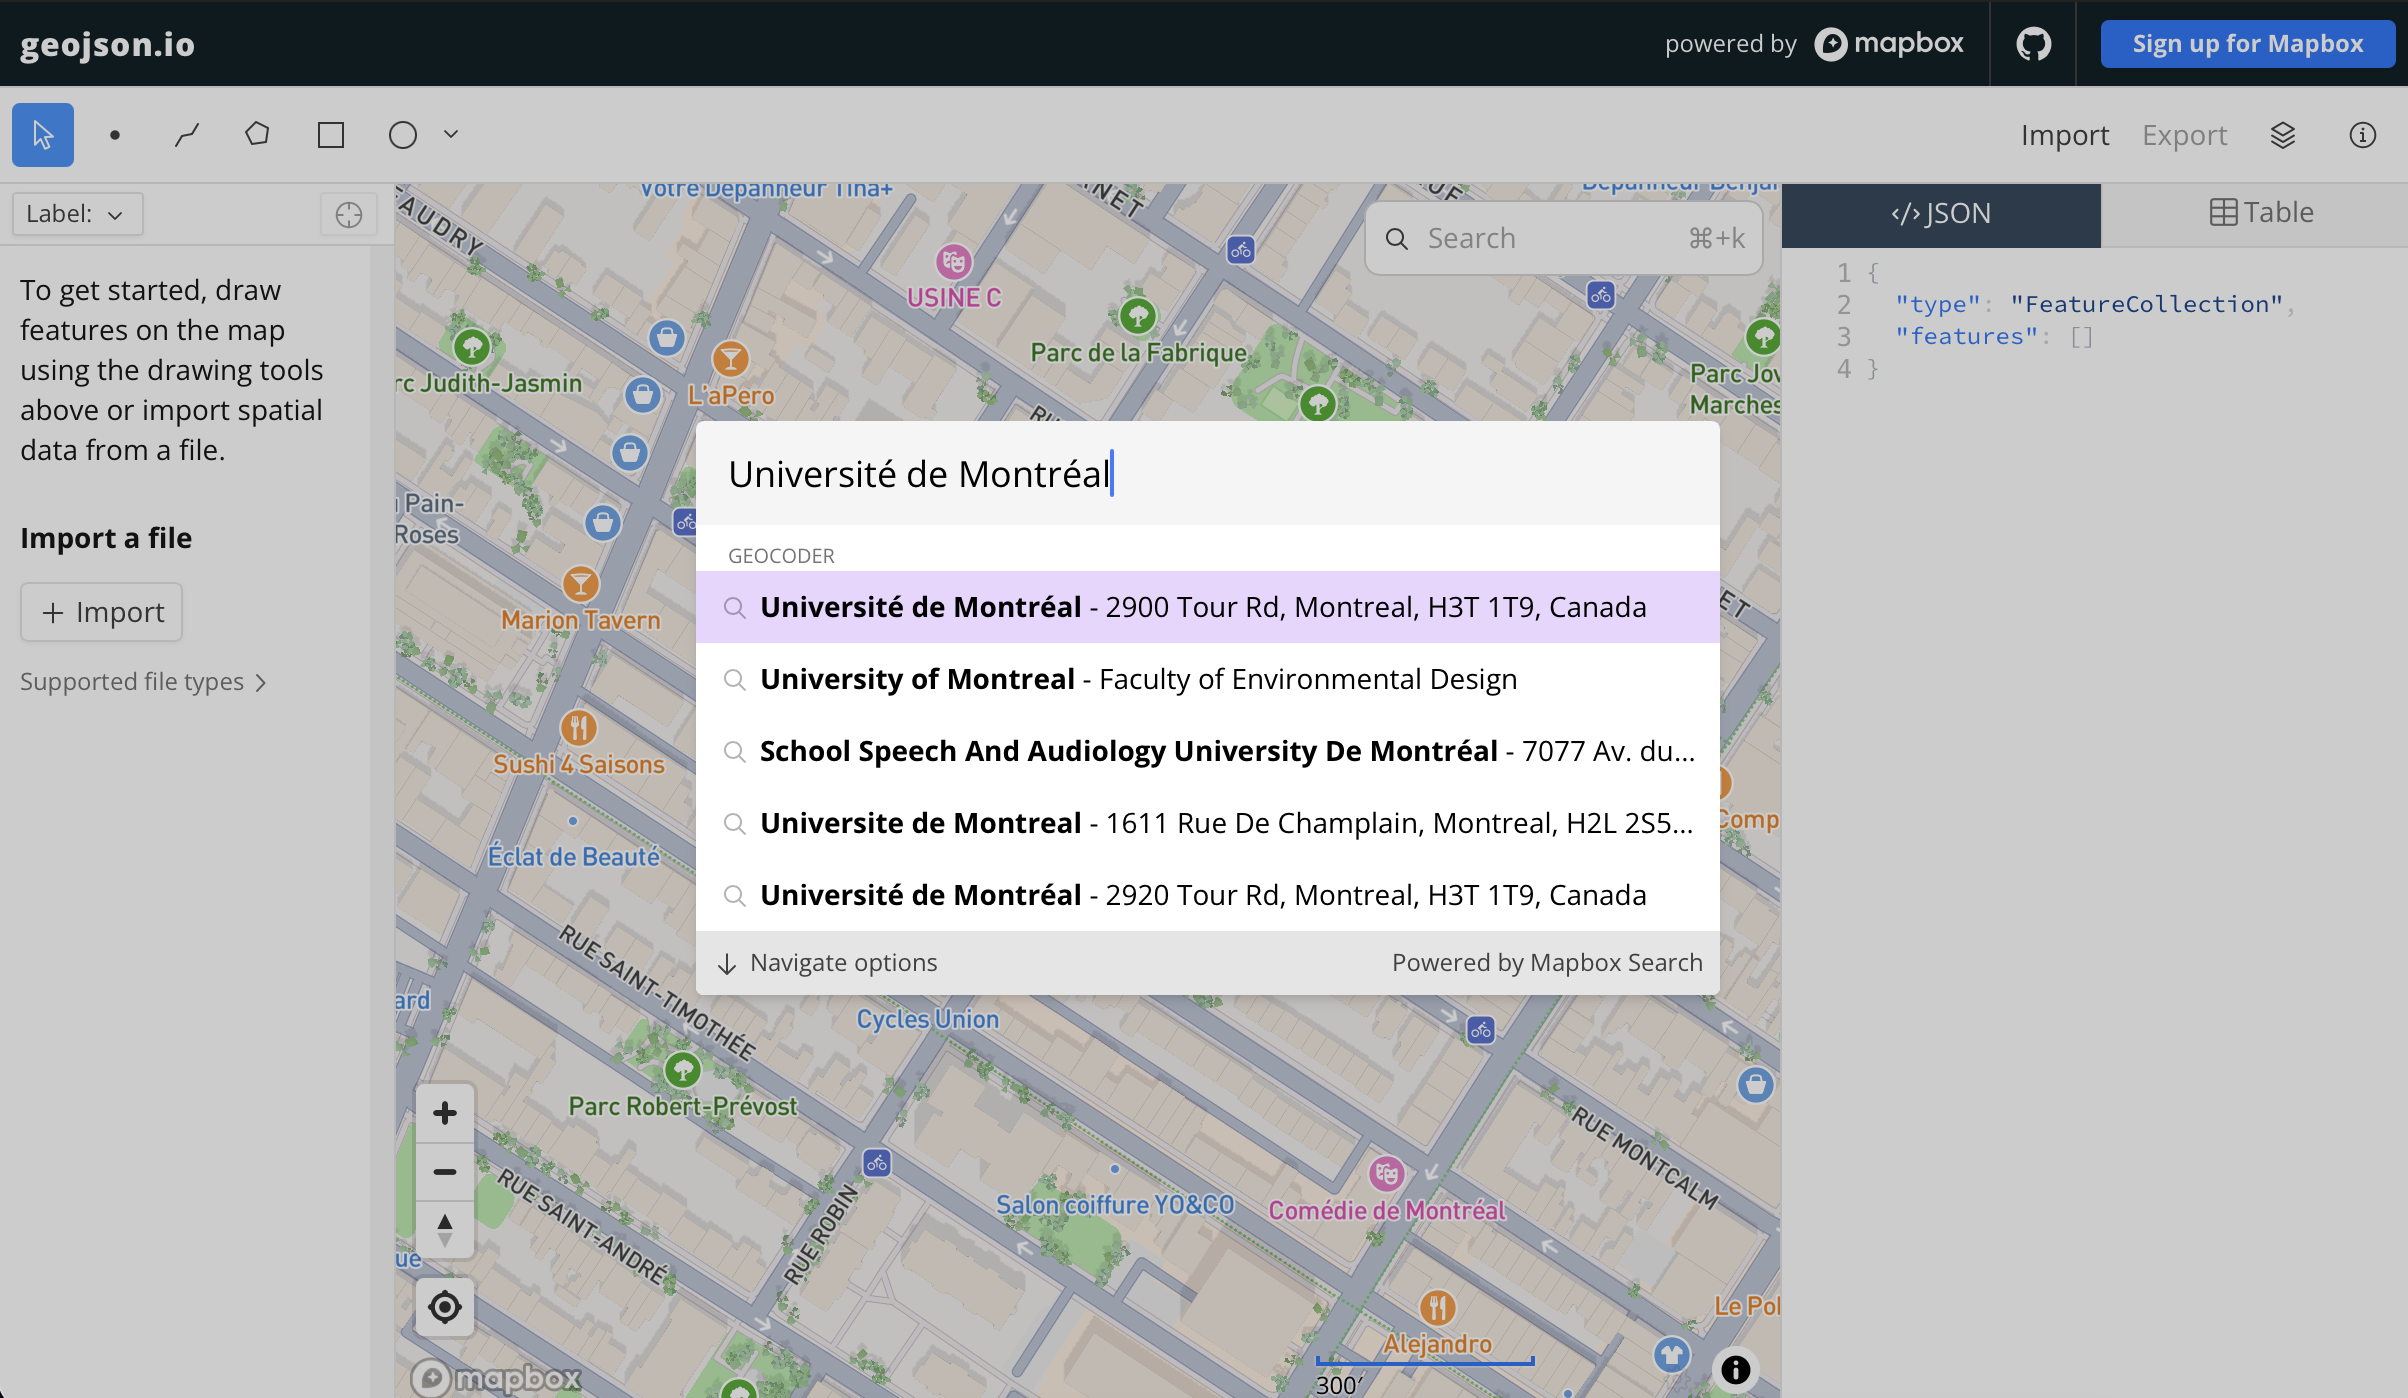
3 Now, you can add points/lines/polygons either by searching places up, or zooming to known areas and simply tracing on top of the map.
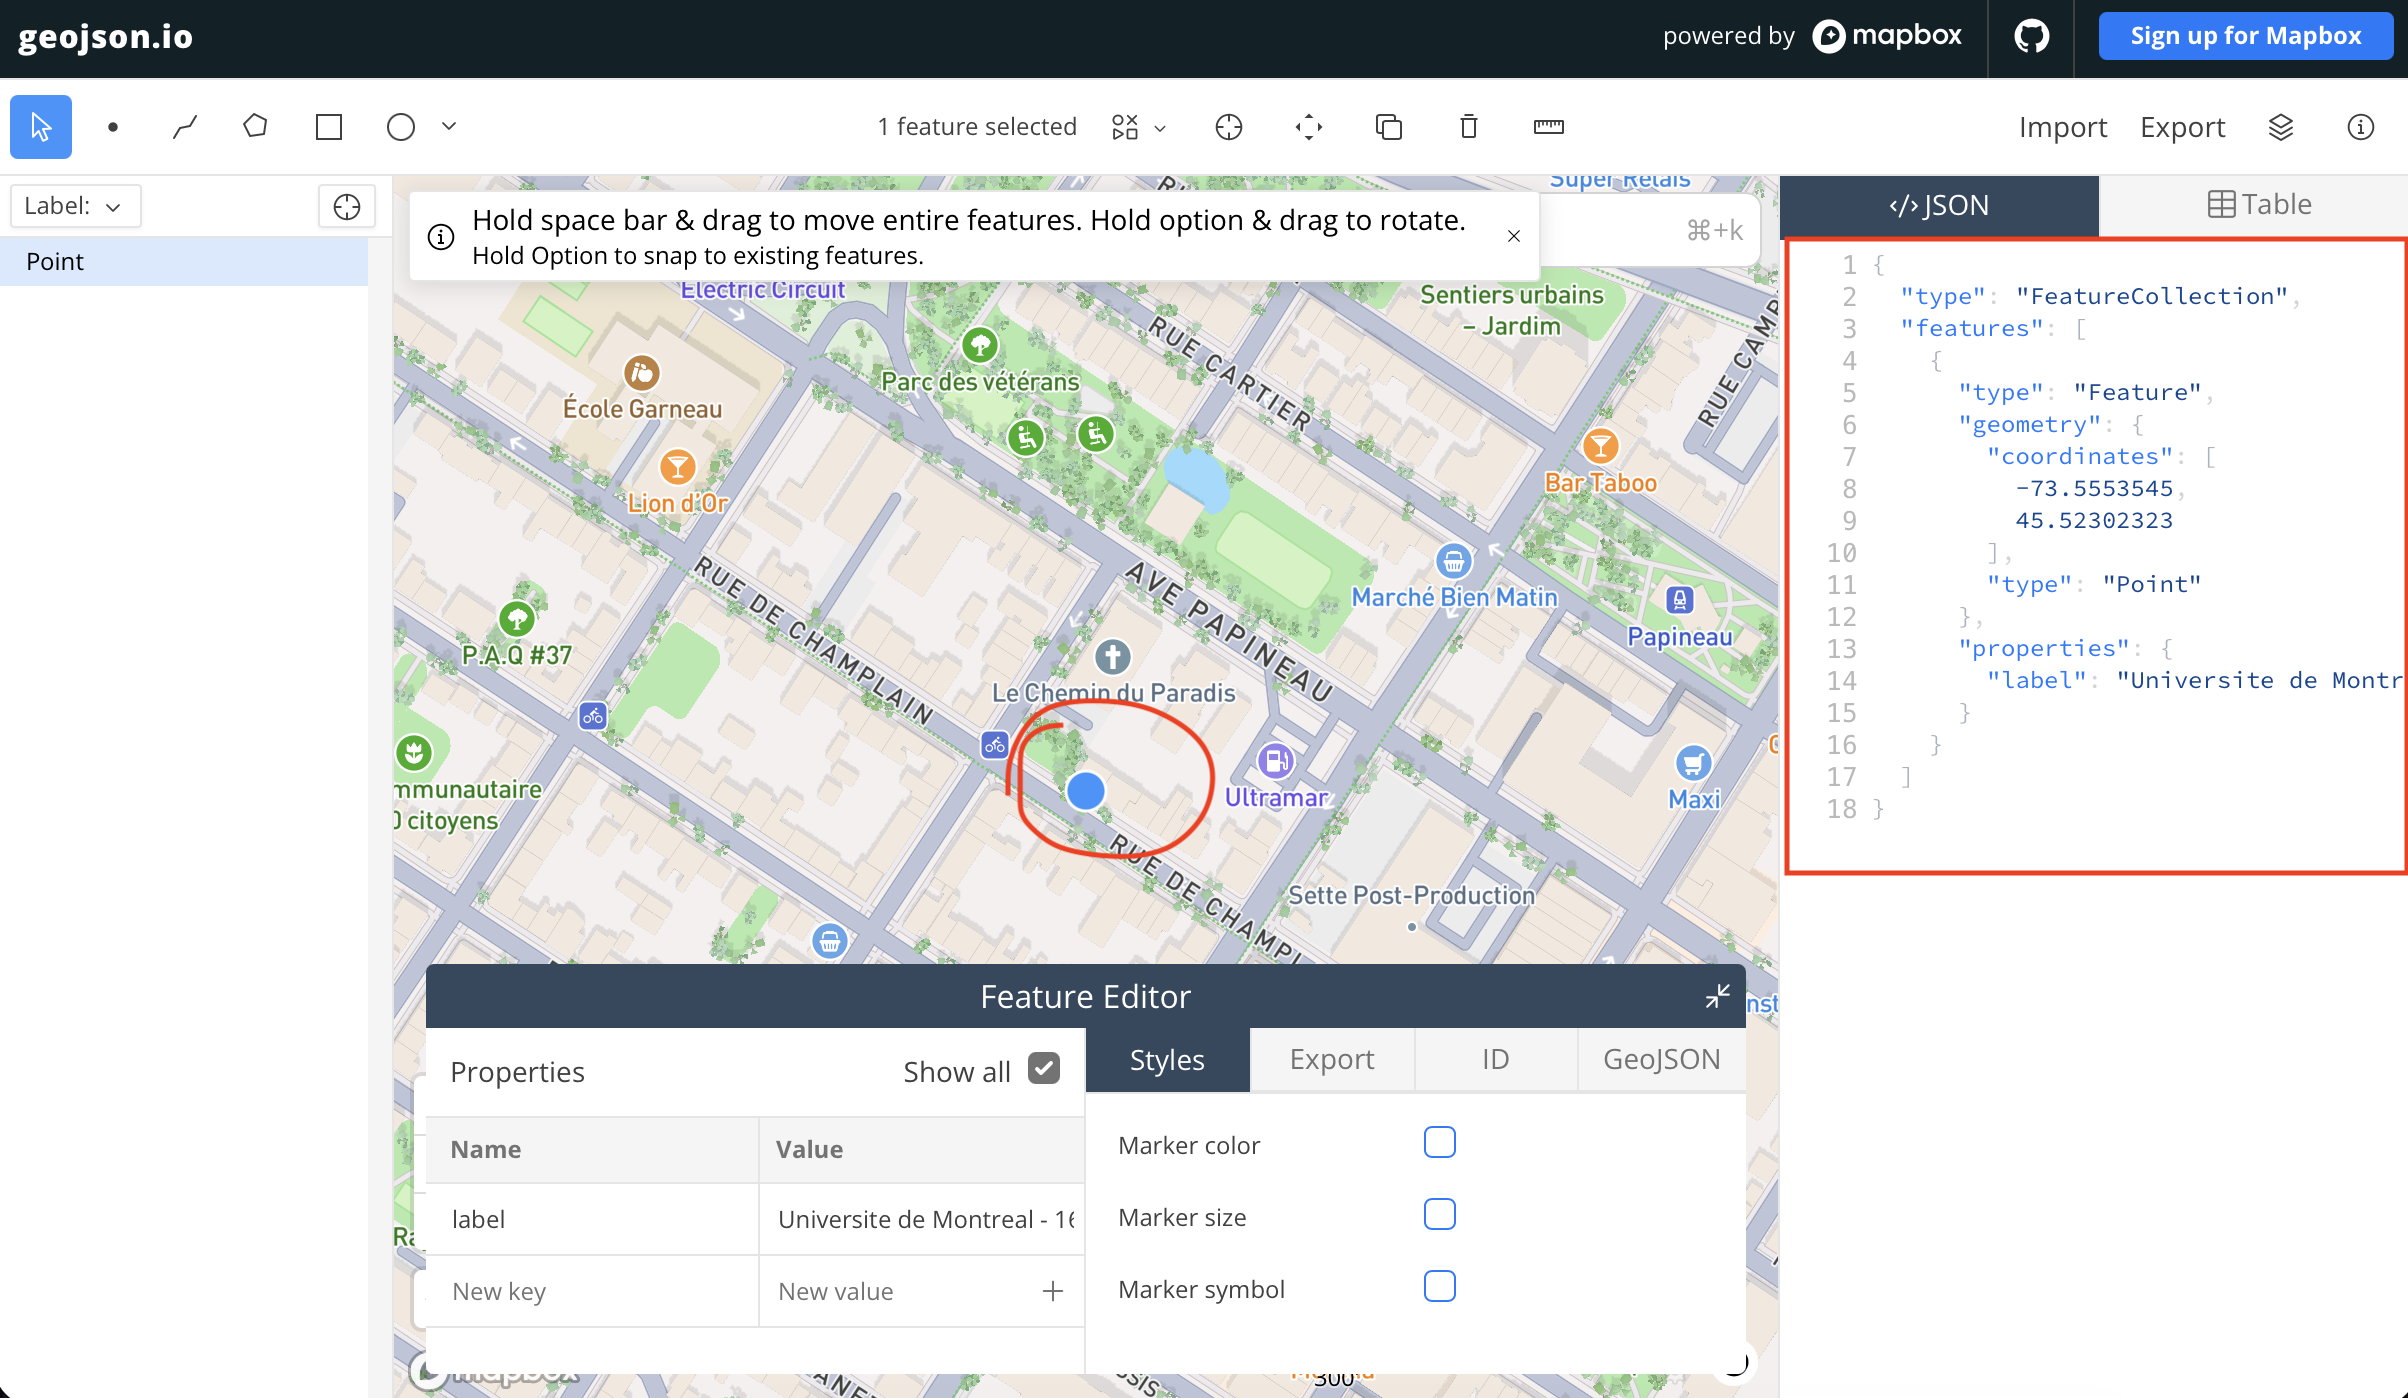
- Let’s firs try adding a point over UdeM by searching it up. Simply type “Universite de Montreal” or “University of Montreal” in the search bar and the webmap should zoom to the desired location.
- Now click on the blue “Add to Map” button
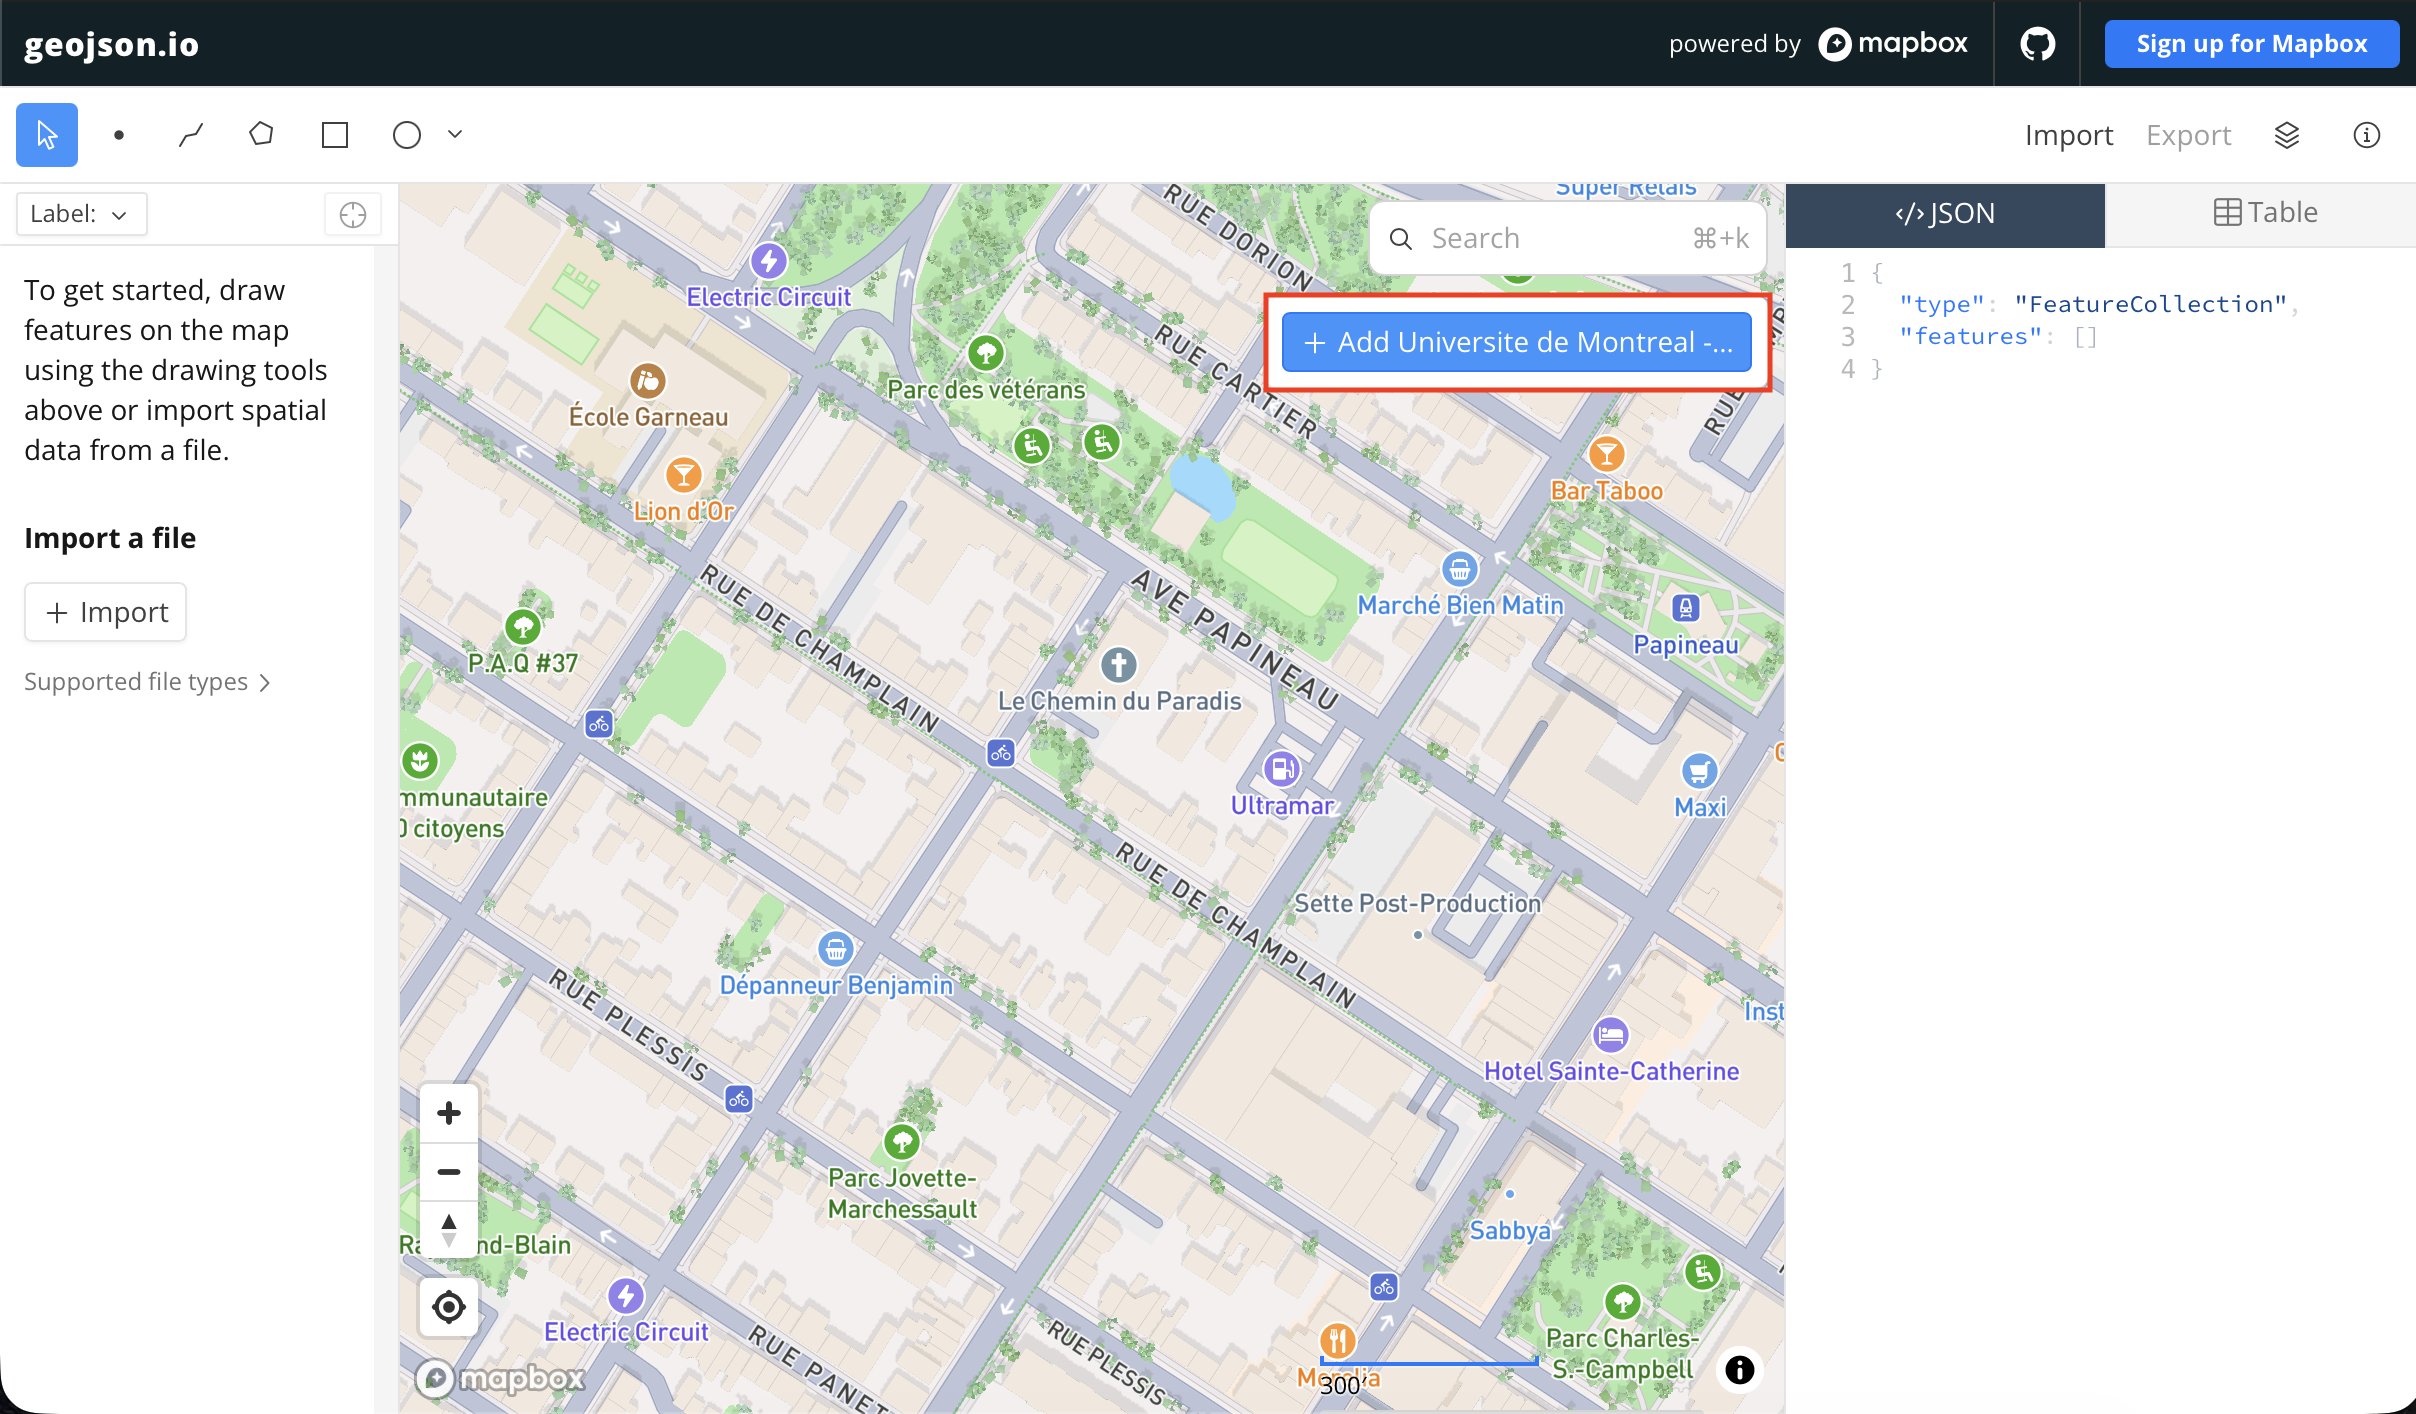
You’ll see now a point has been added to the map. Not only that, the geojson for the point is visible in the right-hand panel, and an editable table for the point data has been added to the bottom of your window.
4 You can also create a dataset of either points or lines or polygons by drawing directly onto the map.
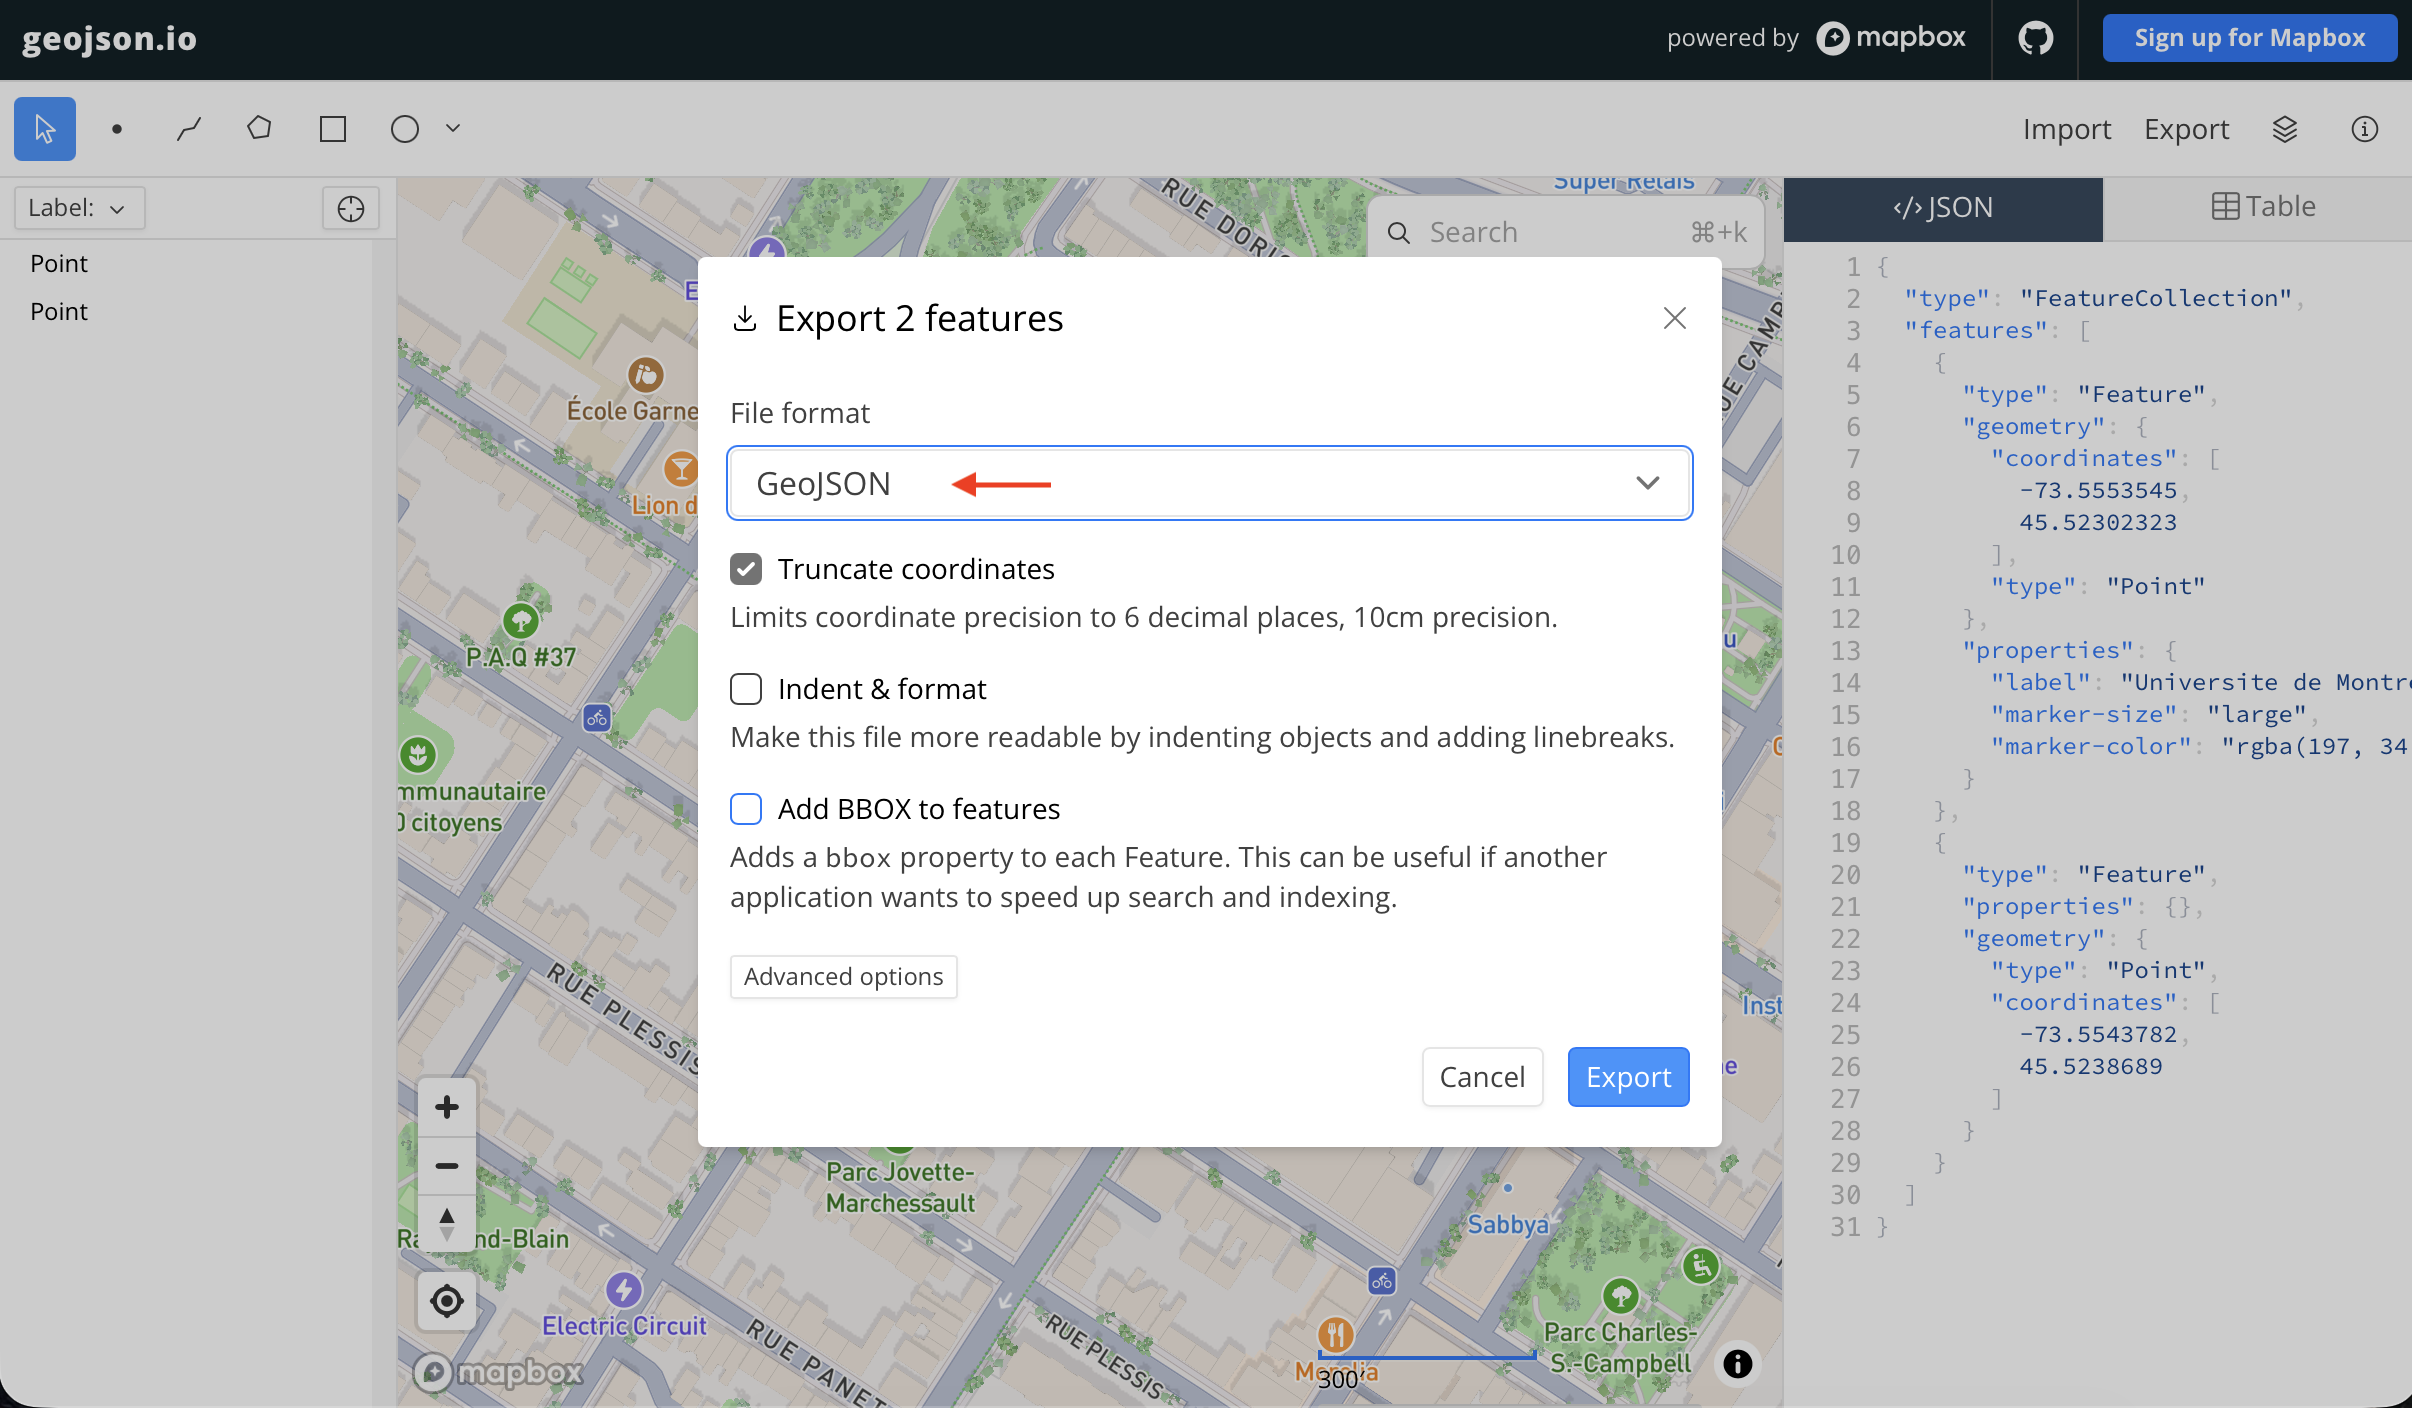
5 When you’re done, you can export your geojson as geojson or shapefile or csv or kml. as you’ll learn throughout the course, different platforms prefer — or even require — differently formatted data. not only is Geojson.io an easy way to create a small set of point, line, or polygon data, it is also a great tool to quickly change between formats once your data is spatialized.
Preparing spreadsheet data
Generally, for data to be spatial and therefore legible to the variety of tools and platforms we’ll introduce this week, it needs to include coordinates organized into two distinct columns: latitude and longitude.
If you’re beginning with data formatted in a spreadsheet, you’ll either have latent spatial information or none at all. By ‘latent spatial information’ we’re referring to columns that contain information such as place names, addresses, countries, cities, or even descriptive text detailing places, voyages, or otherwise spacetimes.
If no locational information is present whatsoever, can it be deduced? Do you know where each feature is or whether there are relevant locations associated with each feature? If so, great! If not, perhaps your data simply isn’t spatial.
If latent spatial information is present, you’ll need to turn it into coordinates. Depending on the number of features in your dataset, this might be more or less time consuming. If there are only a handful of features and your goal is to plot these as points, you can simply use a different platform to match the location mentioned to an exact coordinate point, then copy and paste that into your spreadsheet (remembering to give latitude and longitude separate columns).
- When preparing latent spatial data like addresses, make sure to make a separate column for each component (i.e. number, street name, postal code). This will make your life easier as you can then assign the appropriate data type to each column to perform spatial analyses later on (text, integer). When preparing data, try to assign these data format within your spreadsheet as well. It’s possible to modify them within QGIS but it takes a bit more effort.
- If you are using historic data, make sure to also try and include the associated contemporary place names; this will be necessary if you want to do any geocoding!
You can find alternate place names in geographic databases, toponymic dictionaries or gazetteers. Below are some online options:
- World Historical Gazetteer
- Geonames.org
- Getty Thesaurus of Geographic Names Online
- Finding Places in Text with the World Historical Gazetteer tutorial by the Programming Historian
- Tutorial on Working with Named Places: How and Why to Build a Gazetteer by the Programming Historian
Using Google Maps to add coordinate points
One straightforward way to add coordinate points to your dataset is to use Google Maps. In Google Maps, you can either look up locations or turn on Satellite View to visually find them. Then, right-click on the map and click the coordinate pair that pops up to copy it to your clipboard. You can then paste these coordinates into your spreadsheet (remembering to give latitude and longitude separate columns).
One important thing to consider, however, is where on the map points are depends on the coordinate reference system in which these points are created and stored. That is, the coordinate pair representing the precise location of your accommodations here in Montreal as viewed in Google Maps might be meters or kilometers away if uploaded to a map whose coordinate reference system was different from that of Google Maps. Coordinate points taken from Google Maps will be stored in WGS84.
Note that from the spreadsheet side, you can only add point data. If you want to trace georeferenced historical maps or create line/polygon features, either use Geojson.io introduced above, or work within QGIS to create shapefiles. The documentation to do this is included under Tools and Workflows, but will not be taught this week.
Geocoding
Geocoding is a process by which addresses are given coordinate locations, thus allowing them to be manipulated in a GIS. In other words, geocoding transforms tabular data into spatial data. Reverse Geocoding is when you begin with a set of geolocated points (coordinates) and use a tool to get the street addresses of each point. Geocoding is rarely completely accurate. You will need to double check your data and potentially make modifications.
You can geocode with QGIS, a free and open-source geographic information system (GIS) which will be introduced tomorrow. QGIS has several plugins you can use for geocoding:
- Easycoder allows you to select a CSV file, and then produces a layer with coordinate data that is loaded directly into your QGIS project.
- All Geocoders at Once includes 20 geocoding services (both free and those that require an API key). It requires you to have a layer added to your QGIS project to work from, and it will create a new layer with coordinate points. This means you may have to perform a spatial join to connect this coordinate data layer to your existing layer.
- Additionally, GeoCoding is another QGIS plugin specific to finding addresses or reverse geocoding.
- See UBC Library’s tutorial on geocoding and UCSC resource to geocoding for geocoding with QGIS.
You don’t need to geocode in a GIS! If you aren’t using a GIS for any other portion of your project, consider using an online geocoder like BC Address Geocoder or geocod.io, or explore more free and paid options here.
Resources for Data Collection and Preparation
- Terrastories, a tool by Awana Digital, is a great resource for collecting place-based data on the go.
- ArcGIS Survey 124 allows you to collect surveys with spatial information.
- Creating a new shapefiles in QGIS
- Considerations for downloading data
- Geocoding in QGIS
- Tutorial on Spreadsheet Skills from Hands-On Data Visualization by Jack Dougherty & Ilya Ilyankou
- Working with Spatial Data by Lincoln Mullen
Loading last updated date...