Gathering Data
This morning you will develop familiarity with the QGIS interface by making a reference map of historic public bath houses in Montréal. However, to give this dataset – put together by Alex Alisauskas — some context, we’ll need some more spatial data representing relevant geographic features: the city of Montréal, Canadian provinces, urban green spaces, and water features. We could add a lot more to this list, but for today, let’s keep it simple.
If you look inside the dhsi-workshop/Day2 folder you’ll see subfolders for both this morning and this afternoon. Inside dhsi-workshop/Day2/reference-mapping you’ll see one shapefile for the city of Montréal (remember, shapefiles have multiple “sidecar” files, so 1 shapefile might appear as a handful of files all named the same thing but with different extensions). This shapefile is a slightly edited version of the Administrative Boundaries of the urban agglomerations of Montreal file, provided by both the City of Montréal data portal and the Government of Canada. However, there are no other data provided (besides a backup-data folder in case).
Because in the real world data is seldom provided neatly packaged, we’ll begin this morning’s lesson by guiding you in downloading and synthesizing vector data from multiple online sources.
Montréal’s Historic Public Bath Houses
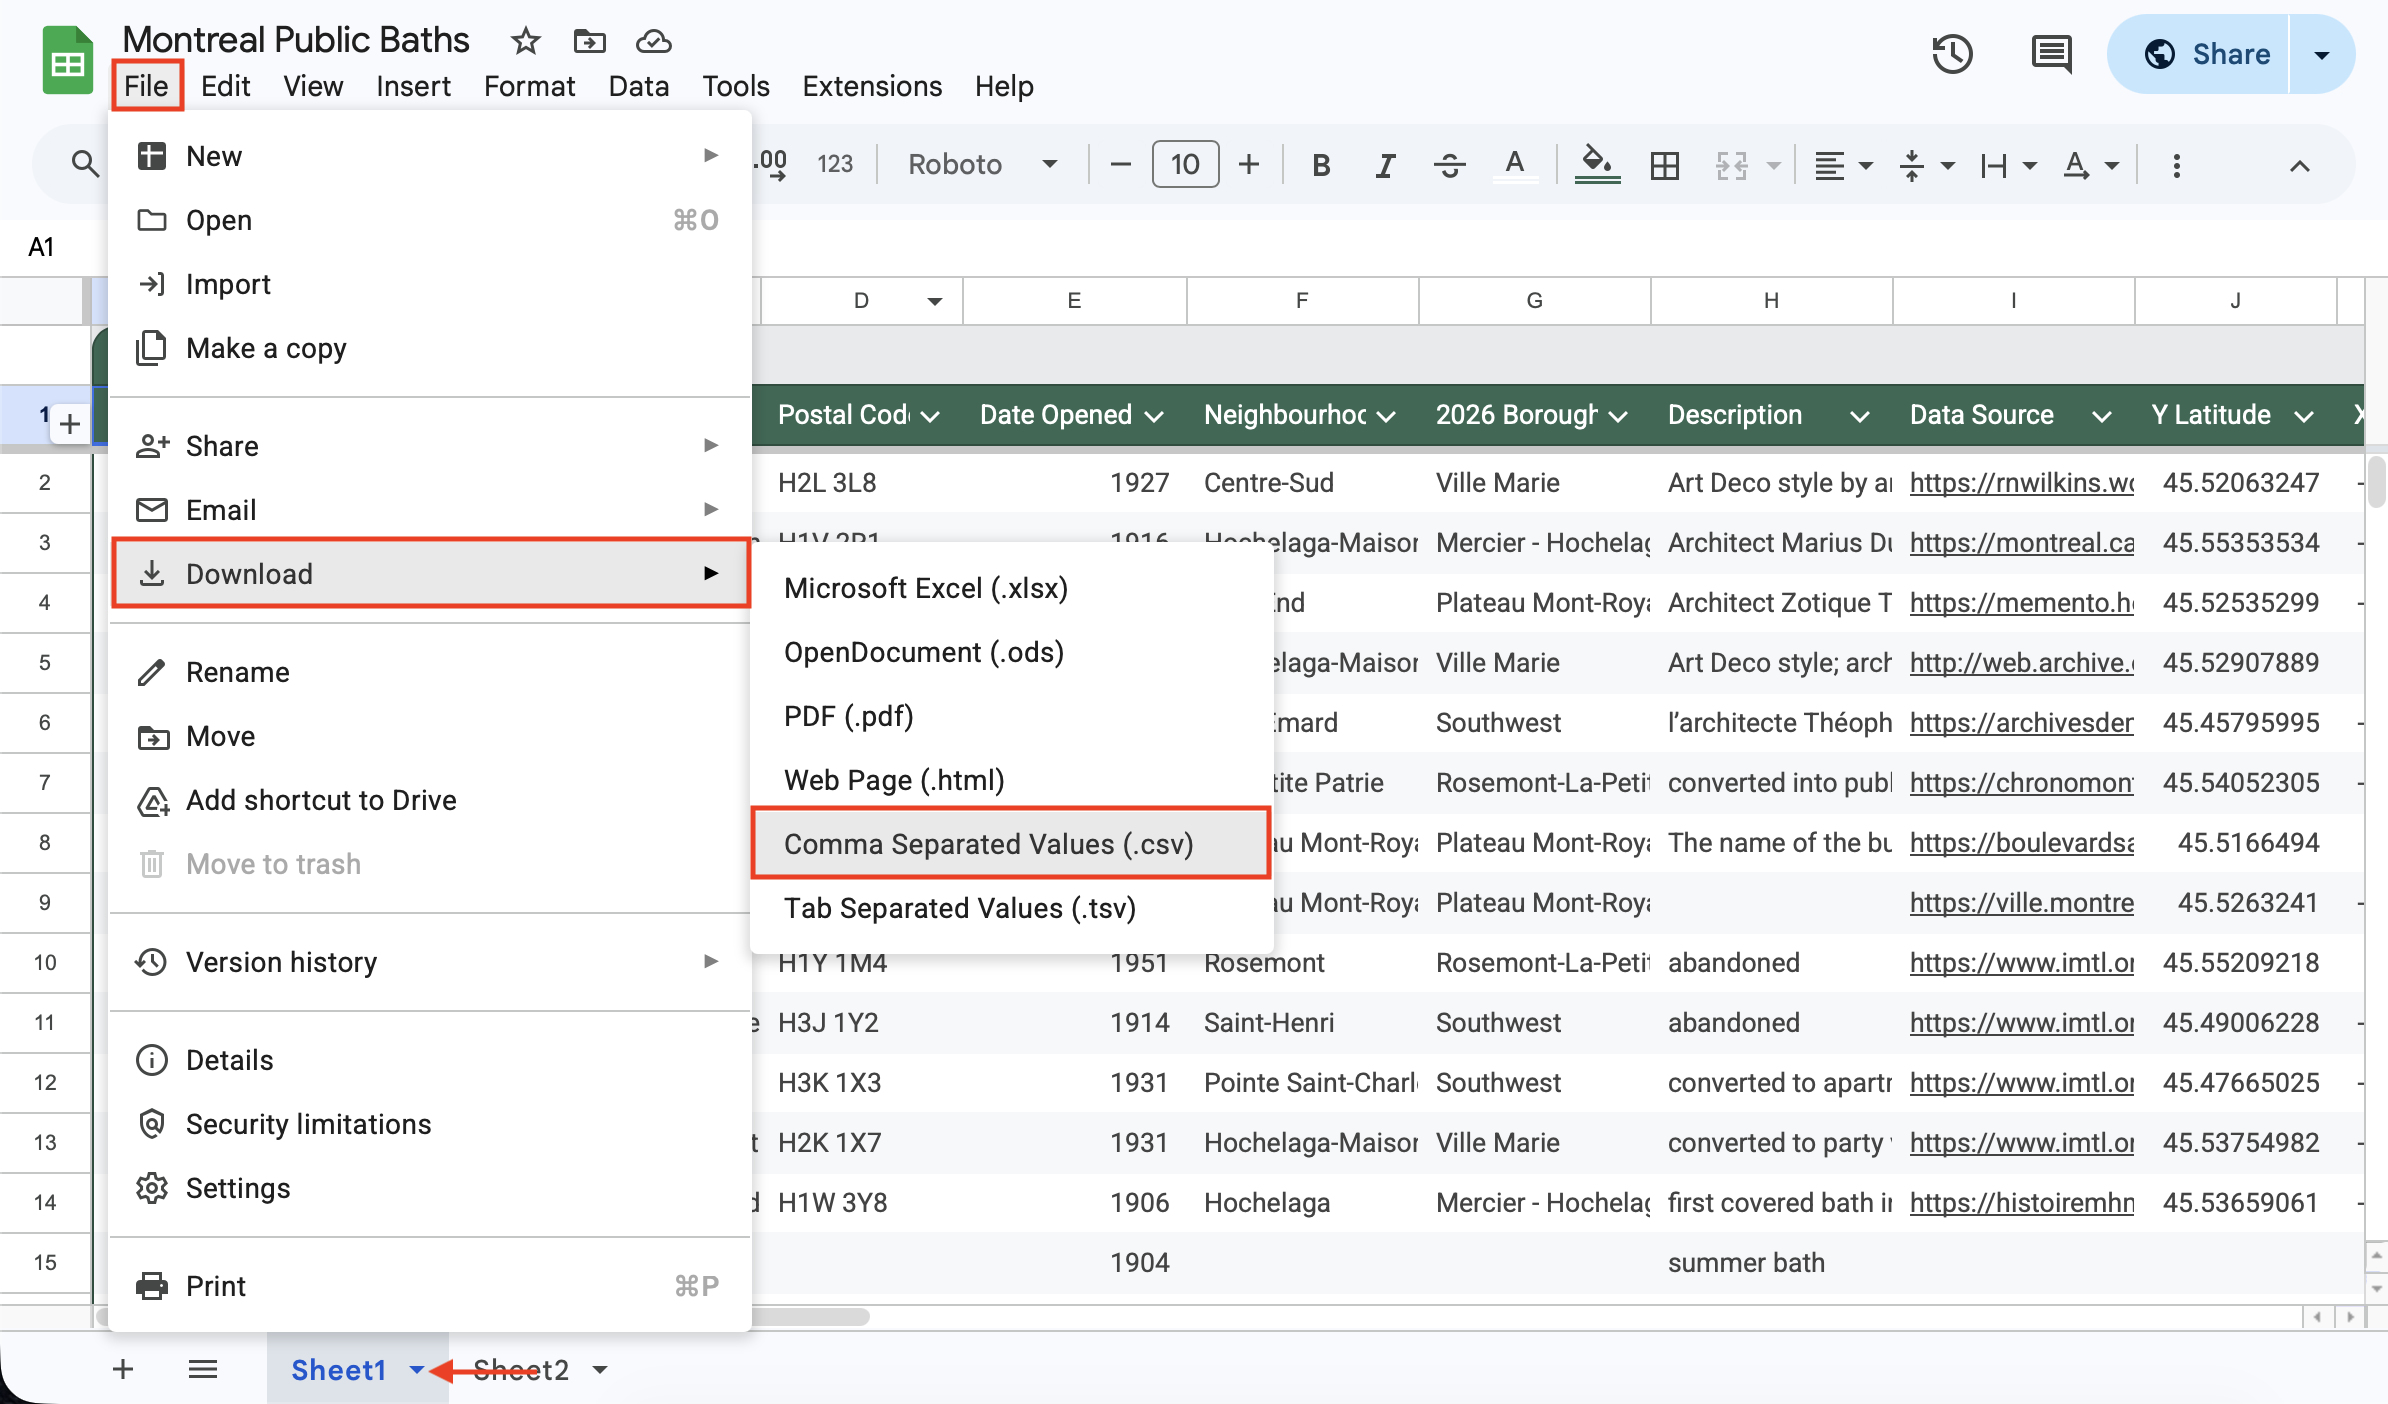
Our data layer will be Montréal’s Historic Public Bath Houses, a dataset created by Alex Alisauskas. Recalling yesterday’s discussion of vector data formatting, Alex will now introduce the dataset and explain her process and considerations for making it. Then, she will guide us in exporting it as a .csv file called public-baths.
Basemap Data
We will download the following shapefiles as contextual data:
- Provincial boundaries;
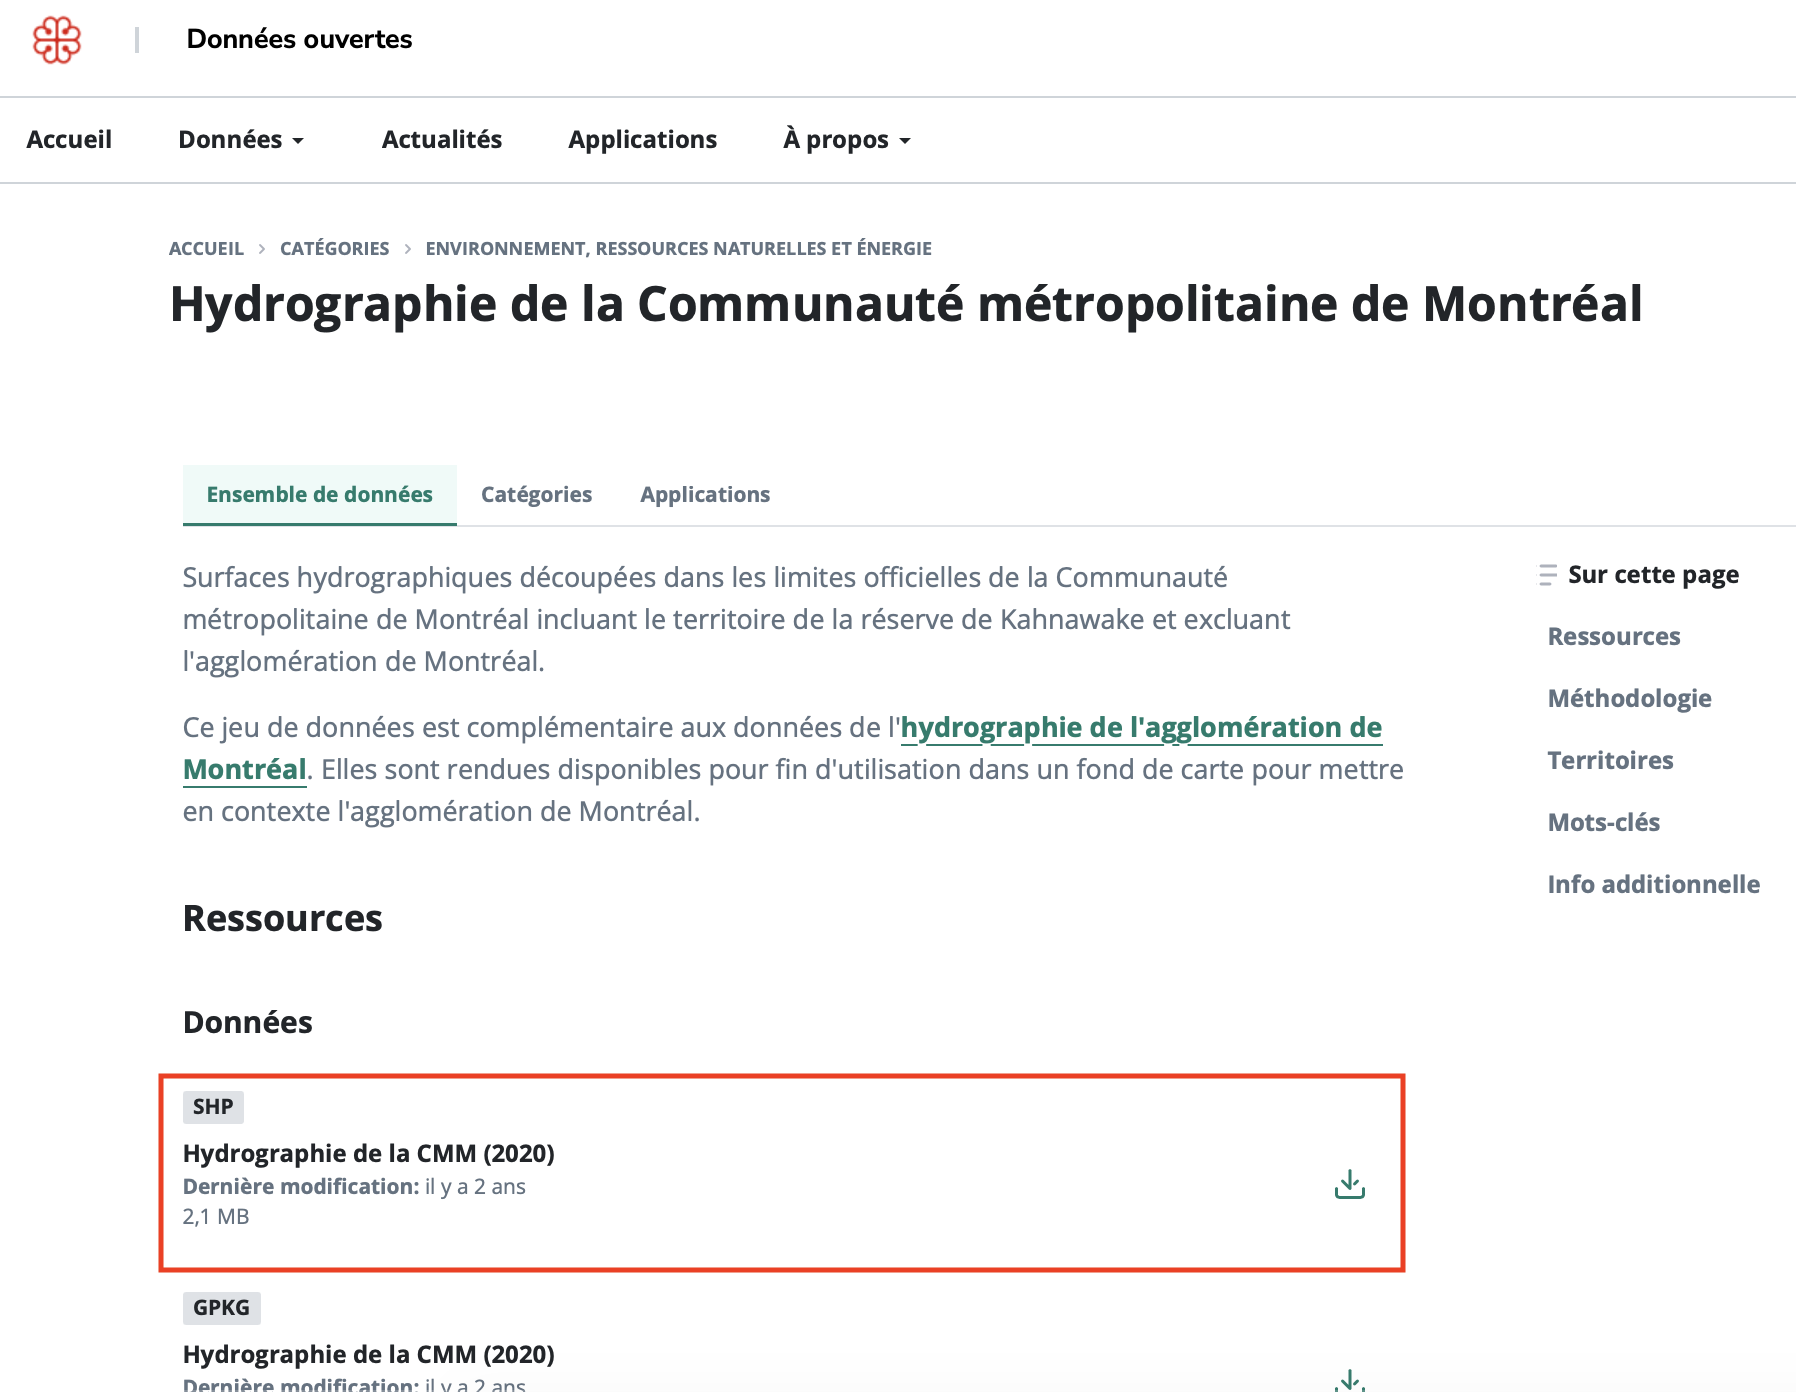
- Water features, both the Hydrography for Montréal agglomerations as well as Hydrography for the wider Montréal Metro Area; and
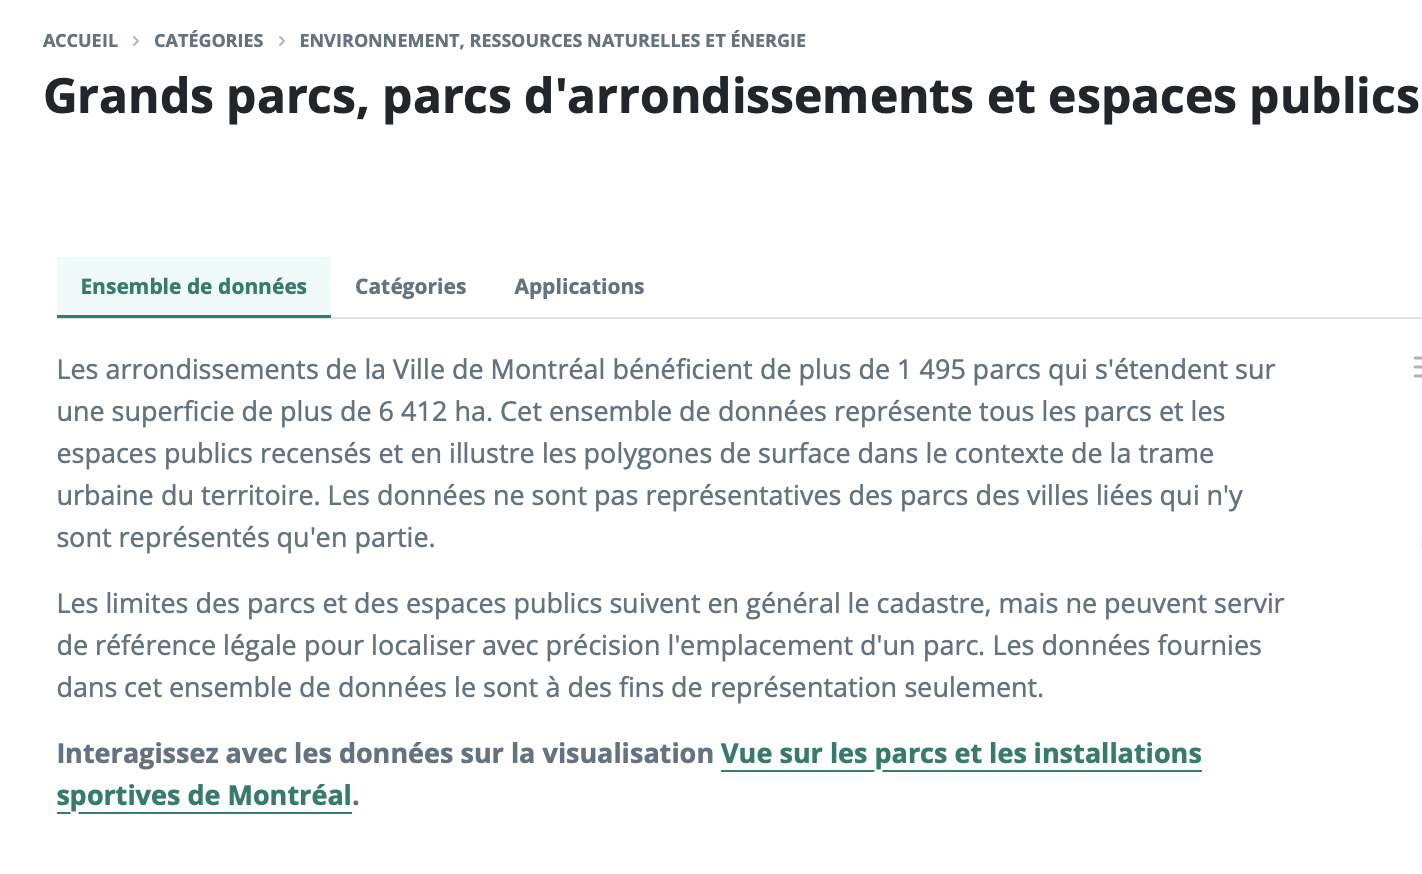
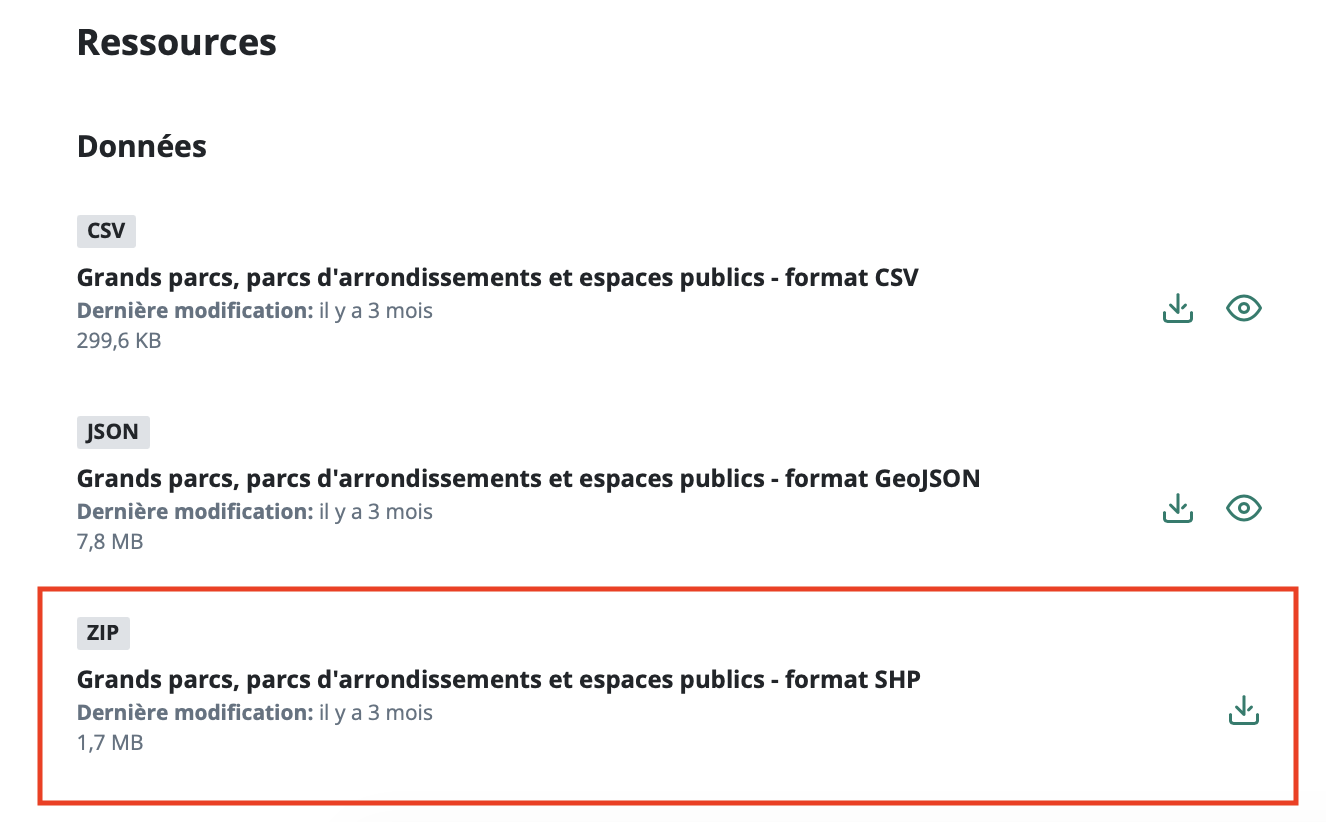
- Parks and Green Spaces
Move each dataset you download to dhsi-workshop/Day2/reference-mapping and, if it’s a zip file, unzip it there. You will notice very quickly the varying degrees of data management — for instance, provinces are named lpr_000b21a_e and green spaces are in a folder simply called shapefile. Keep this in mind when you create your own data or work on your own project.
If you have any trouble downloading the data, we’ve created a backup-data folder with all the necessary files zipped. Just be sure to unzip the files before trying to use them.
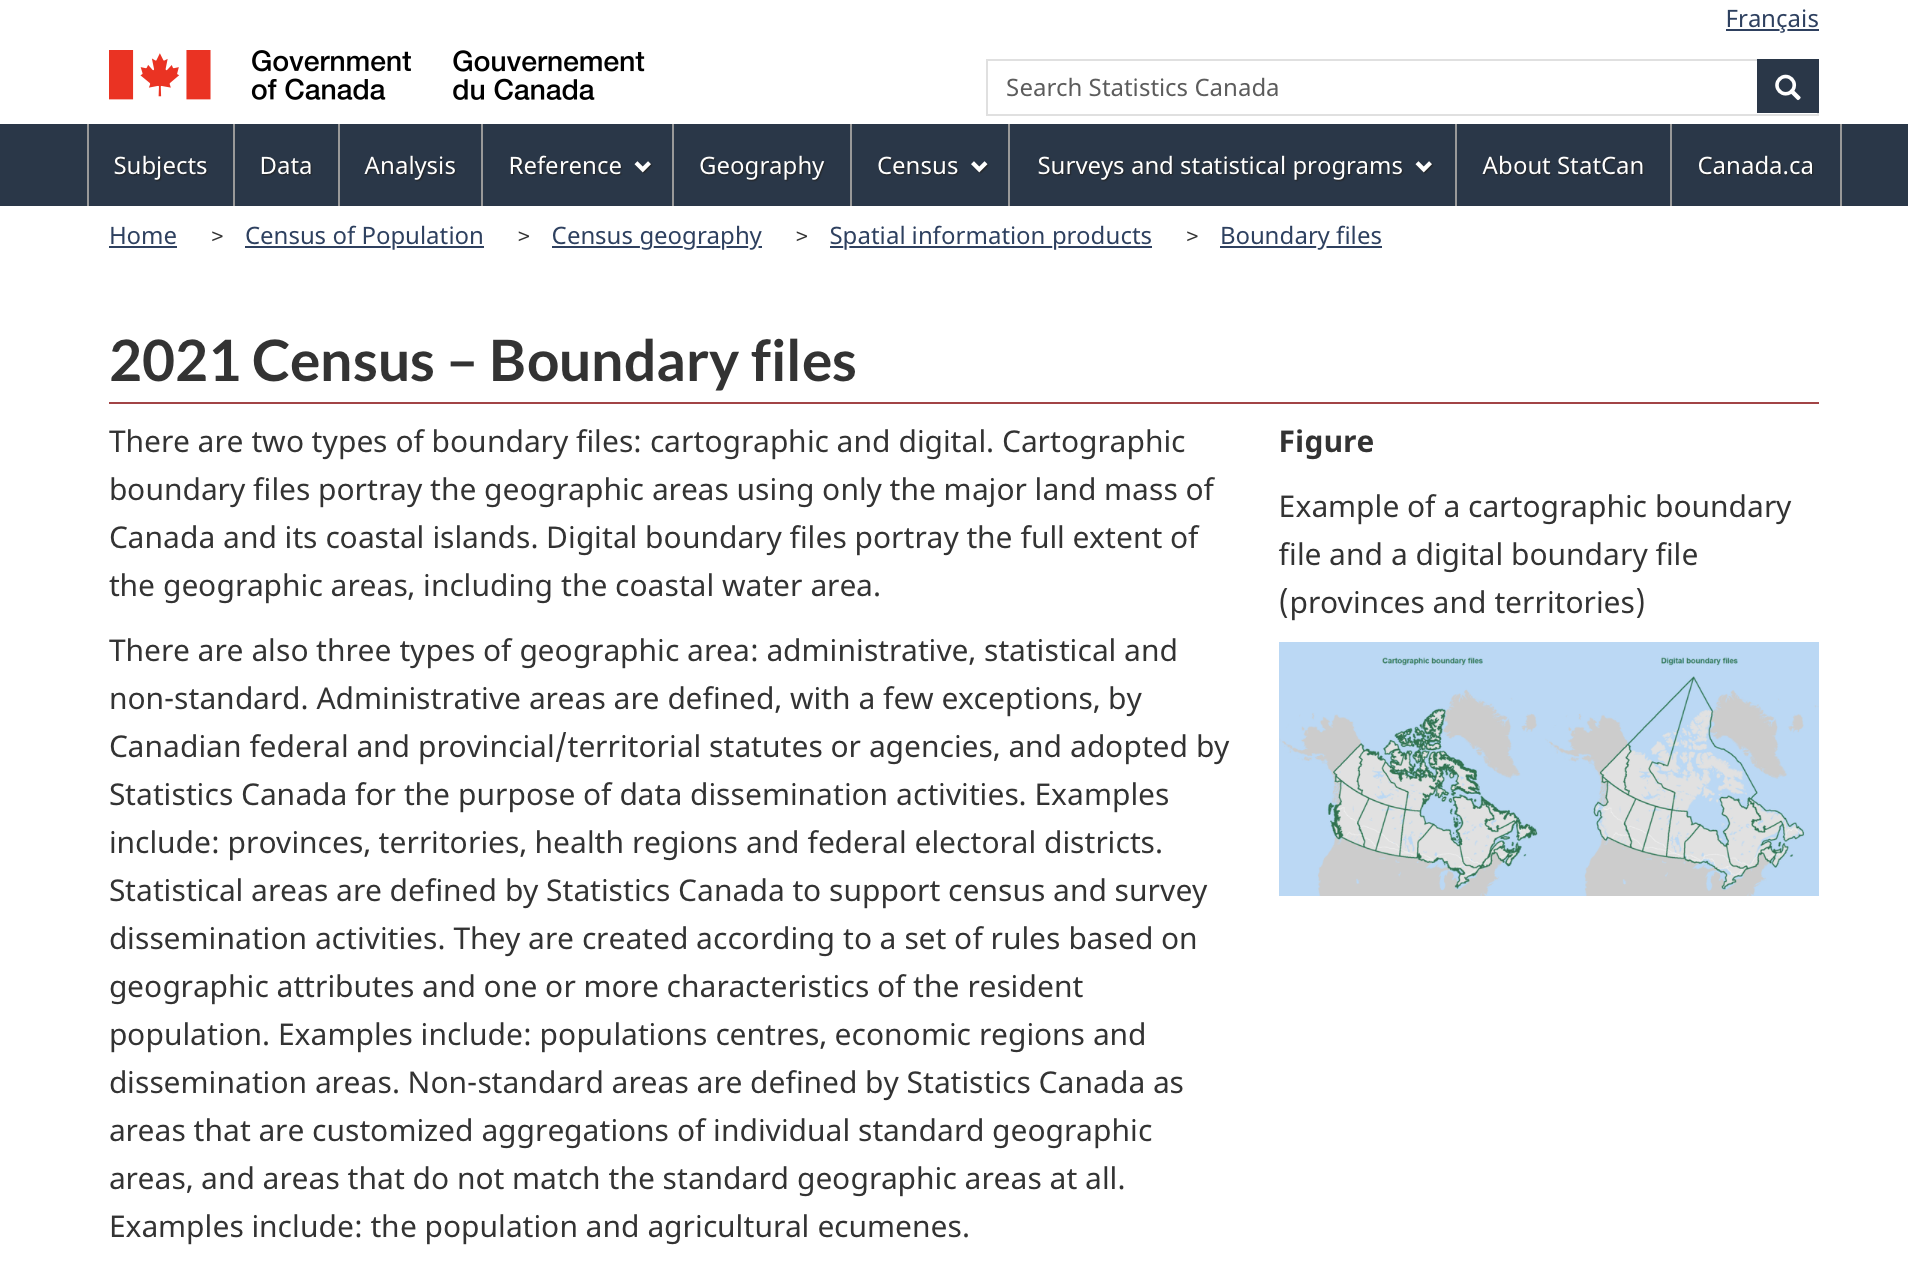
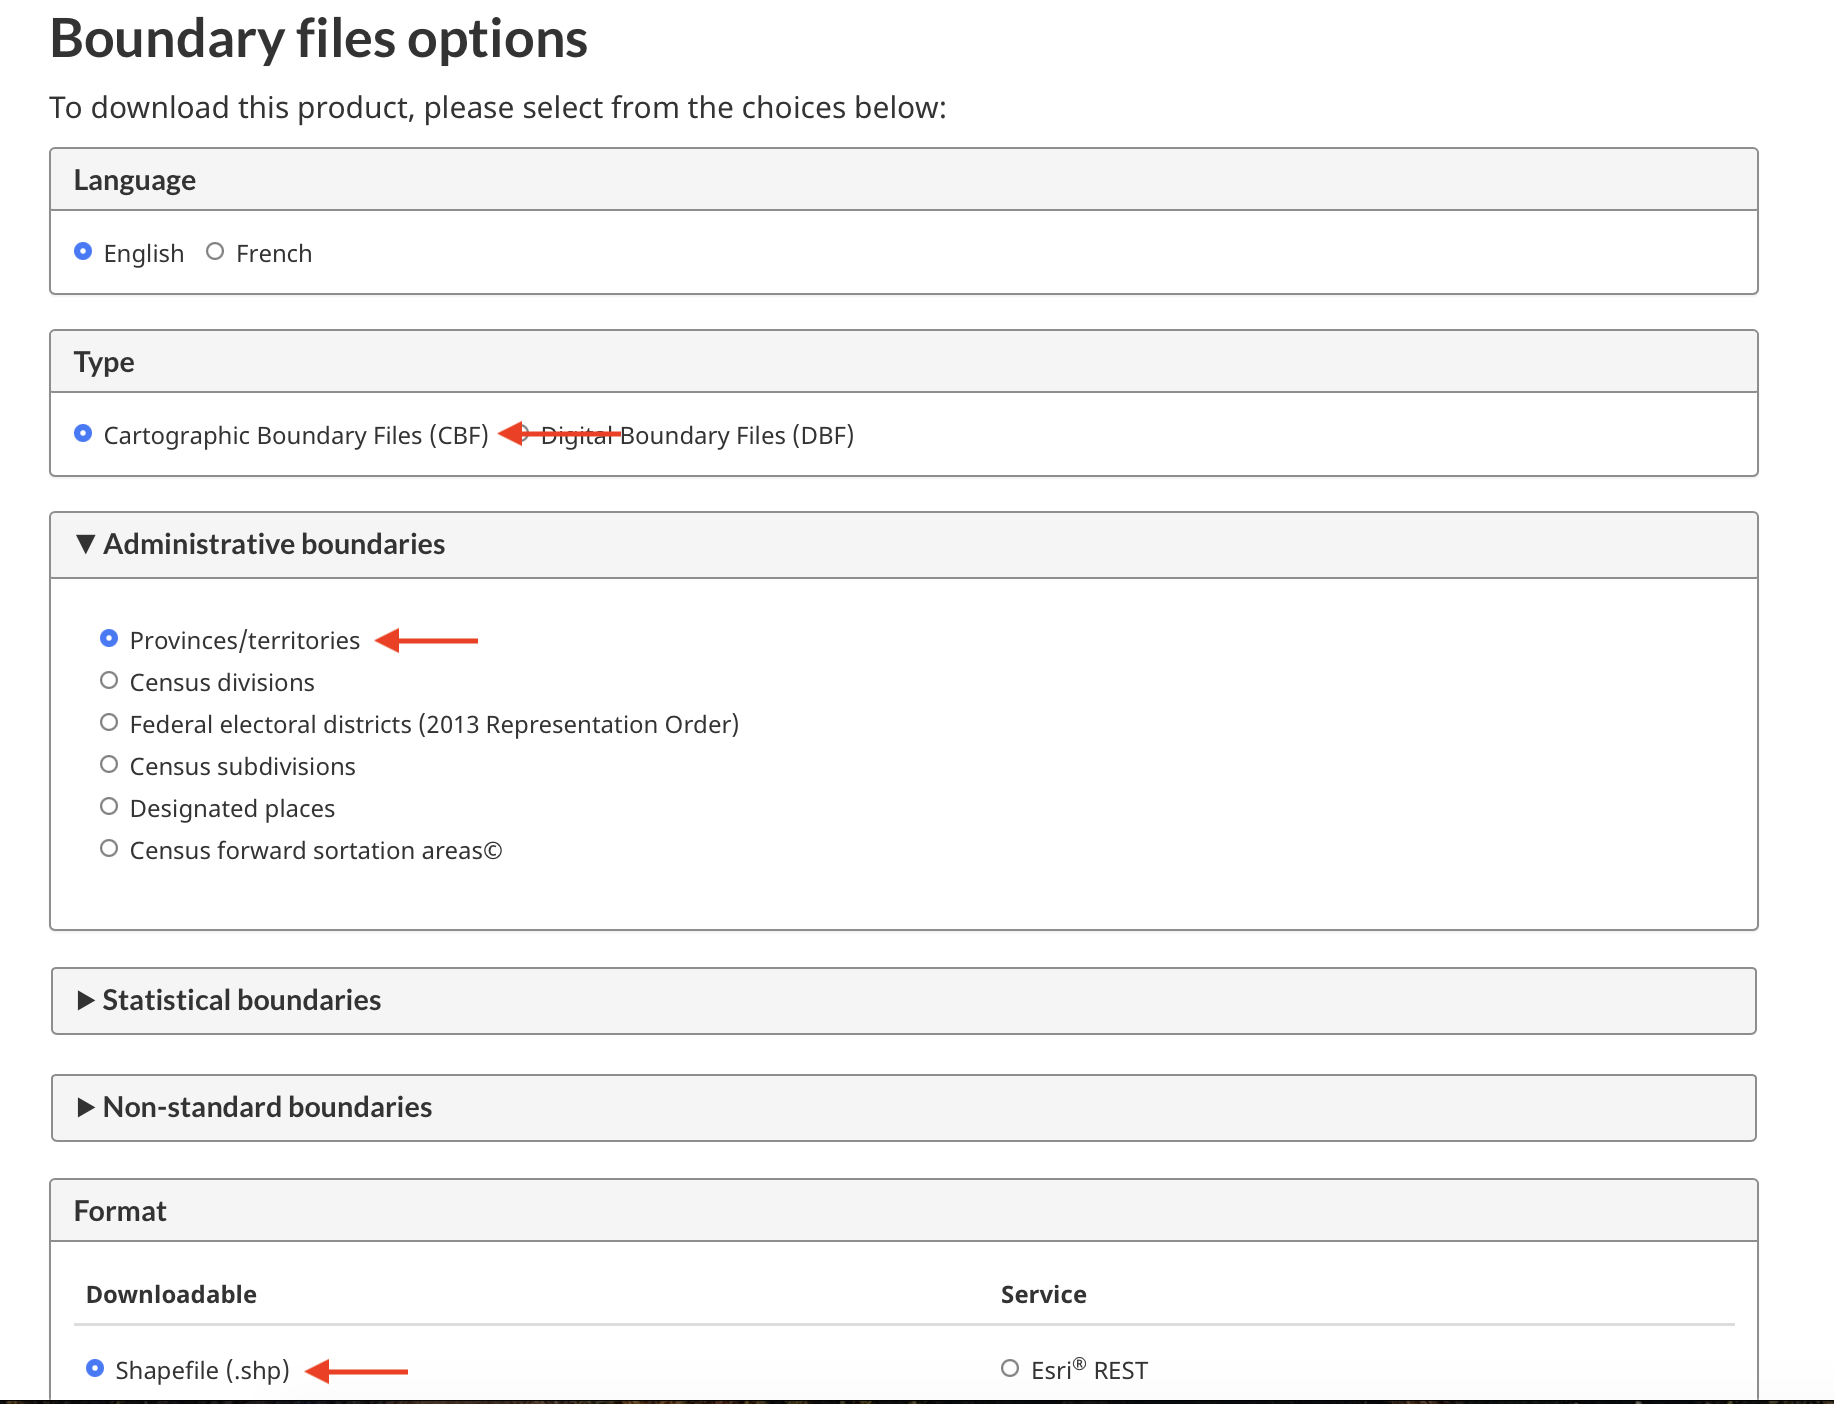
1. Download Provincial Boundaries
We’ll download provincial boundaries from census data hosted by the Government of Canada’s data portal. The website calls it 2021 Census – Boundary files.
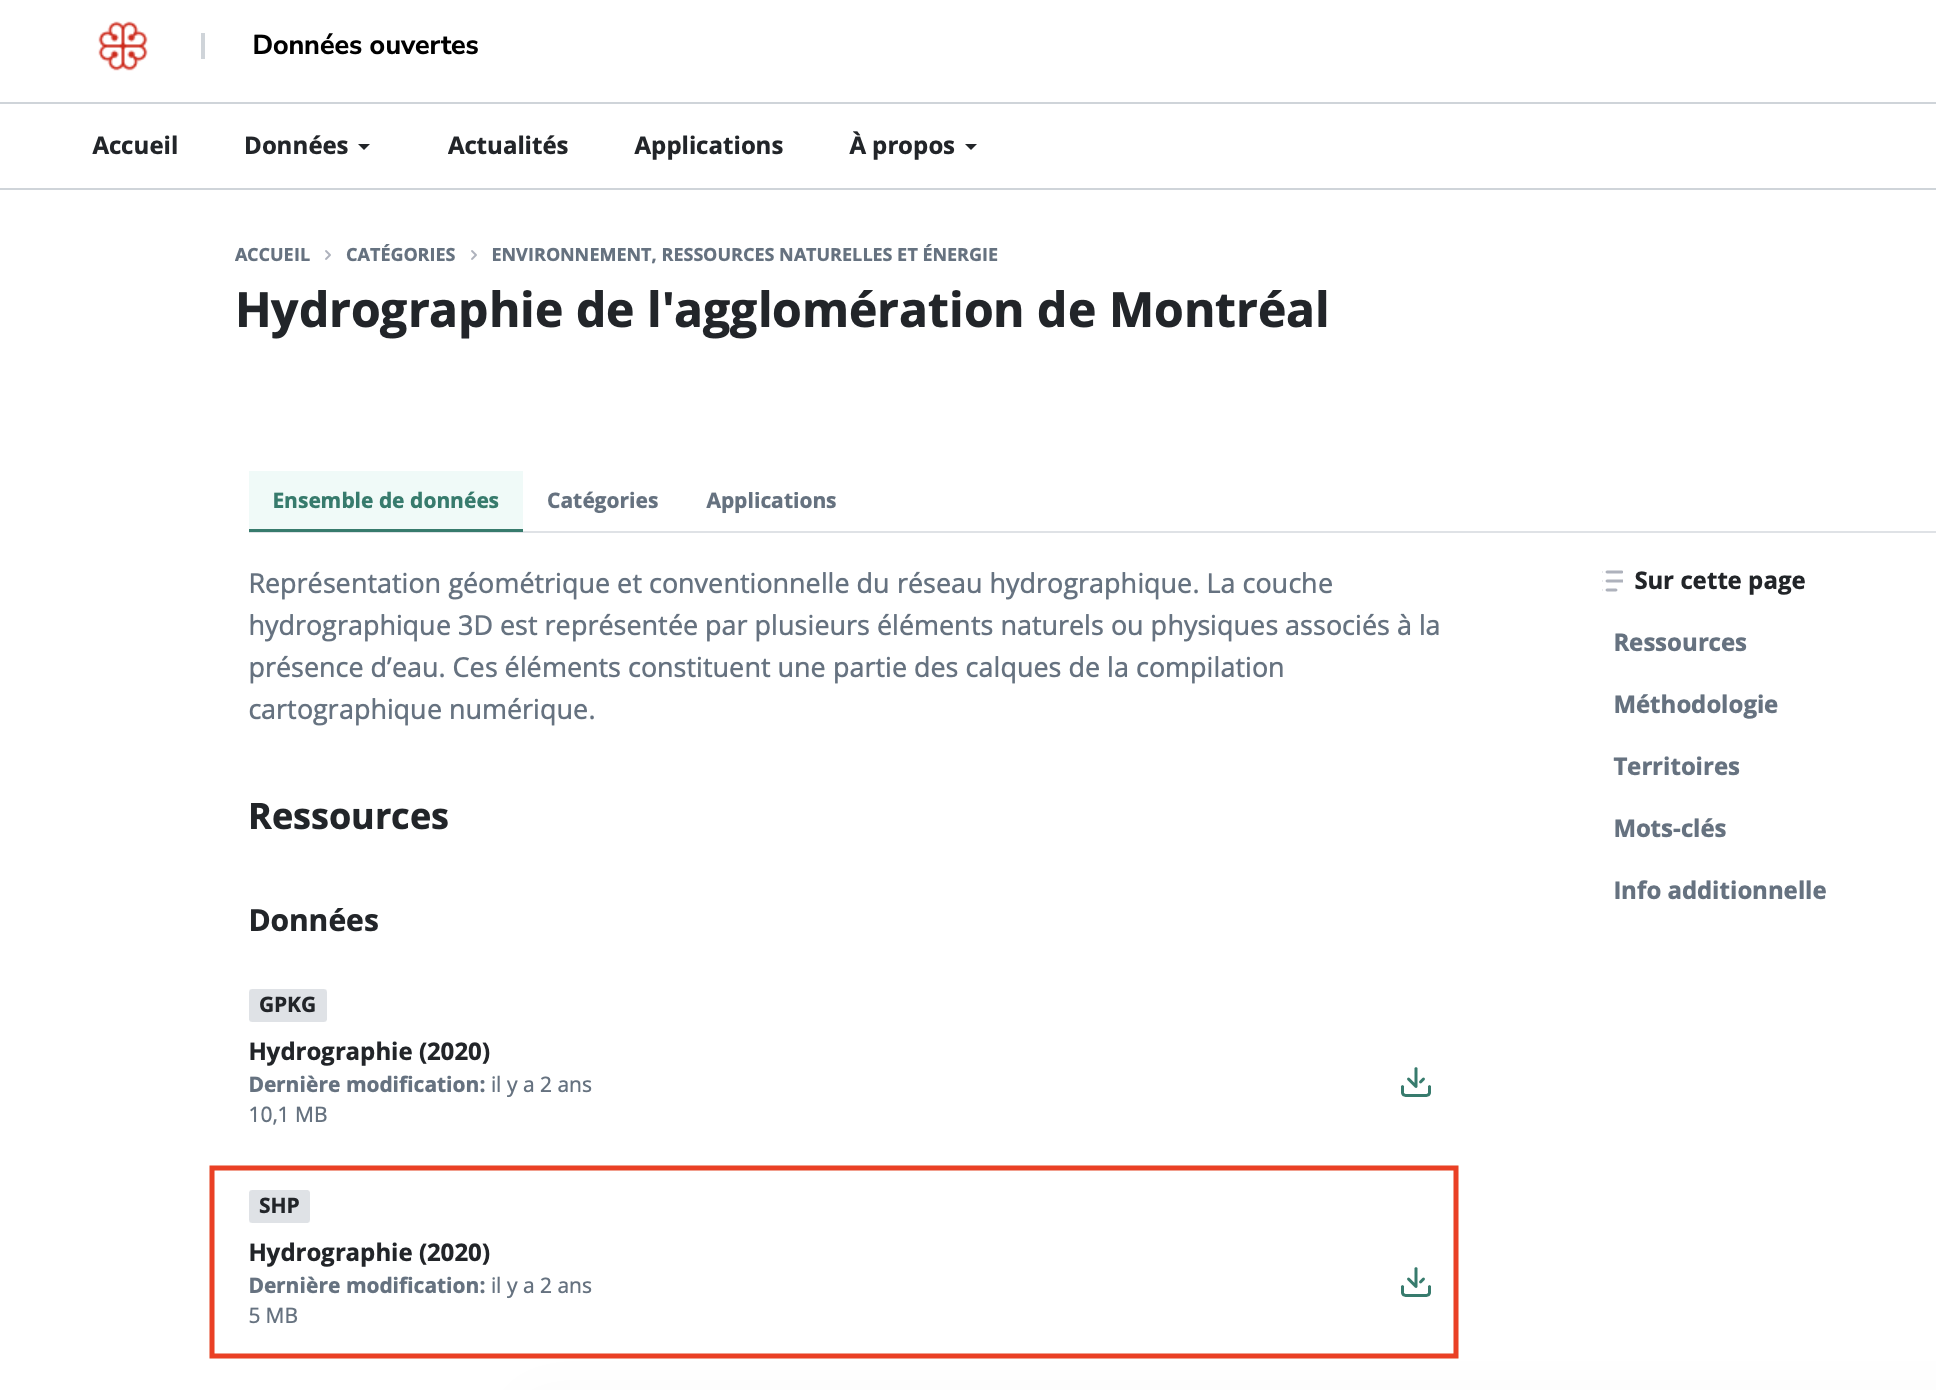
2. Download Water Features
We’ll download two sets of water features from the City of Montréal’s data portal, one for the City of Montréal as well as the Montréal Metro Area. Use the same process for each. Make sure you download the shapefile (.SHP) for both — the shapefiles are listed in different orders for each dataset.
3. Download Green Spaces
We’ll download Parks and Green Spaces also from the city of Montréal’s data portal. Note that the format for shapefile will show ZIP. This is simply a shapefile stored in a compressed folder you’ll have to unzip once you download and move it into dhsi-workshop/Day2/reference-mapping.
Be sure to move all downloads into the folder dhsi-workshop/Day2/reference-mapping and unzip any compressed files.
Loading last updated date...