Making a Proportional Symbol Map
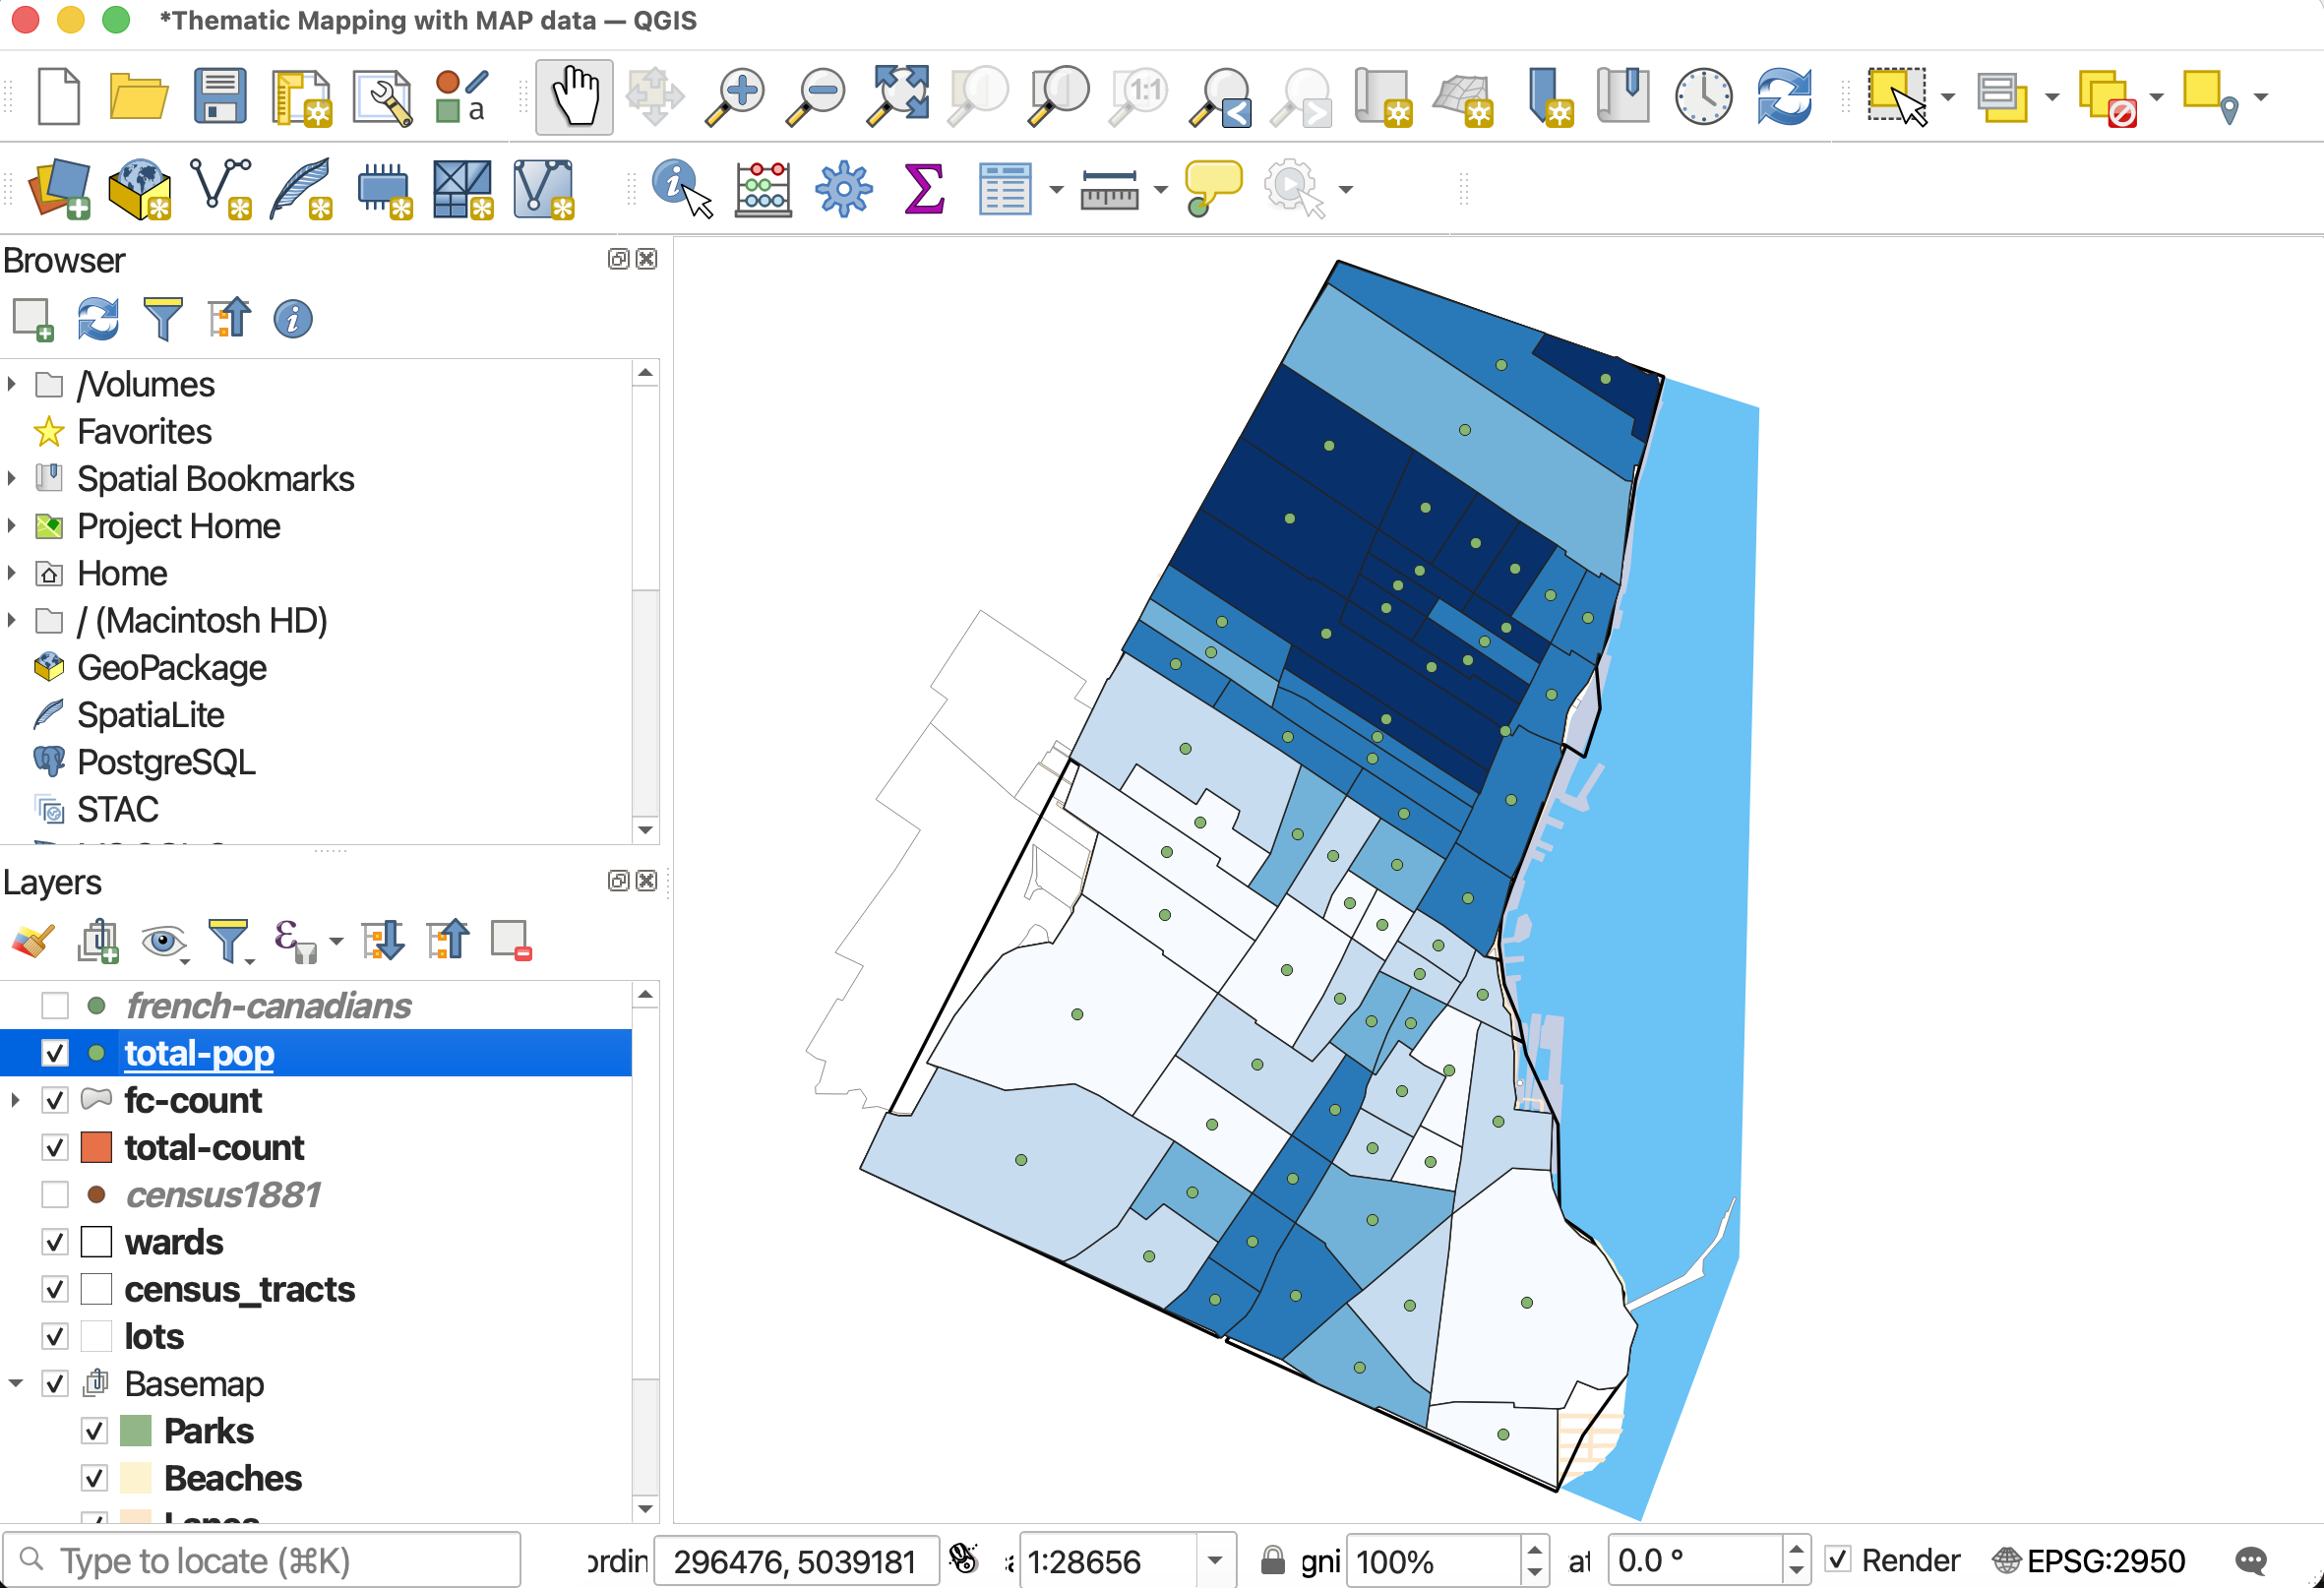
Now, let’s use symbols visualize total population in each census tract. The map will be busy since census tracts are so small and may of them, but this is just to demonstrate the workflow.
Convert polygons to points
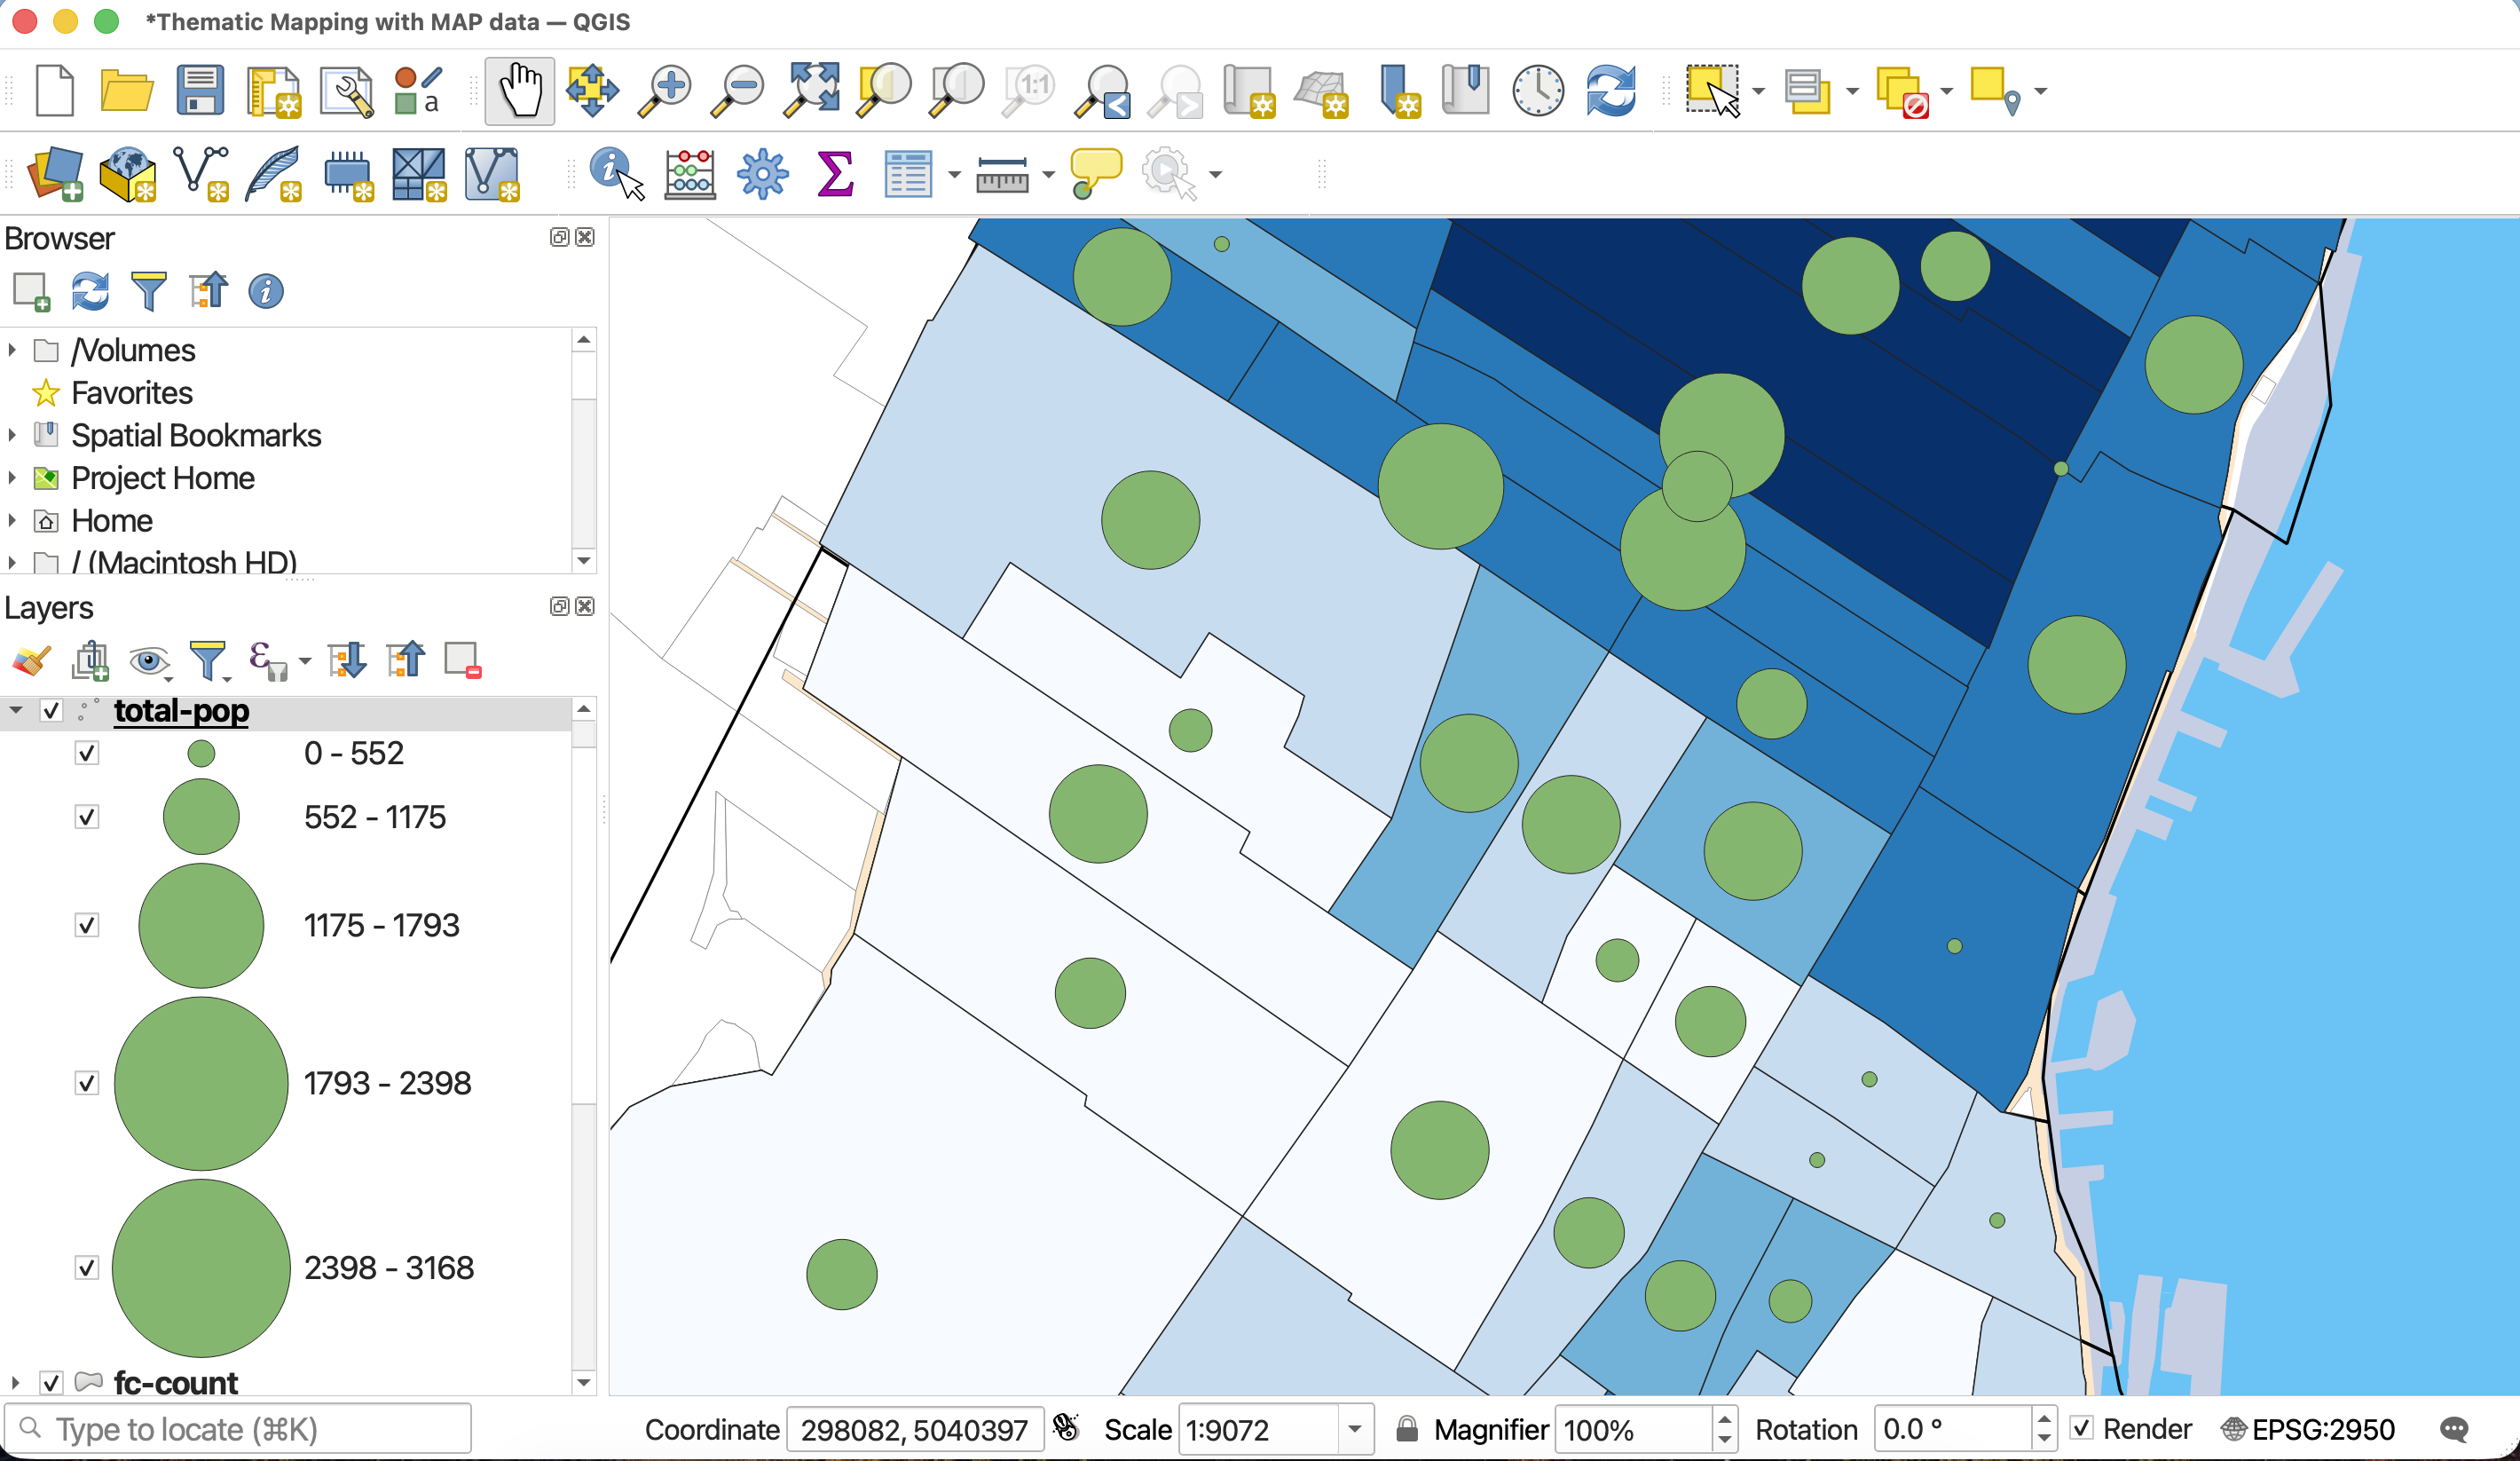
You can make proportional symbol maps in QGIS simply by applying a graduated symbology to a point layer, where each point represents a standard geographic area and contains the value of interest.
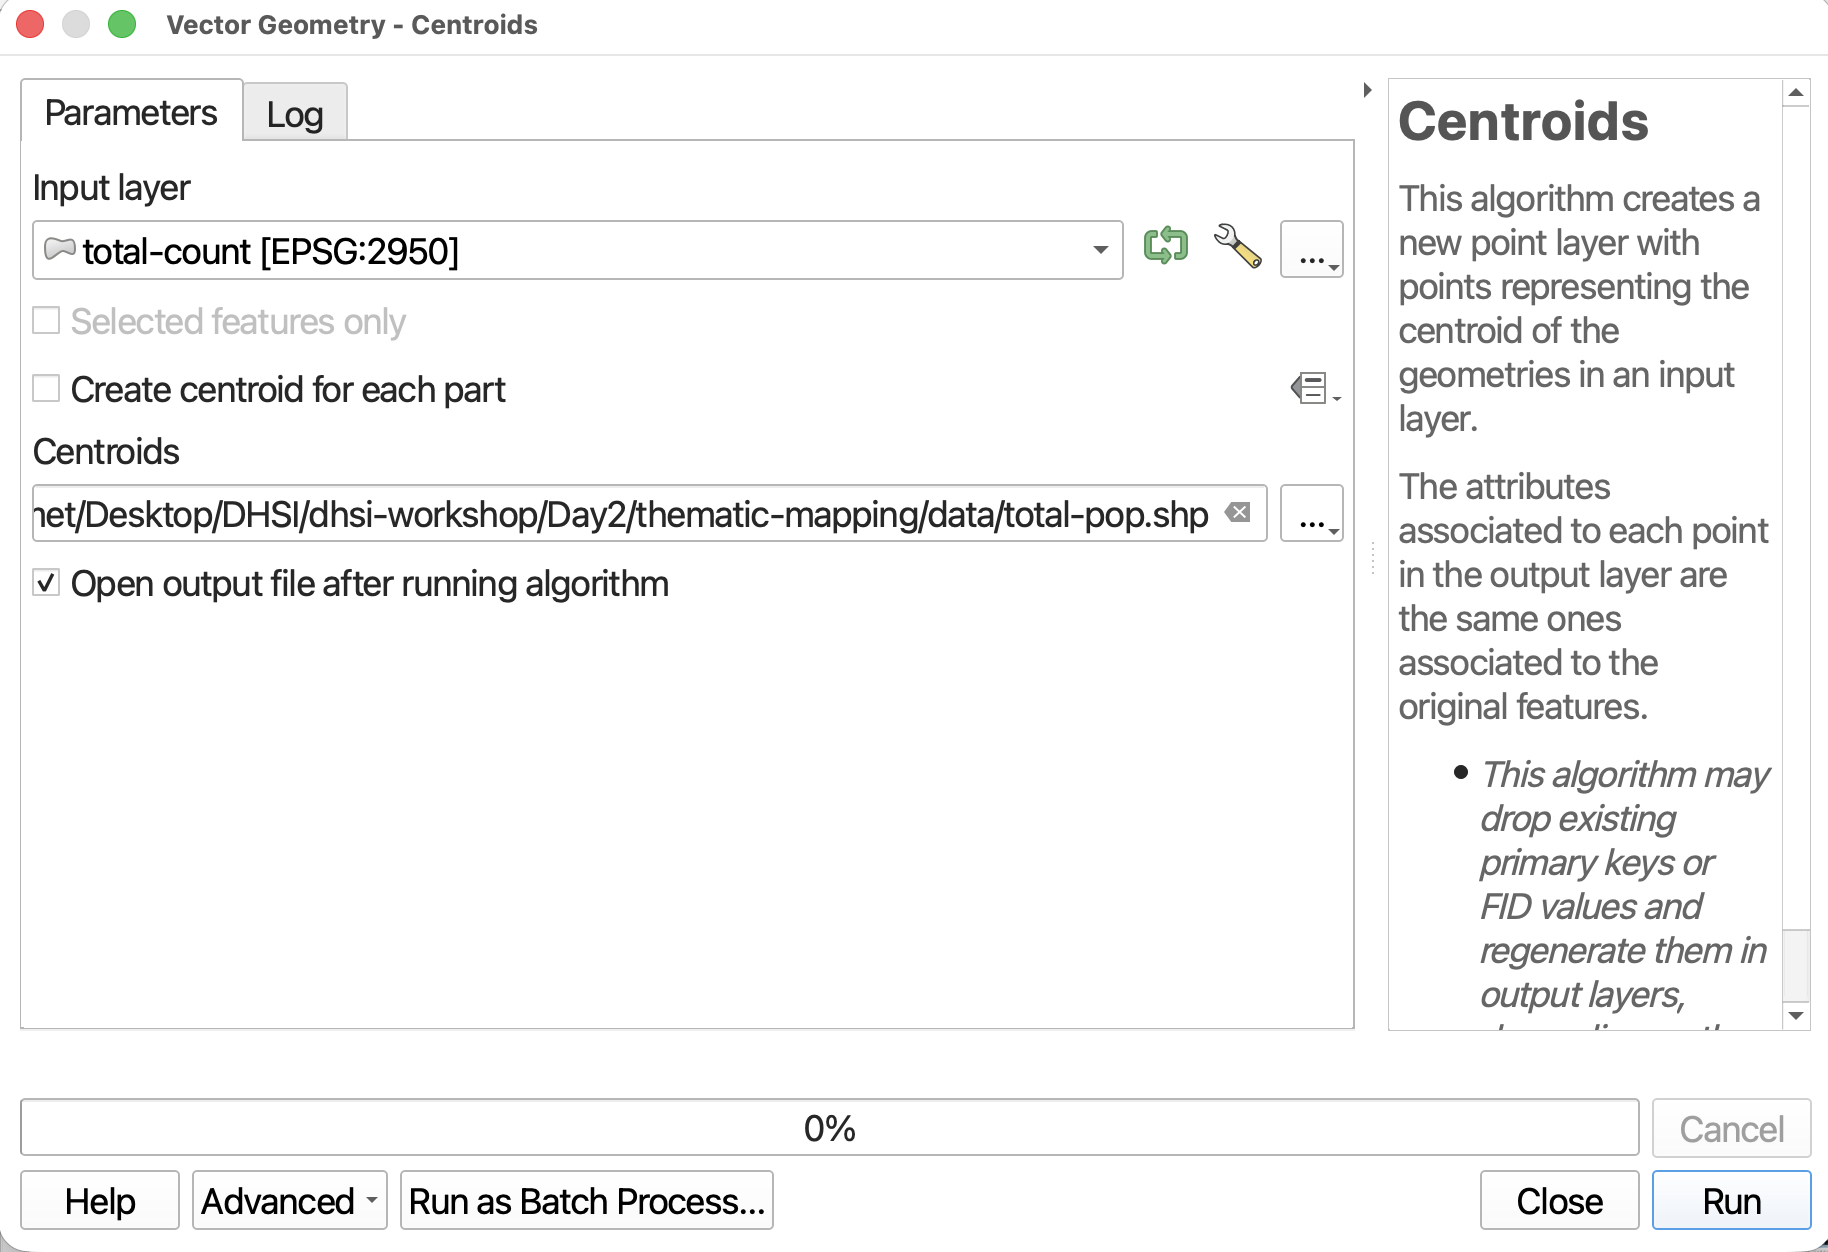
In the Processing Toolbox, search for the tool called Centroids. It should be under Vector Geometry.
Run the Centroids tool with the following parameters:
- Input layer:
total-count - Save the output layer as a file to your
dhsi-workshop/Day2/thematic-mapping/datafolder, and call ittotal-pop. - Do NOT check make centroids for each. this will create multiple files.
Adjust Symbology to Graduated by Size
If not automatically added to your map, load total-pop. Open the layer Symbology.
- Change the symbology type to Graduated.
- Set the Value to
total-pop. - Then, change Method to Size.
- Change the minimum size to 3mm and the maximum size to at least 20mm.
- Change the classification mode to Natural Breaks (Jenks).
- To change the symbol symbology, click on Symbol option and then select “Simple Marker”.
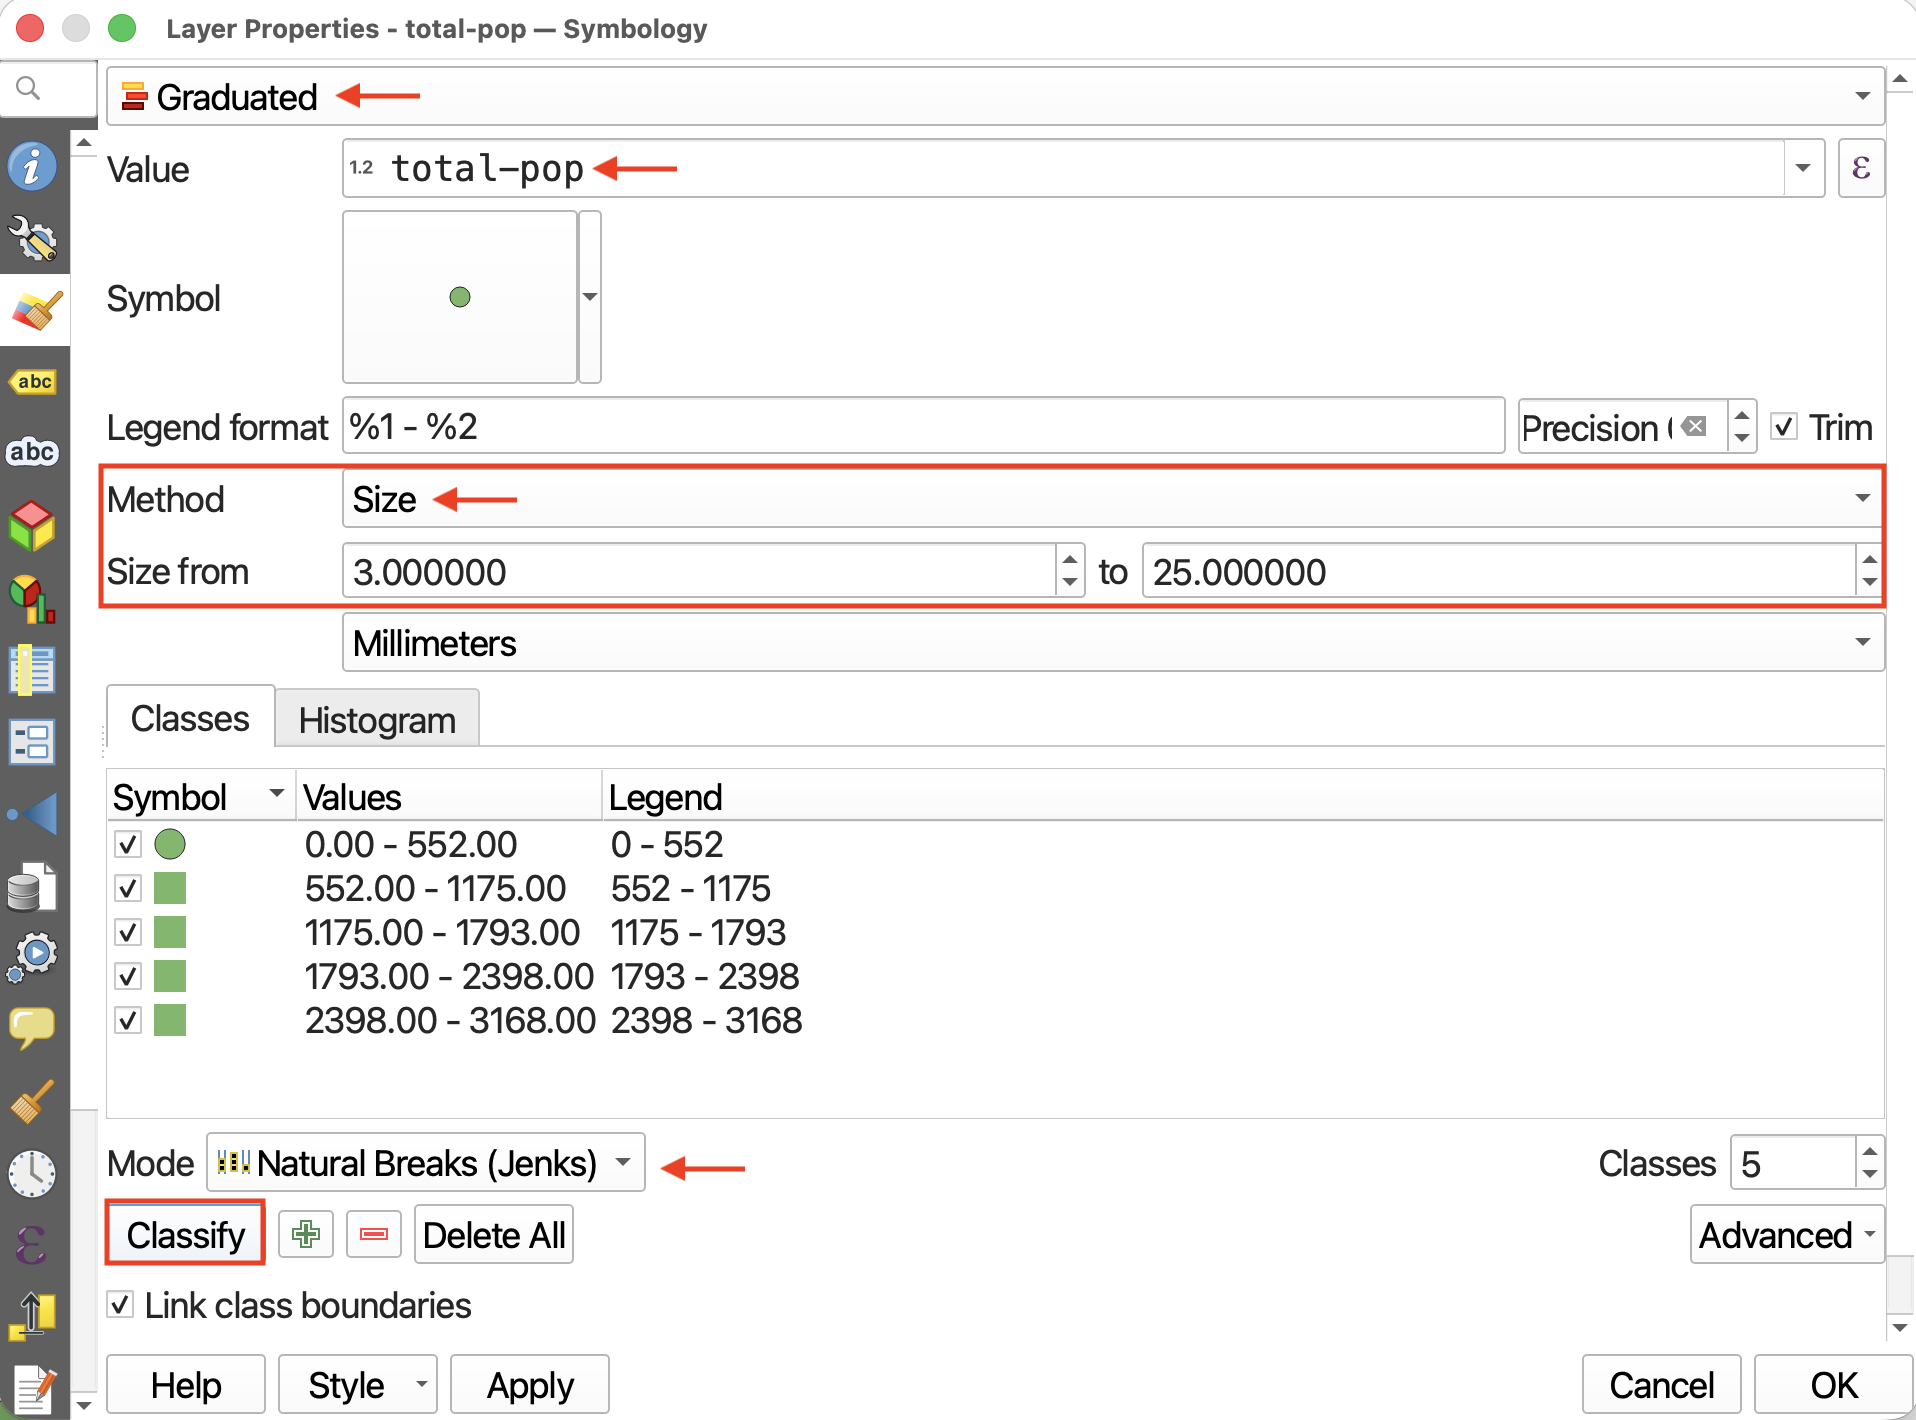
Then, hit Classify and Apply. Then close the Properties window and return to the main QGIS interface.
Resources for Proportional Symbol Mapping
- Axis Map’s guide to Proportional Symbols
- Another UBC Research Common’s tutorial on Proportional Symbol Mapping, including guide to sizing proportional symbols by hand in an illustration software.
- Perceptual Scaling of Map Symbols by John Krygier.
Loading last updated date...