Warm-up
Coming up with a scenario in which you need to work with multiple datasets
Hints:
- Scenarios when you have to combine variables (columns) from multiple sources
- Scenarios when you have to combine records (rows) from several units or time points
- Scenarios when you have to work with databases, e.g.,
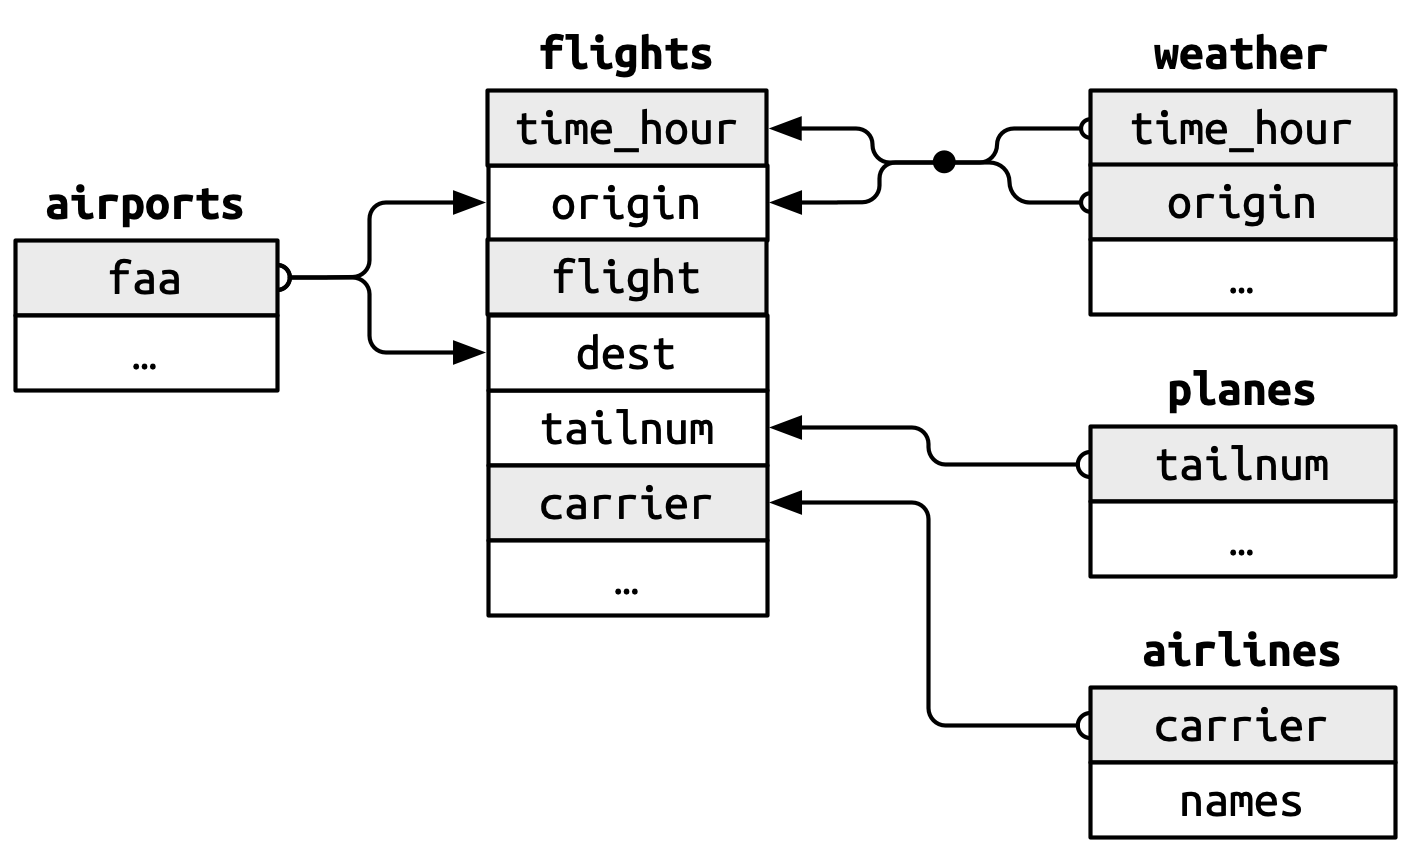
Note. The bolded texts are names of data frames, and the cells below are the variables within the data frame.
Source: Garrett Grolemund & Hadley Wickham, R for Data Science (2e)
Common scenarios
- Combining data from multiple agencies
Case 1: binding World Bank GDP data and the United Nations Development Program gender inequality index (GII) to examine the relationship between gender equality and economic development across countries. - Combining data from multiple units
Case 2: binding student performance data from different classes and schools to examine the relationships among individual performance, class, and school level factors such as class size and school funding - Combining data from multiple time points
Case 3: matching several waves of survey data pre, during and post a six-month group psychotherapy intervention to track the change of depression levels of each individual to evaluate the effectiveness of the intervention - Working with data from database tables
Case 4: matching flights delay information and airports weather information to identify weather conditions that associated with the severest flight delays
A closer look at case 4
Read R Documents
Input
# Install the required packages if not yet installed
install.packages('tidyverse')
install.packages('nycflights13')

# Load the packages to the current session
library(tidyverse)
library(nycflights13)

# Call for the R document for nycflights13
??nycflights13

# Call for the R document for the flights data set
?flights

# Open the flights data in a separate tab
View(flights)
Practice
- Check the other four data sets:
weather,planes,airports,airlines. - Why don’t we put all the information in a data frame? What are the benefits of creating multiple data frames? Could you imagine what an overall combined data frame would look like?
So far you have seen some reasons to work with multiple data frames:
- data being collected separately from multiple agencies, units and time points,
- data being kept/stored separately because a huge combined data frame creates redundancy, takes up more memory, slows analysis speed, is less secure and harder to manage.
The data frames must have at least one variable in common so that they can be combined. The variables two tables have in common that help them relate to each other are known as keys.
Loading last updated date...