Joins
Combining two data frames seems easy if the rows are perfectly aligned. However, the order of the rows in two data frames is usually messy in reality, as shown in the following figure. That’s where keys come into place. This section introduces how to join two data frames based on the identified keys.
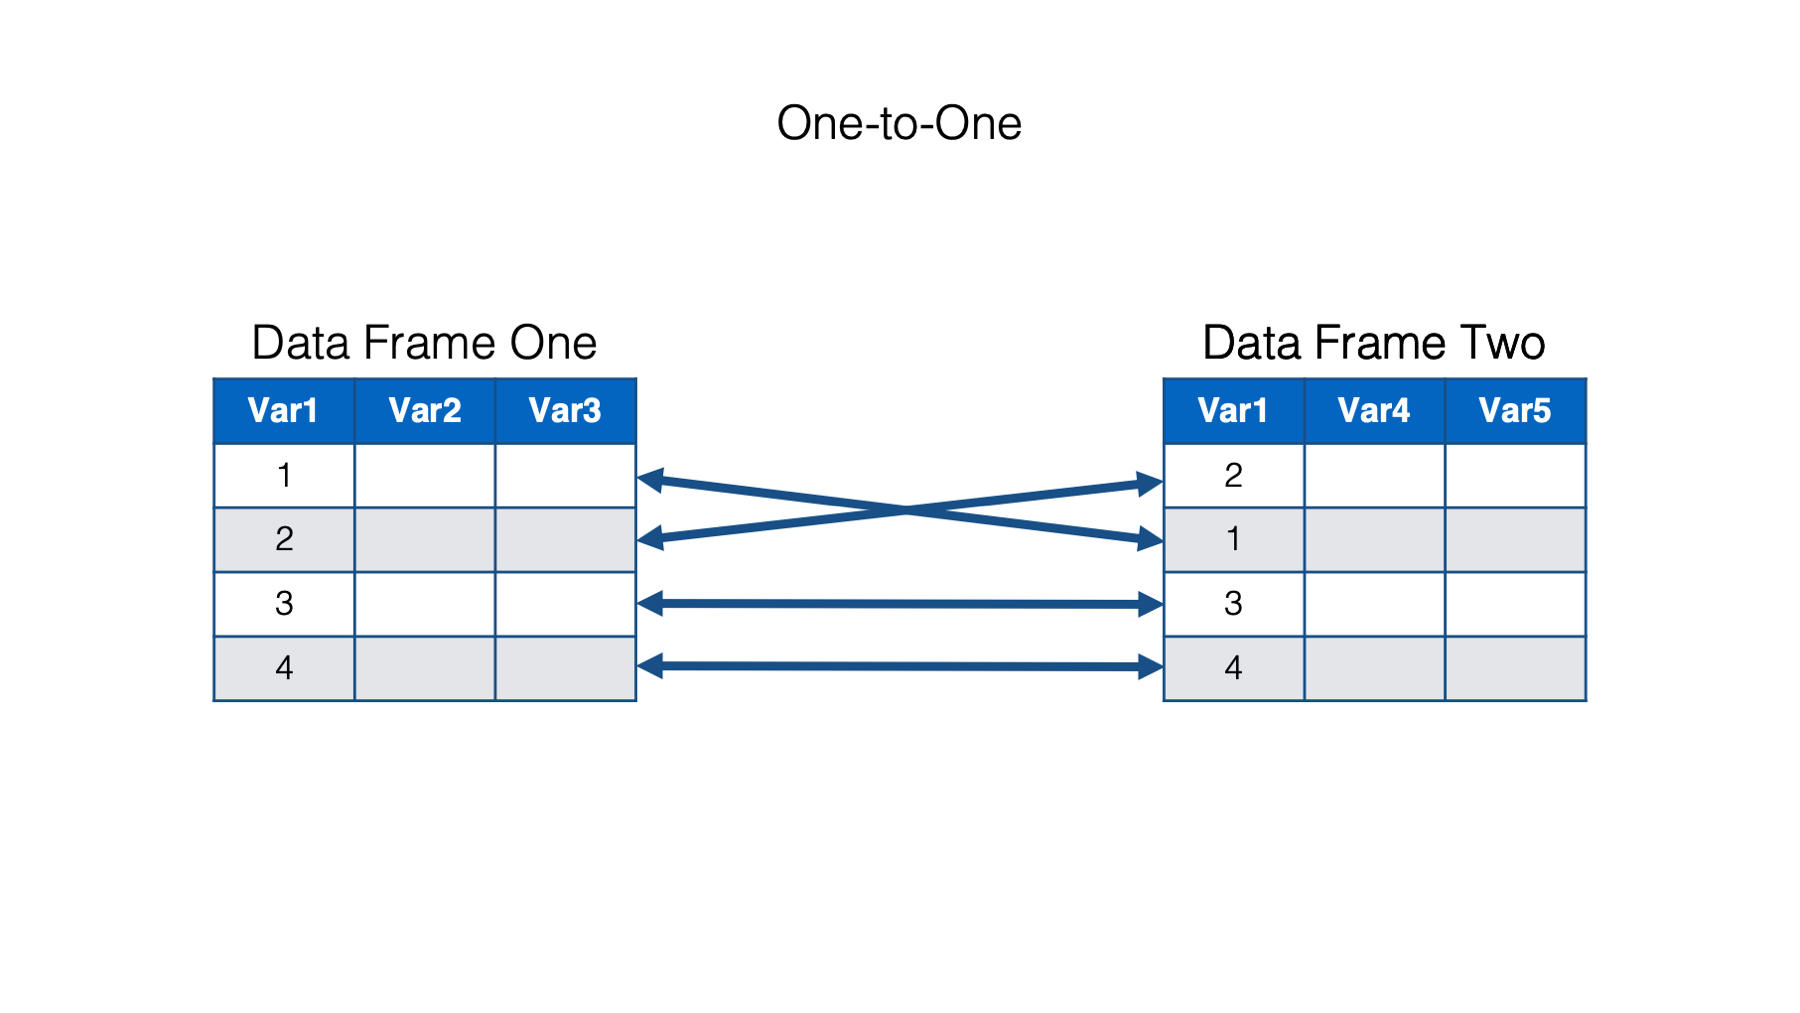
Source: Brad Cannell, R for Epidemiology
Mutating join
Description in R Document mutate-joins {dplyr} [Package dplyr version 1.0.10]
The mutating joins add columns from y to x, matching rows based on the keys:
- inner_join(): includes all rows in x and y.
- left_join(): includes all rows in x.
- right_join(): includes all rows in y.
- full_join(): includes all rows in x or y.
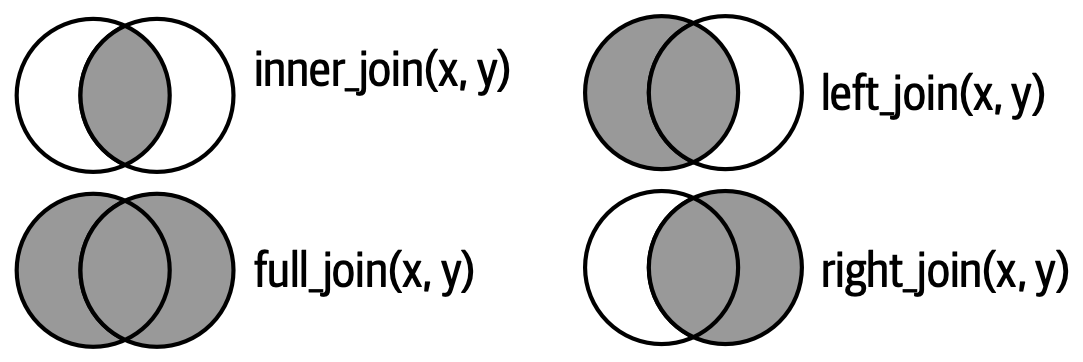
Source: Hadley Wickham & Garrett Grolemund, R for Data Science (2e)
Examples of mutating joins in R
Input
# run the following code line by line
# after run each line, look at the help tab in the right bottom
# scroll down to the examples section and run examples
?inner_join
?full_join
?left_join
?right_join
Practice
Source: Jeffrey B. Arnold, R for Data Science Exercise Solutions
What weather conditions make it more likely to see a delay?
Step 1
Join the weather and flights data frames. What type of join to use? What is the key?
Input
weather_flights <- weather %>%
  ?_join(flights, by = "")
Step 2
Select the necessary variables, weather conditions from temp to visib and dep_delay.
Input
use_weather_flights <- weather_flights %>%
  select()
Step 3
Visualize the relationship between each weather condition and departure delay.
Input
## group data to calculate mean delay per temperature
flights.sum=use_weather_flights %>%
  group_by(temp) %>%
  summarise(mean_delay = mean(dep_delay, na.rm = TRUE))

## plot the data
ggplot(flights.sum, aes(x = temp, y = mean_delay)) +
  geom_smooth(se=F) +
  geom_point()
Filtering join
Description in R Document filter-joins {dplyr} [Package dplyr version 1.0.10]
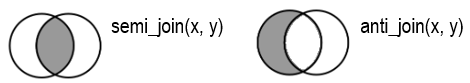
Filtering joins filter rows from x based on the presence or absence of matches in y:
- semi_join() return all rows from x with a match in y.
- anti_join() return all rows from x without a match in y.
Examples of filtering joins in R
Input
# run the following code line by line
# after run each line, look at the help tab in the right bottom
# scroll down to the examples section and run examples
?semi_join
?anti_join
Practice
Source: Jeffrey B. Arnold, R for Data Science Exercise Solutions
Find the 48 hours (over the course of the whole year) that have the worst departure delays. Cross-reference it with the weather data. Can you see any patterns?
Step 1
To find the 48 hours with the worst departure delays, group flights by hour of scheduled departure time and calculate the average delay, arrange by delay, and select the 48 observations (hours) with the highest average delay.
Input
worst_hours <- flights %>%
  mutate(hour = sched_dep_time %/% 100) %>%
  group_by(origin, time_hour) %>%
# new for R4.4.0 - need to add .groups = 'drop' to the summarise section to group by all the variables in group_by()
  summarise(dep_delay = mean(dep_delay, na.rm = TRUE), .groups = 'drop') %>%
  ungroup() %>%
# sort the data to have longest delay at the top of the dataframe
  arrange(desc(dep_delay)) %>%
# keep only 5 longst average delays for easier visualisation
  slice(1:5)
Step 2
To get the weather for these hours, choose a type of filtering joins.
Input
weather_most_delayed <- ?_join(weather, worst_hours, by = c("origin", "time_hour"))
Step 3
To get the weather for hours except for those hours, choose a type of filtering joins.
Input
weather_less_delayed <- ?_join(weather, worst_hours, by = c("origin", "time_hour"))
Step 4
Compare the average weather conditions in the most and less delayed hours.
Input
weather_less_delayed <- weather_less_delayed %>%
  mutate(most_delayed = 'no')

weather.md.sum=weather_most_delayed %>%
  mutate(most_delayed = 'yes') %>%
  rows_append(weather_less_delayed) %>%
  group_by(most_delayed) %>%
  summarise(temp = mean(temp, na.rm = TRUE),
            dewp = mean(dewp, na.rm = TRUE),
            humid = mean(humid, na.rm = TRUE),
            wind_speed = mean(wind_speed, na.rm = TRUE),
            precip = mean(precip, na.rm = TRUE),
            visib = mean(visib, na.rm = TRUE))
Loading last updated date...