Symbology
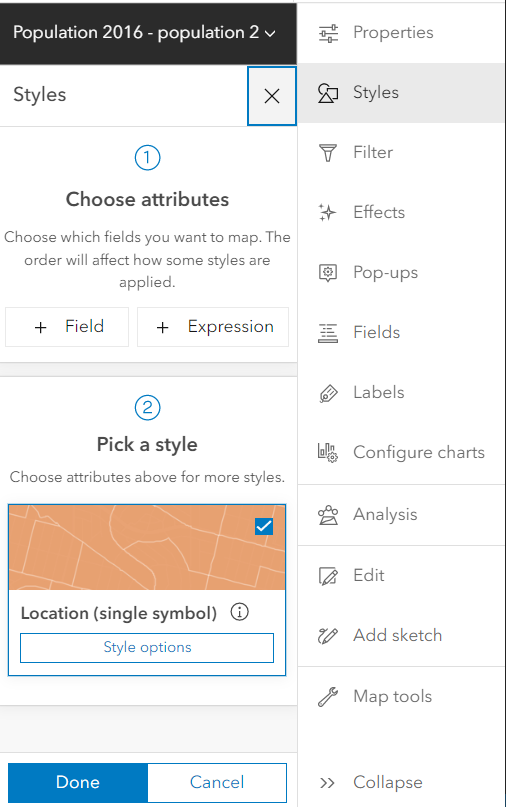
1 Click on Style on the right sidebar.

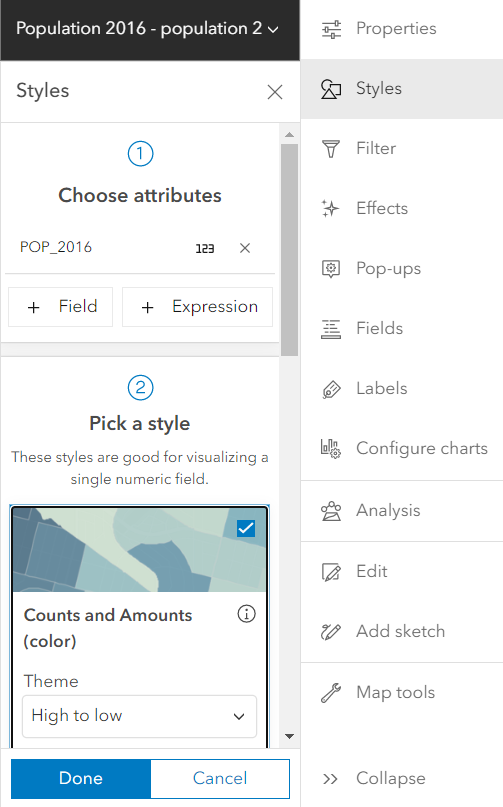
2 Select POP_2016 as the interested attribute, then pick Counts and Amounts (color) as a style.

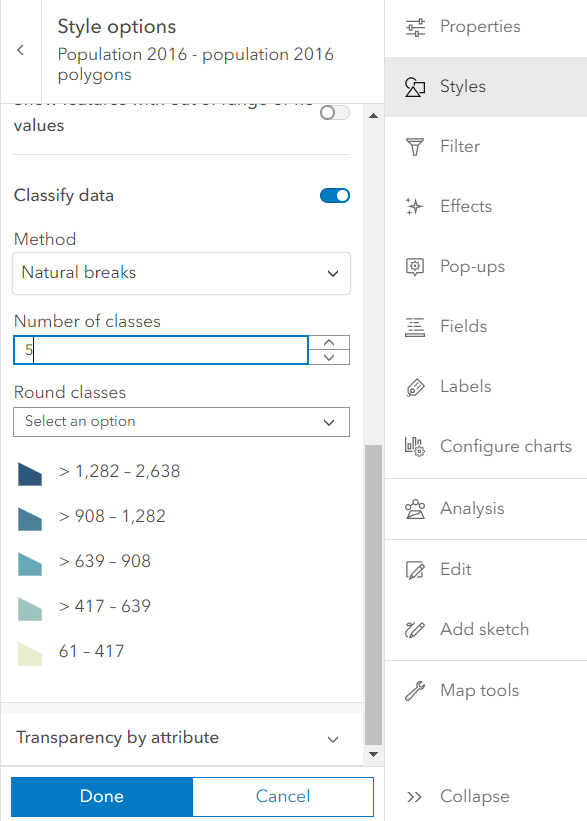
4 Click on style option and check Classify data with the Natural Breaks method. Enter 5 for the Number of classes and label each classes.

5 Click Done and Save your map.