Webmapping with QGIS using qgis2web plugin
Want to convert your QGIS project into a dynamic and interactive webmap? There’s a plugin for that! qgis2web allows you to seamlessly create a webmap from your project that preserves your layers and their symbology. This next section will guide you through turning your current QGIS project into a webmap powered by Leaflet.
CHECK MY NOTES FOR IMPORTANT THINGS TO REMEMBER HERE
Creating a webmap with qgis2web plugin
Open the example QGIS project in your workshop folder: DHSI-workshop-data/Day3/QGIS-webmapping/example-project.qgz. Zoom to the group city of toronto. 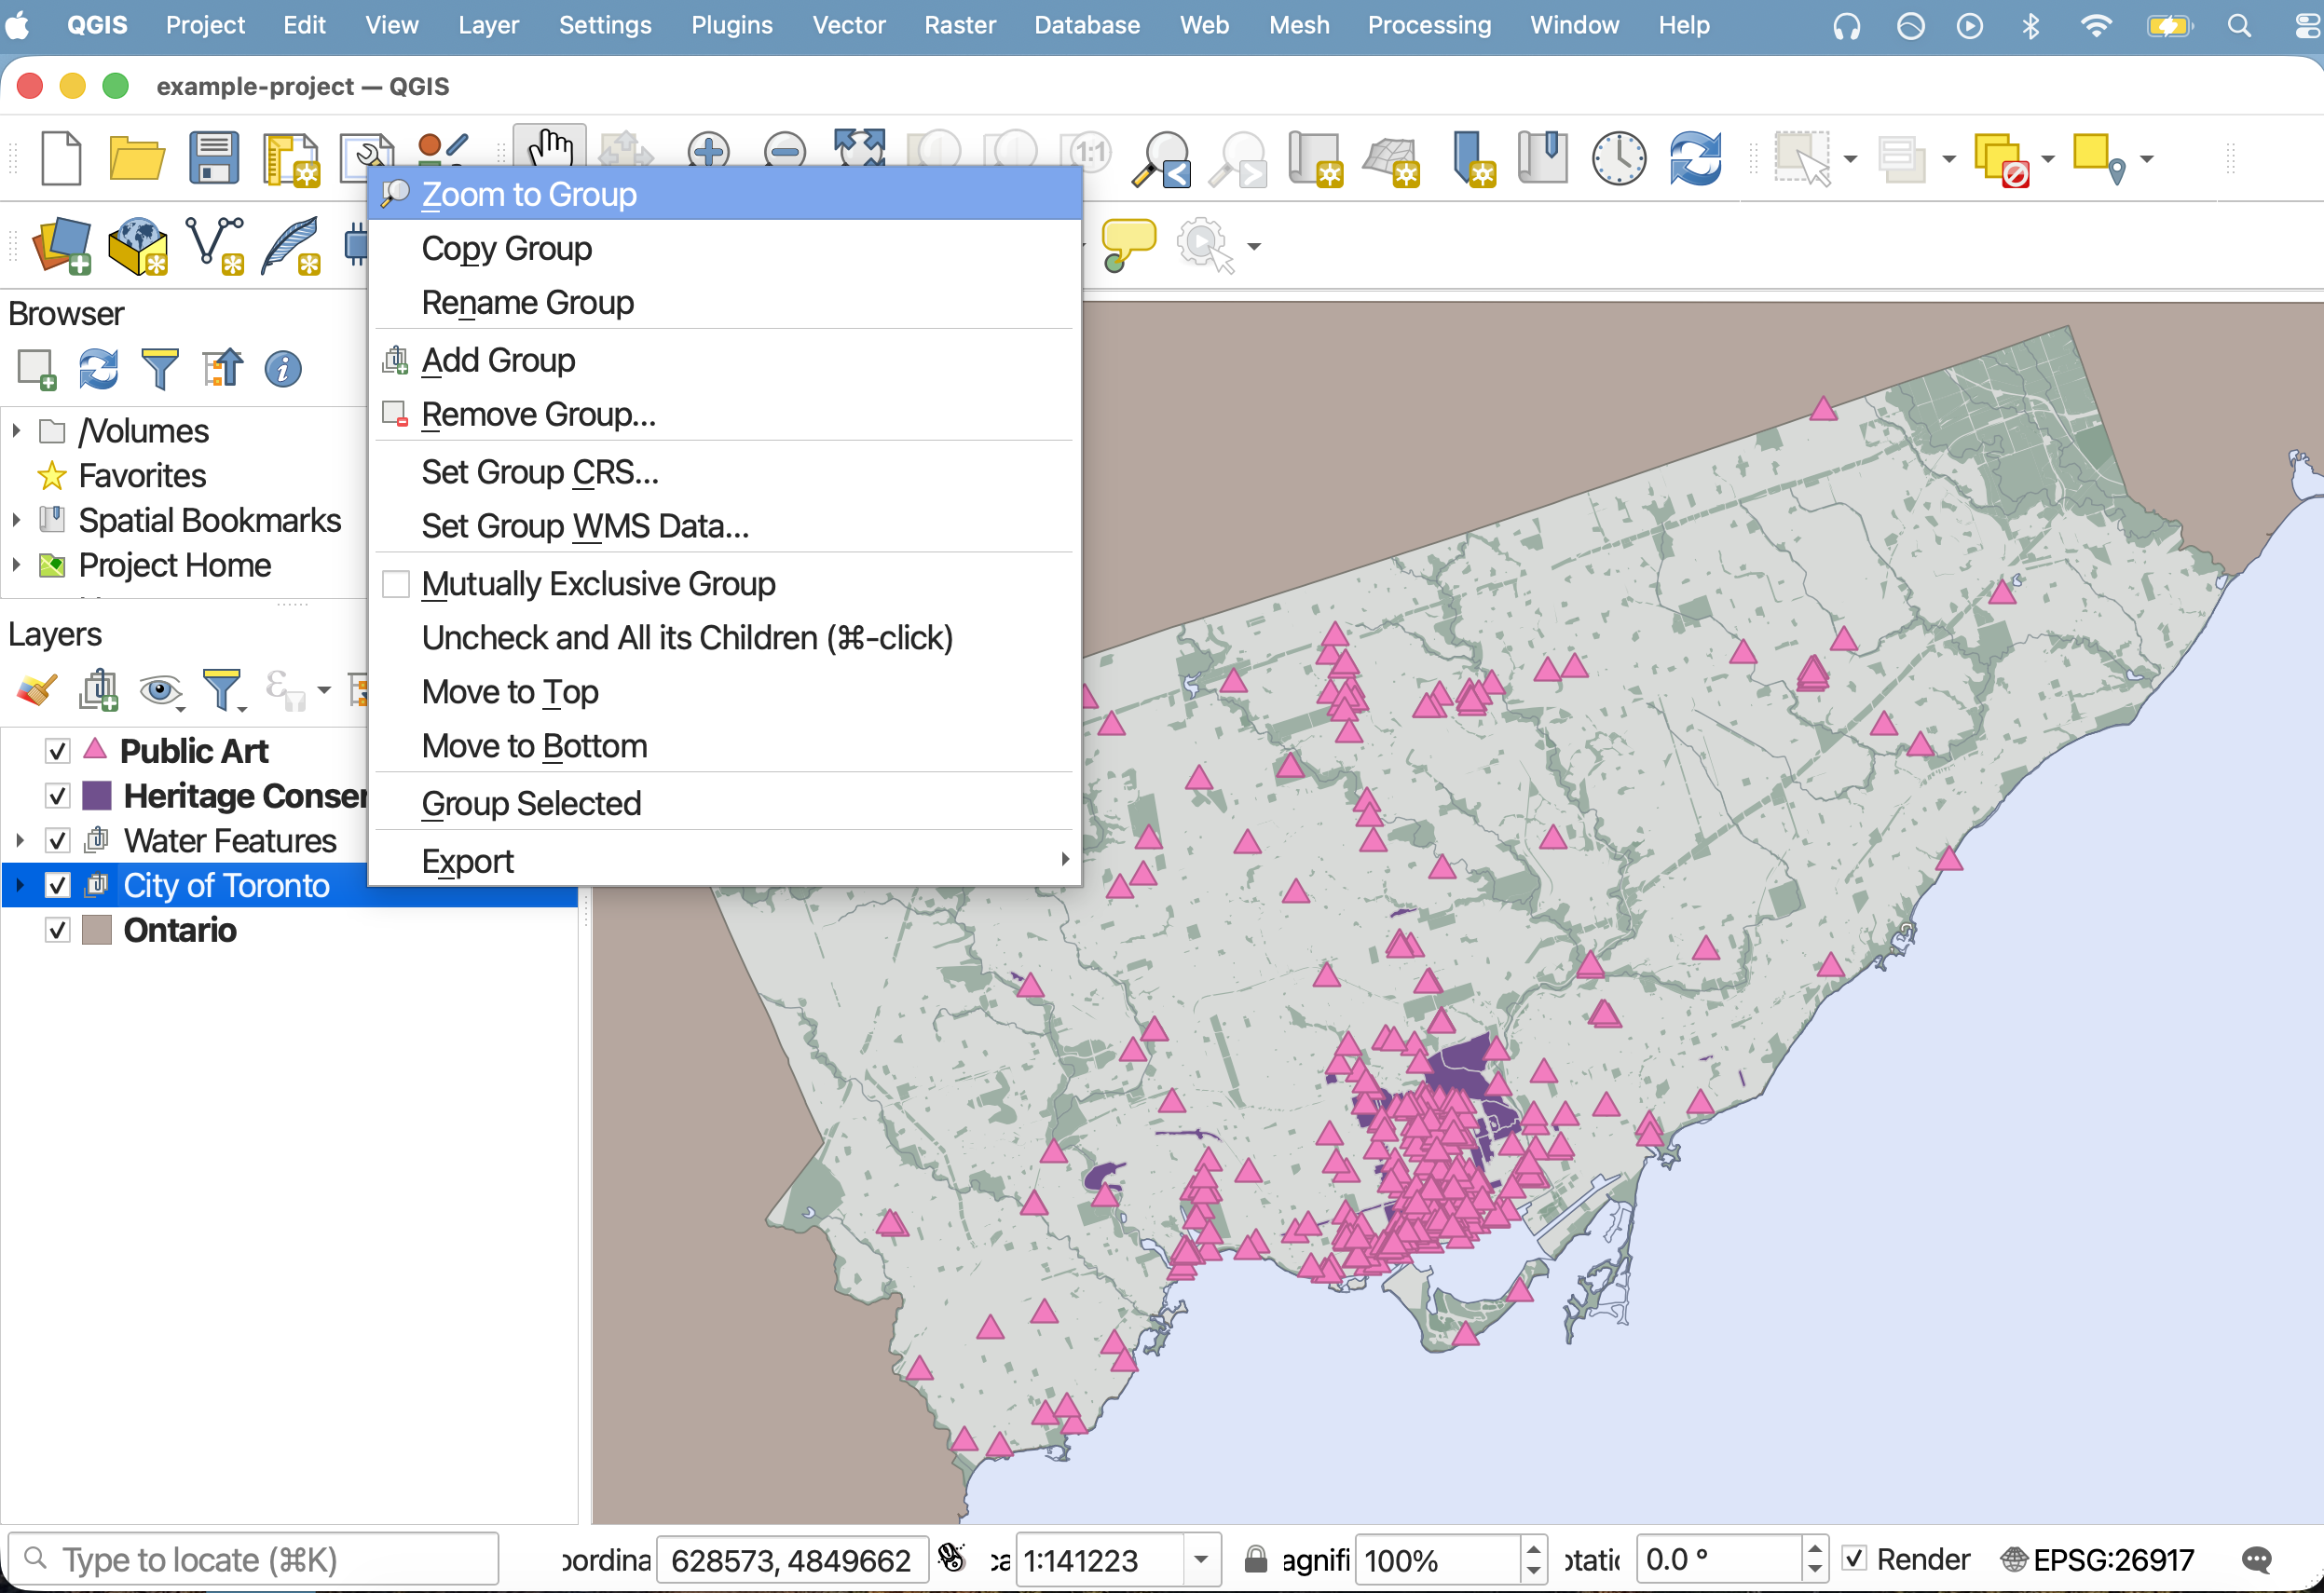
1. Open qgis2web
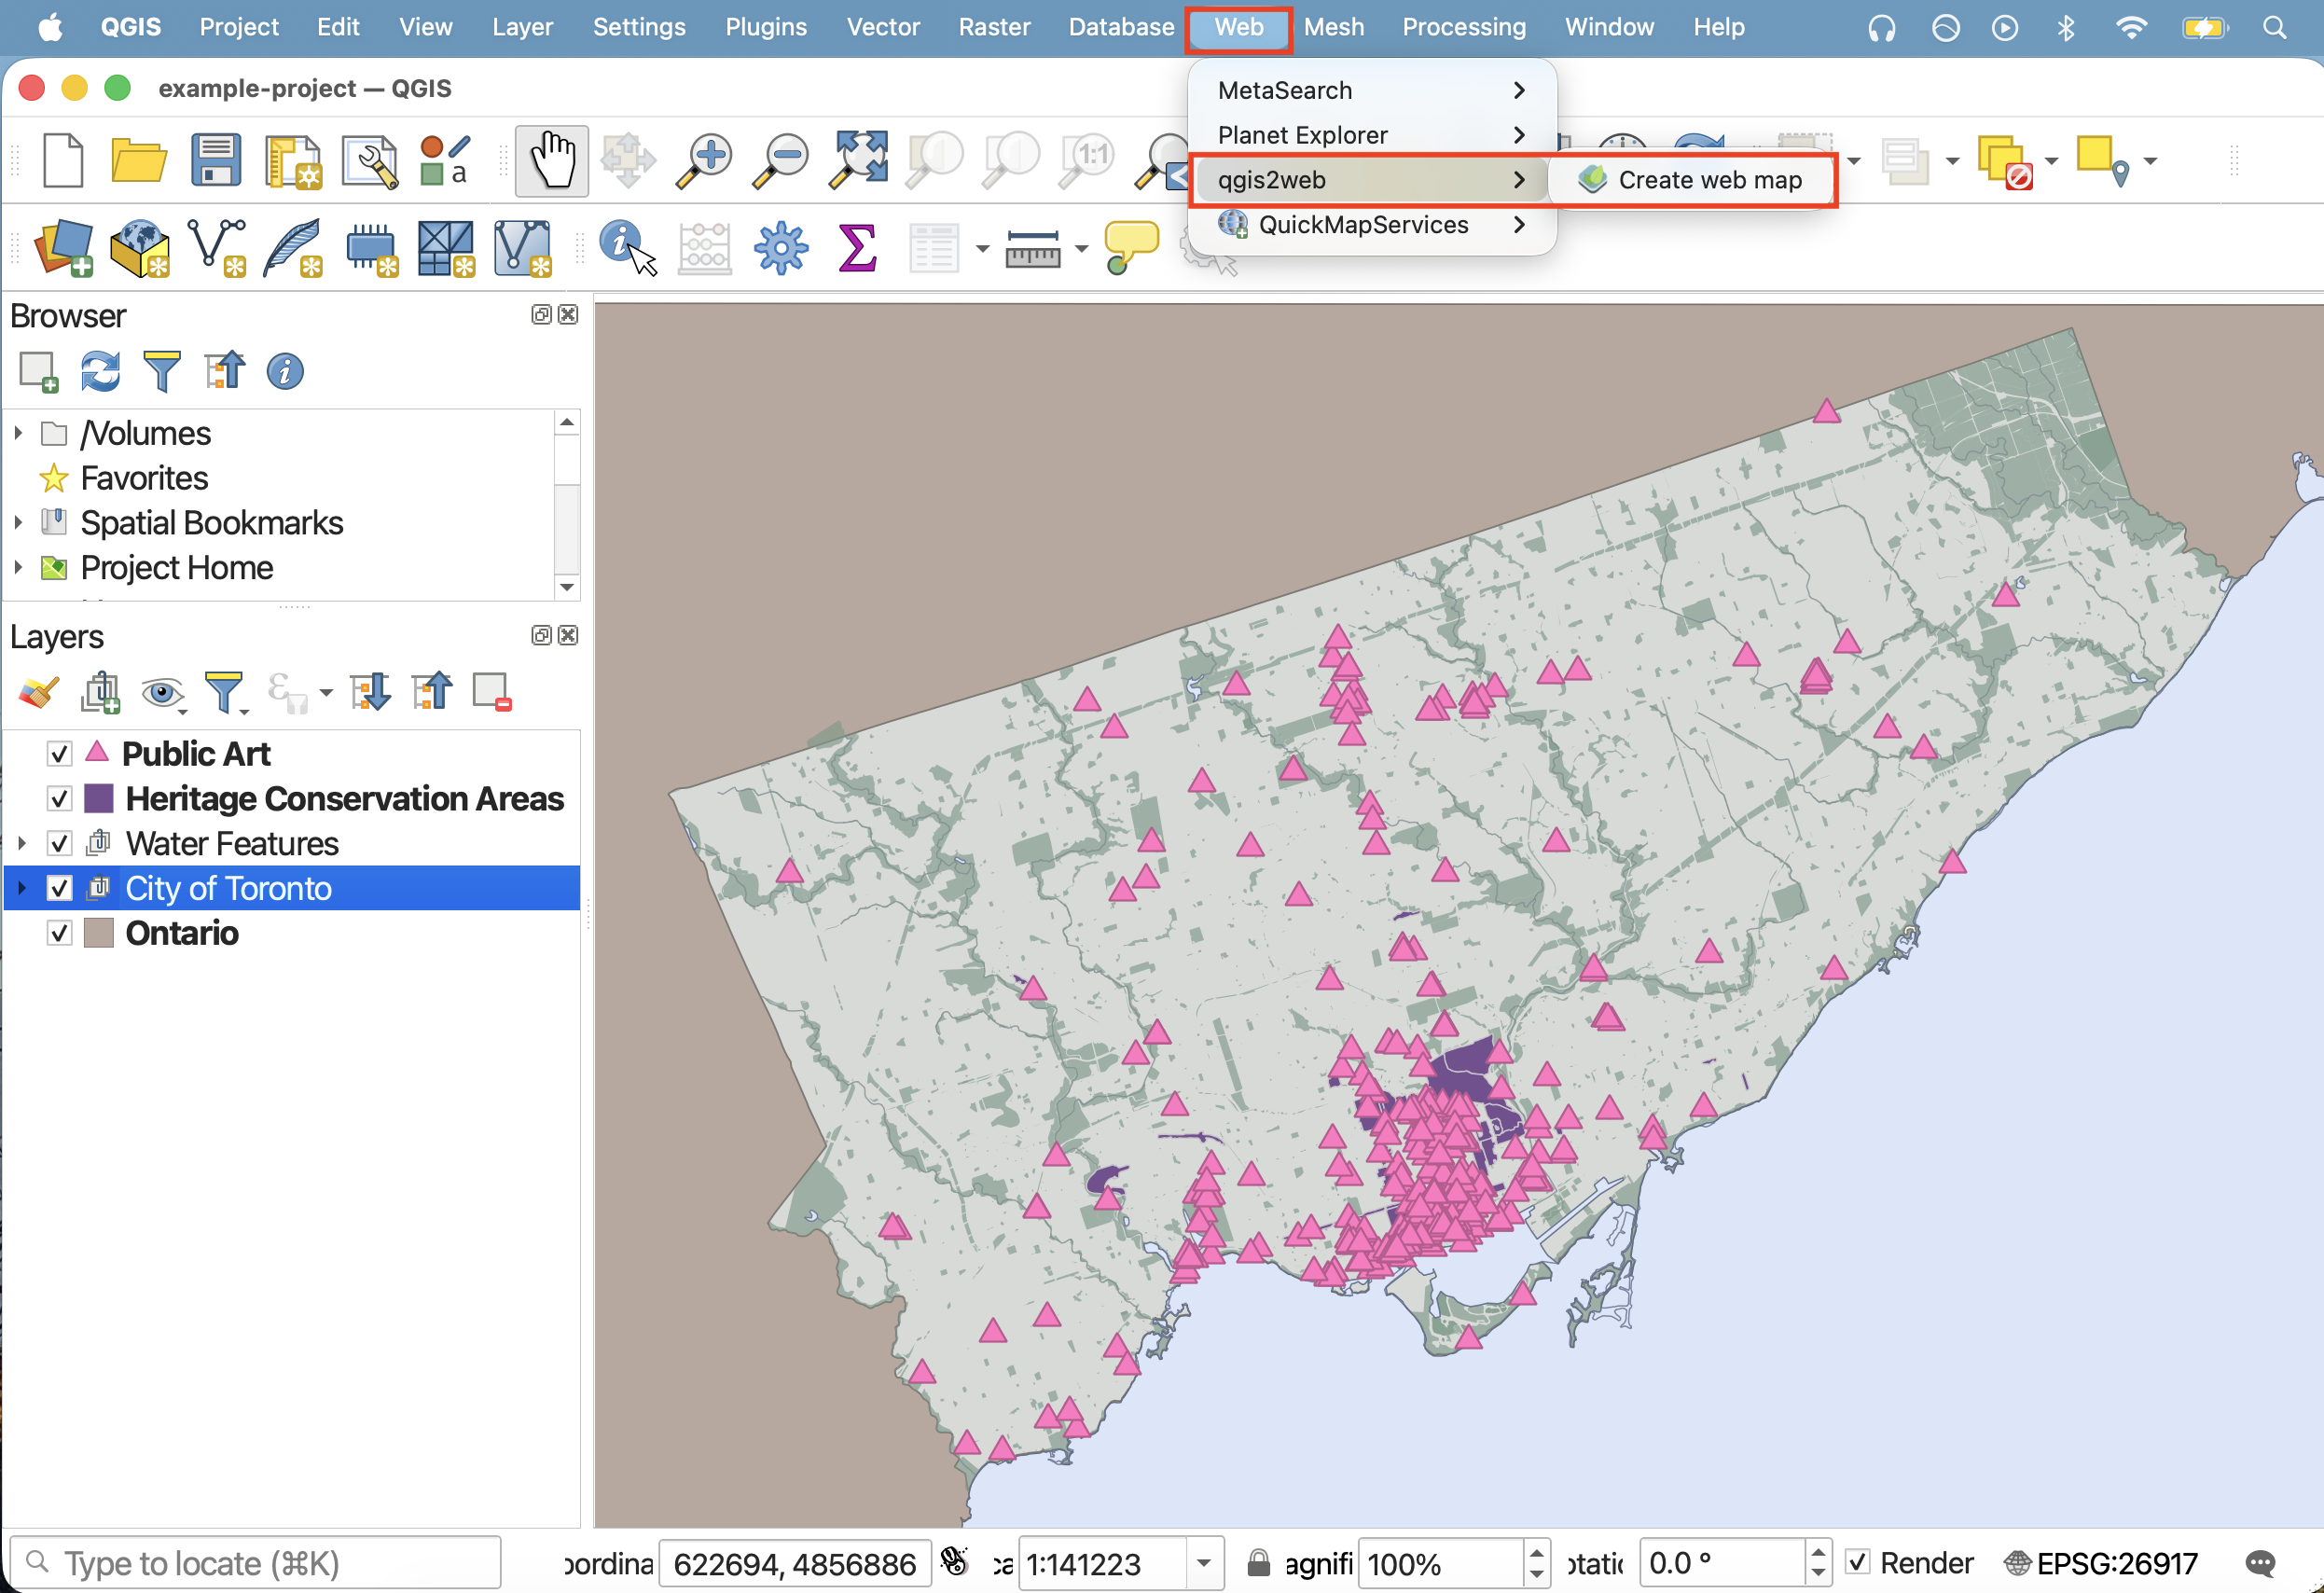
Before going on, take a moment to install the qgis2web plugin. Once installed, you’ll find it under the Web menu at the top of your screen.
Once installed, open the qgis2web plugin from the Web menu at the top of your screen. Chose Create web map.
2. Power your webmap with Leaflet
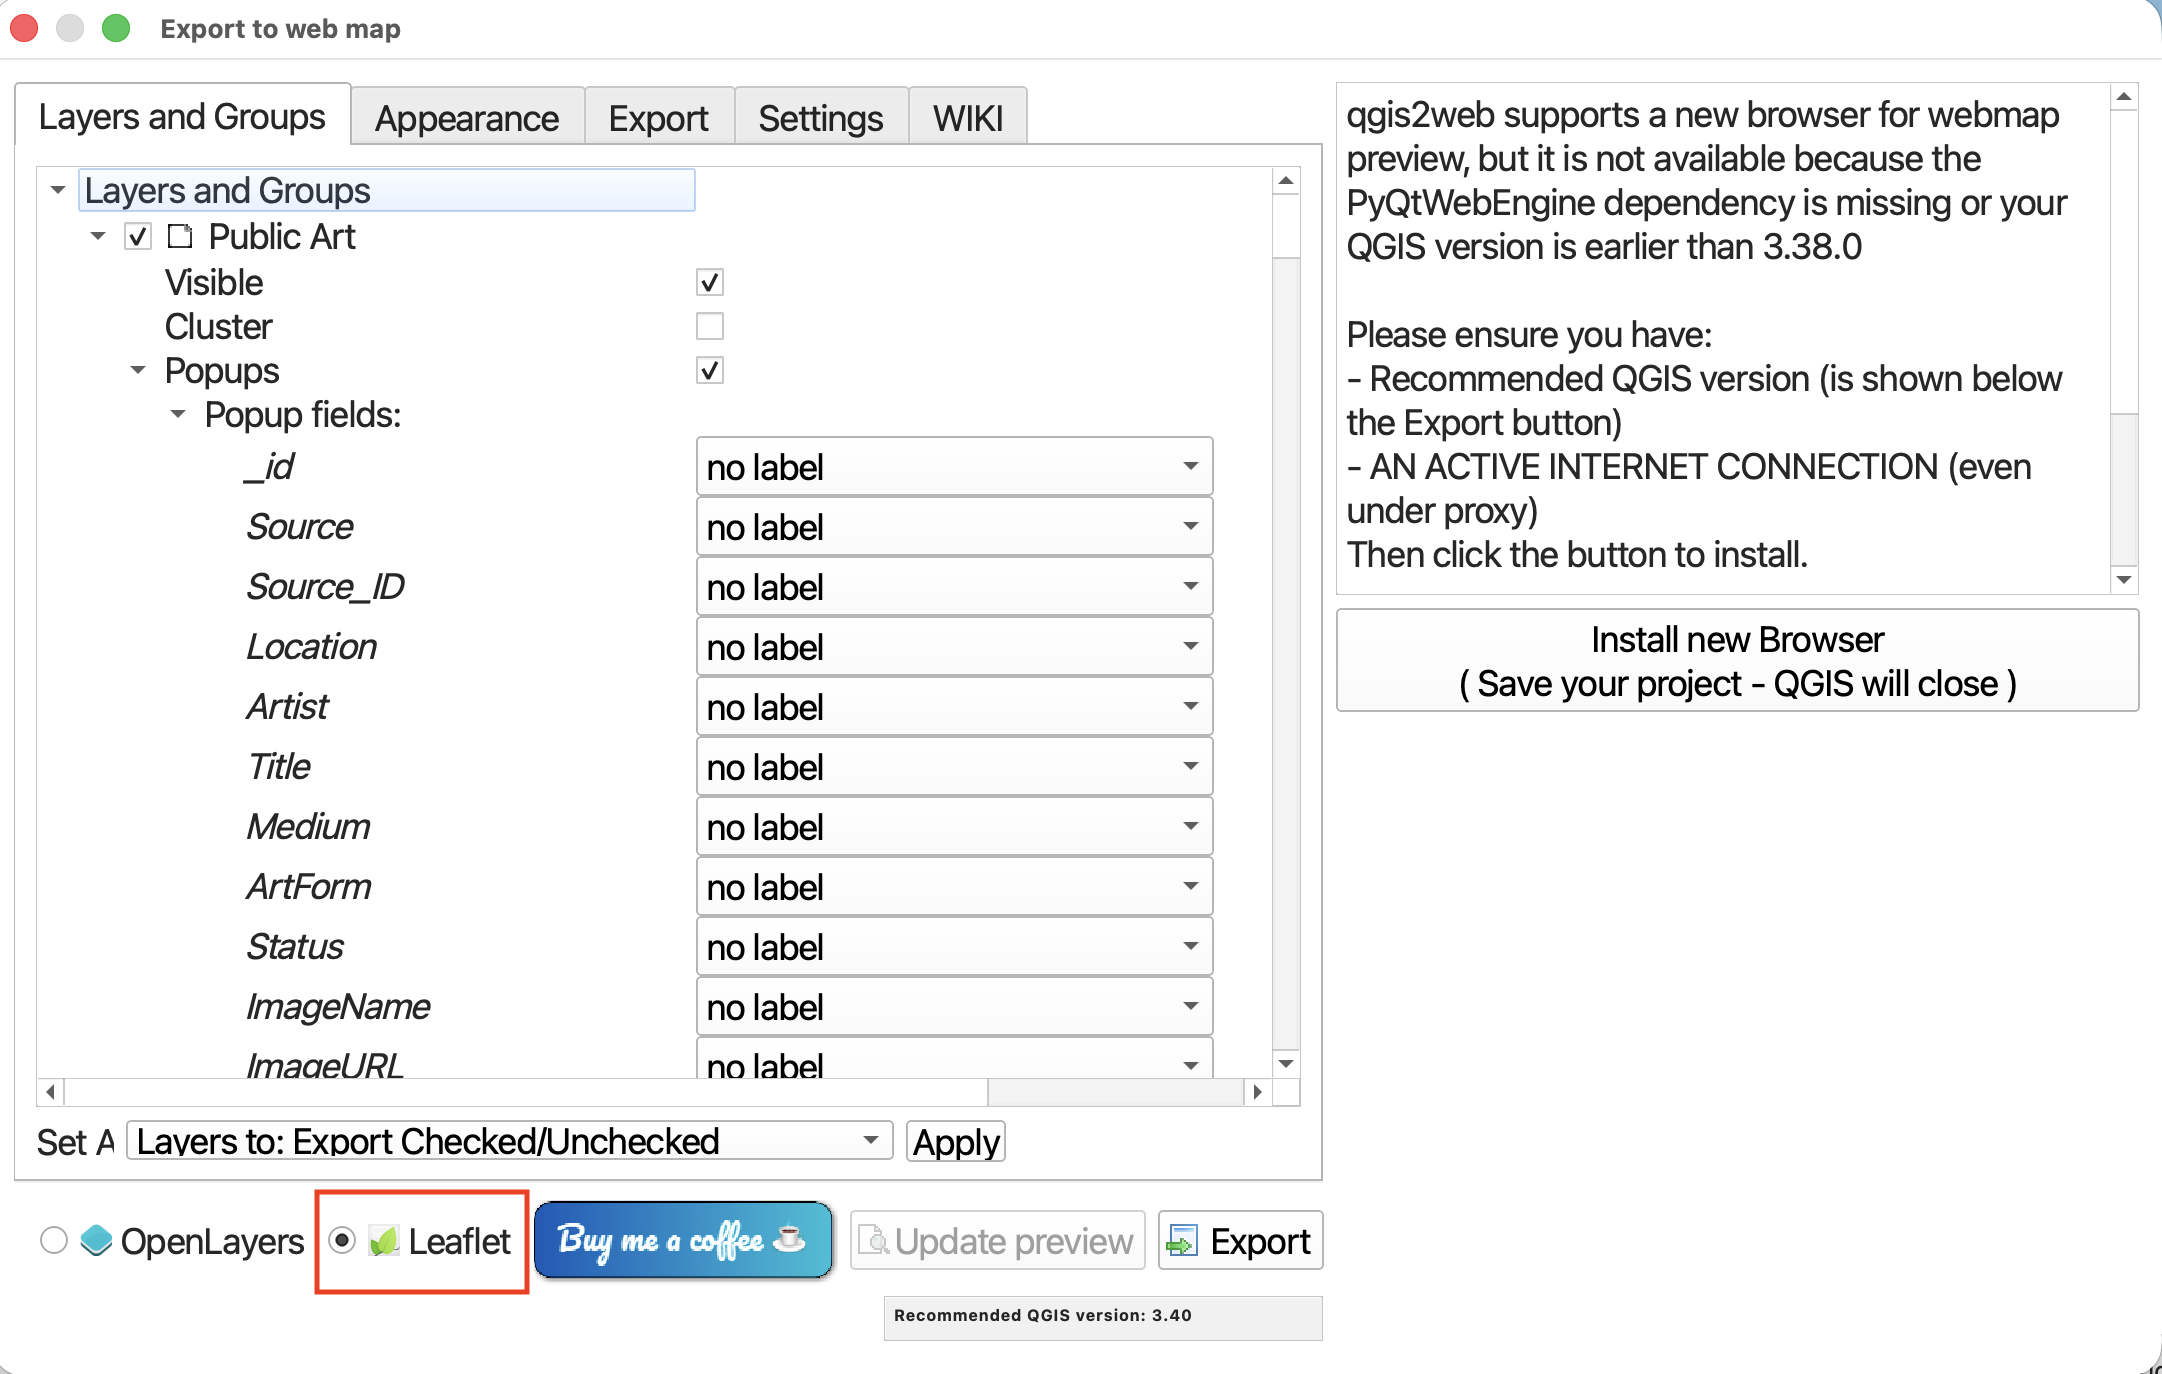
Change the code library powering your webmap to Leaflet. Leaflet is a free and open-source code library that powers the interactivity and symbology of webmaps.
3. Specify Layers and Groups
Layers and Groups refers to everything that was in your Layers Panel. At this point, you can decide which layers are added to your webmap, whether they are visible upon initial load, and whether or not they have popups (and if so, whether the contents of these popups are labeled). 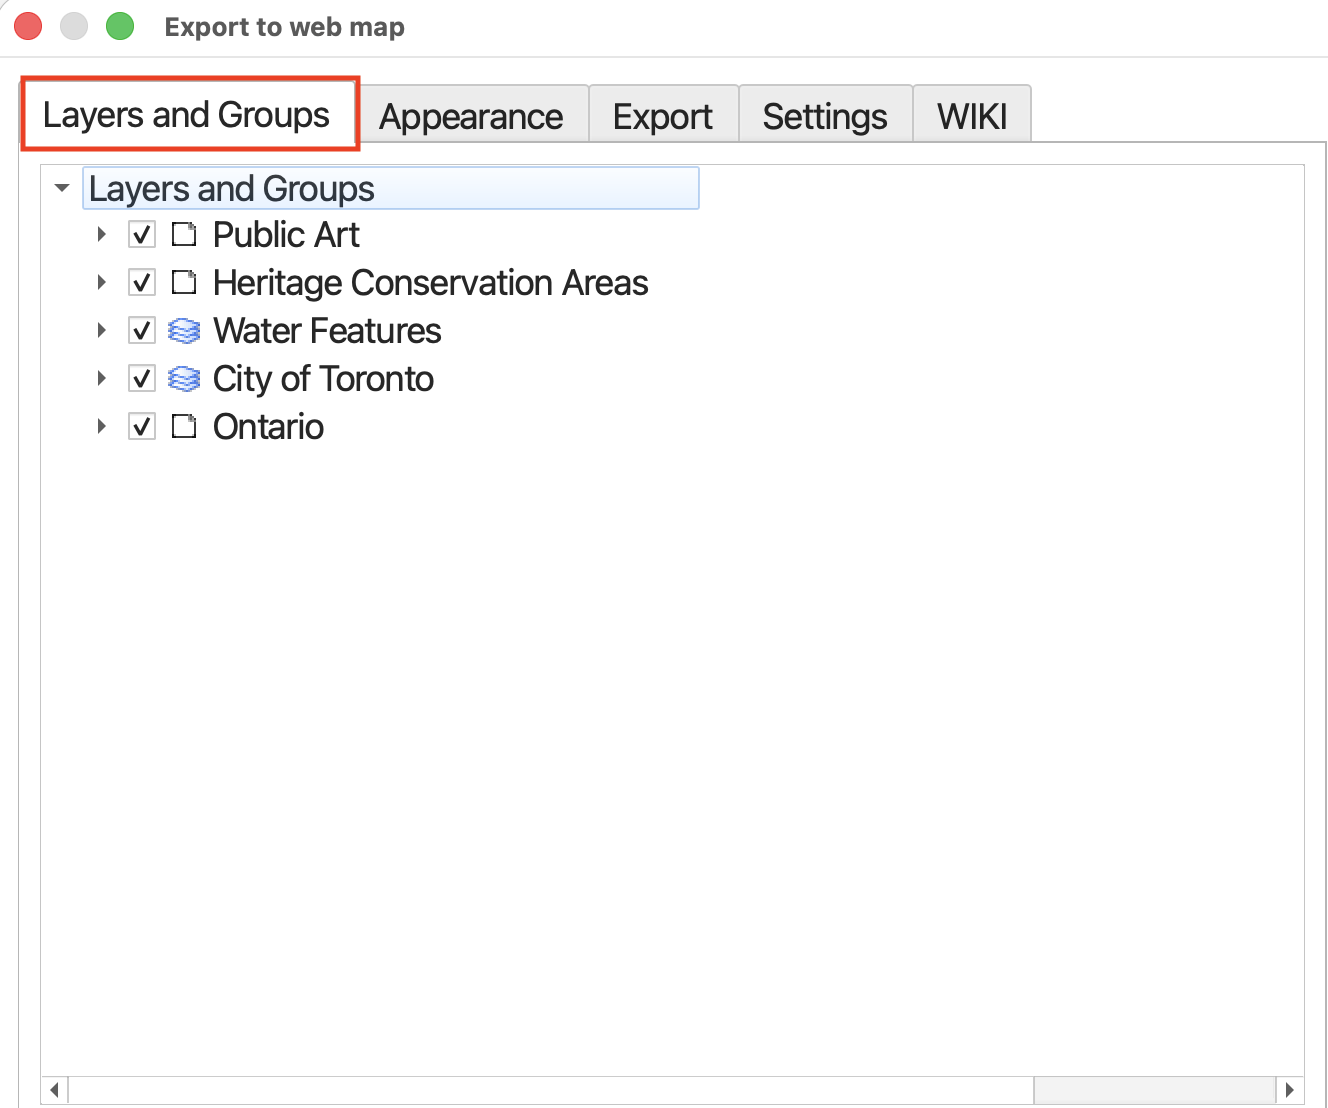
We will include all layers and groups in our output map. Additionally, all layers should be visible upon initial load. However, not all layers should have popups.
Ensure each layer and group is checked, and set to visible. then, Keep popups on only for Public art and Heritage Conservation Districts.
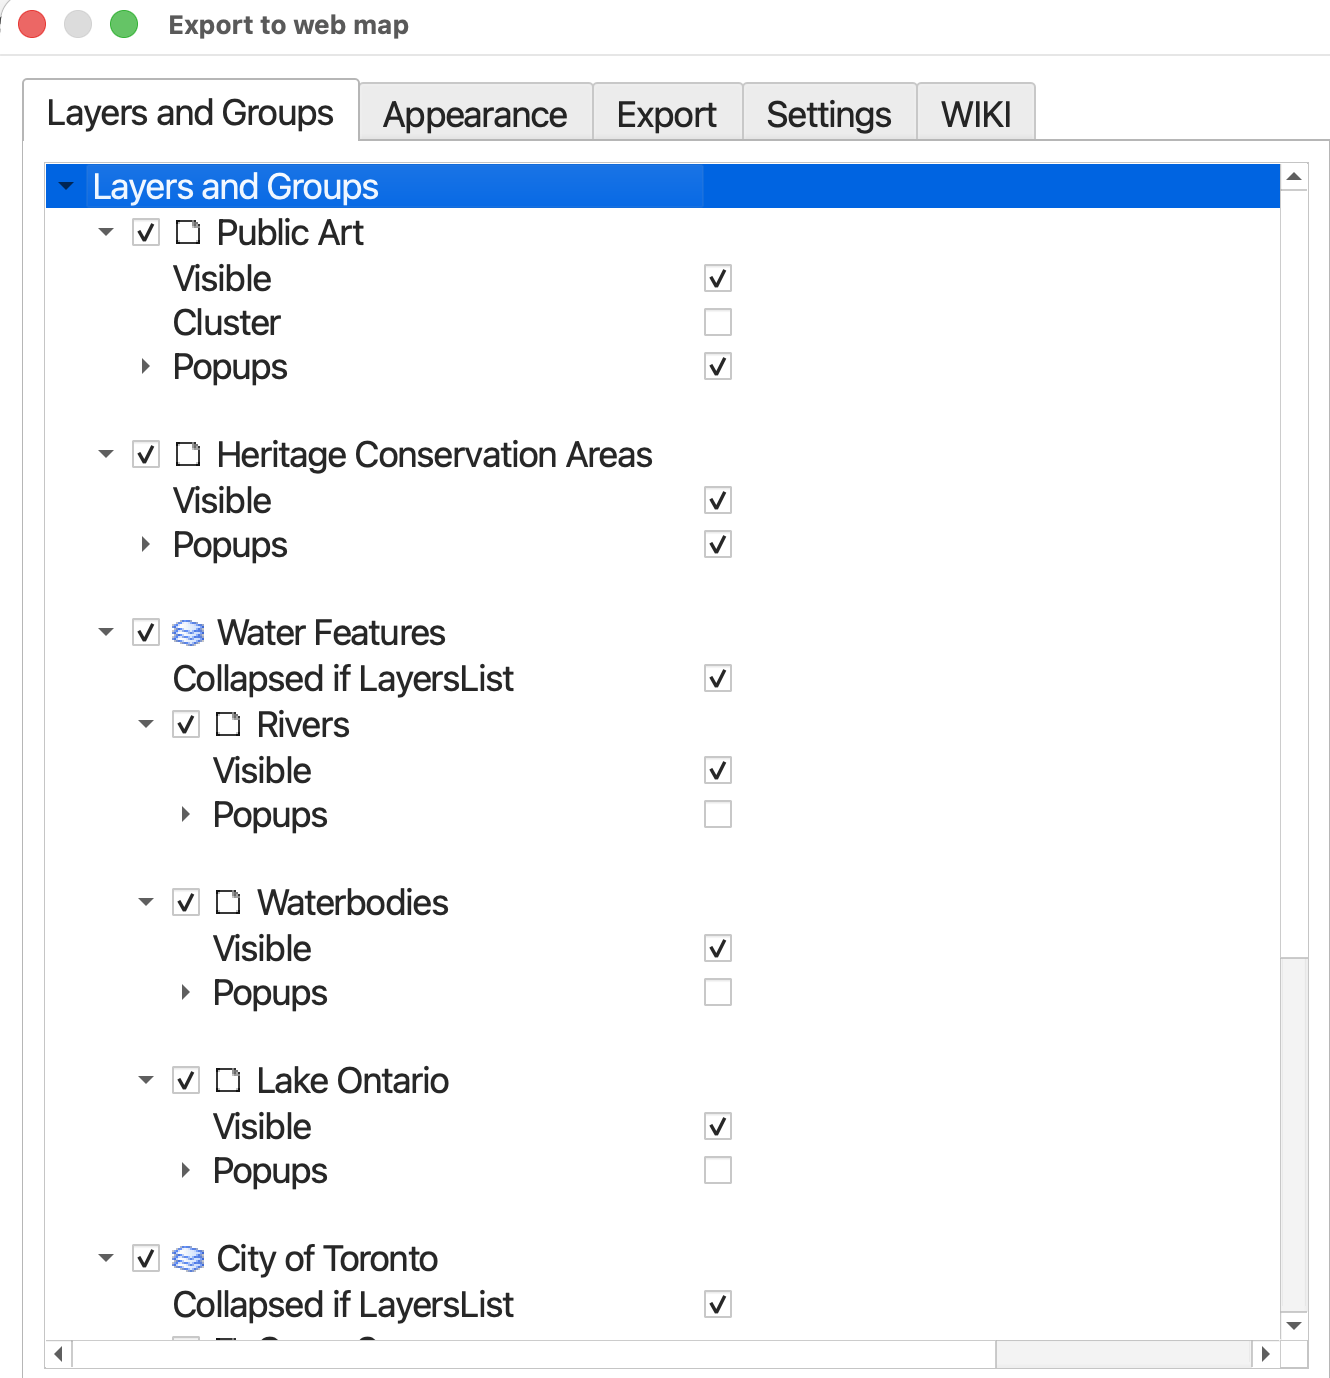
For two groups, Water Features and City of Toronto, keep the box checked that says Collapse if LayersList. This means that if a list of layers - legend, this feature group will be collapsed initially and viewer will have to expands if they want to see individual layers and toggle on/off.
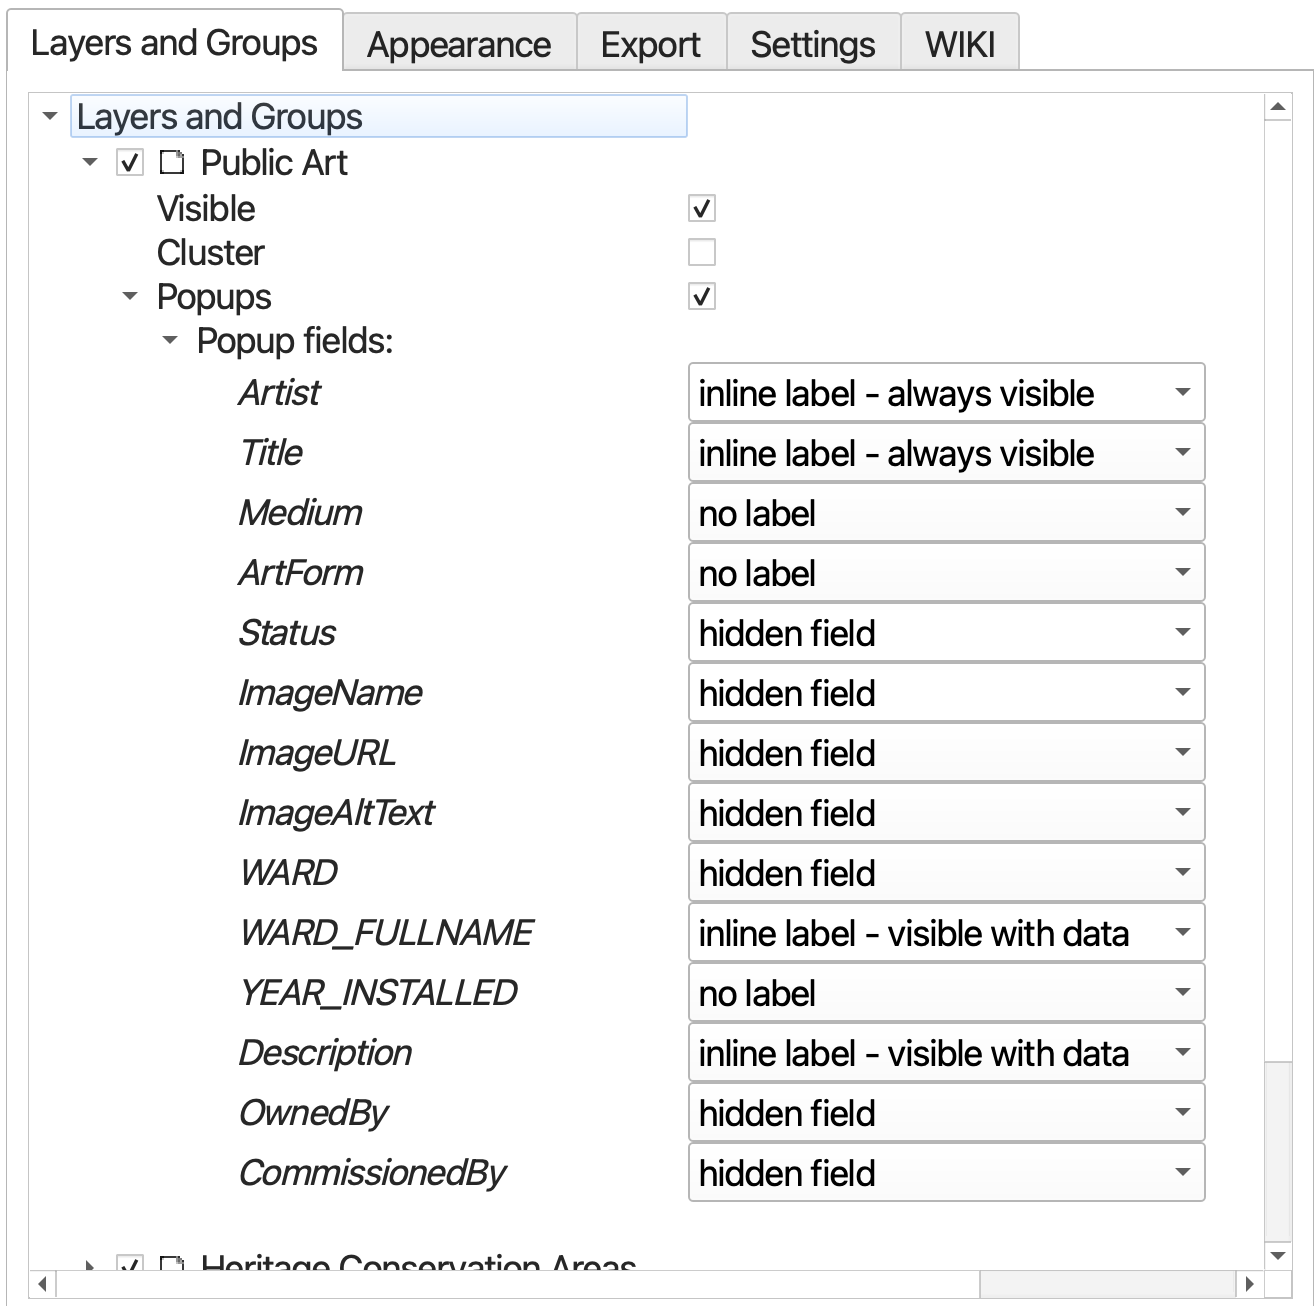
4. Configure Pop-ups
Now, to the popups for Public Art and Heritage conservation districts. Toggle from no label. if there are any attributes you don’t want to show, simply choose hidden field.
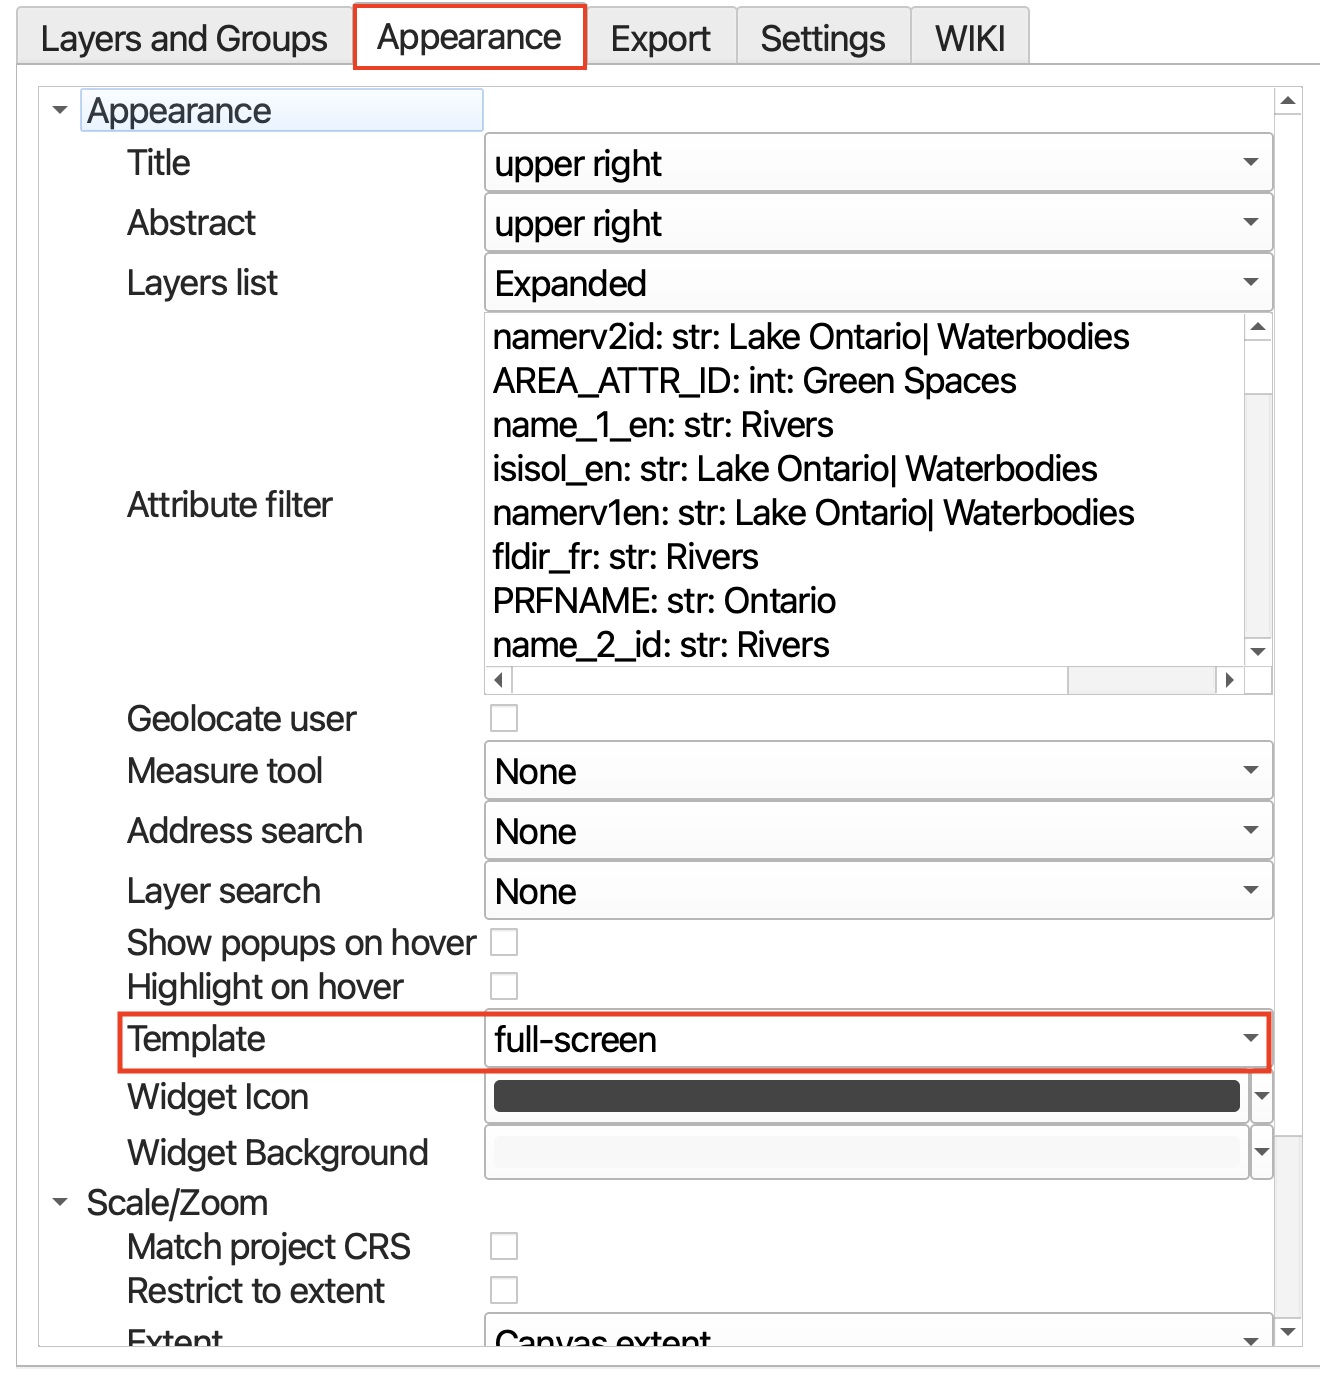
5. Set Appearance
In the Appearance tab, you can specify whether your webmap has a title and abstract, or description. You can also indicate whether you want your Layers list, or legend, expanded or collapsed upon initial load.
Change the Template to fullscreen. This will ensure your map takes up 100% of the screen by default, making it easier to adjust the size down the road. If we begin with it taking up only a portion of the screen, resizing becomes unnecessarily difficult.
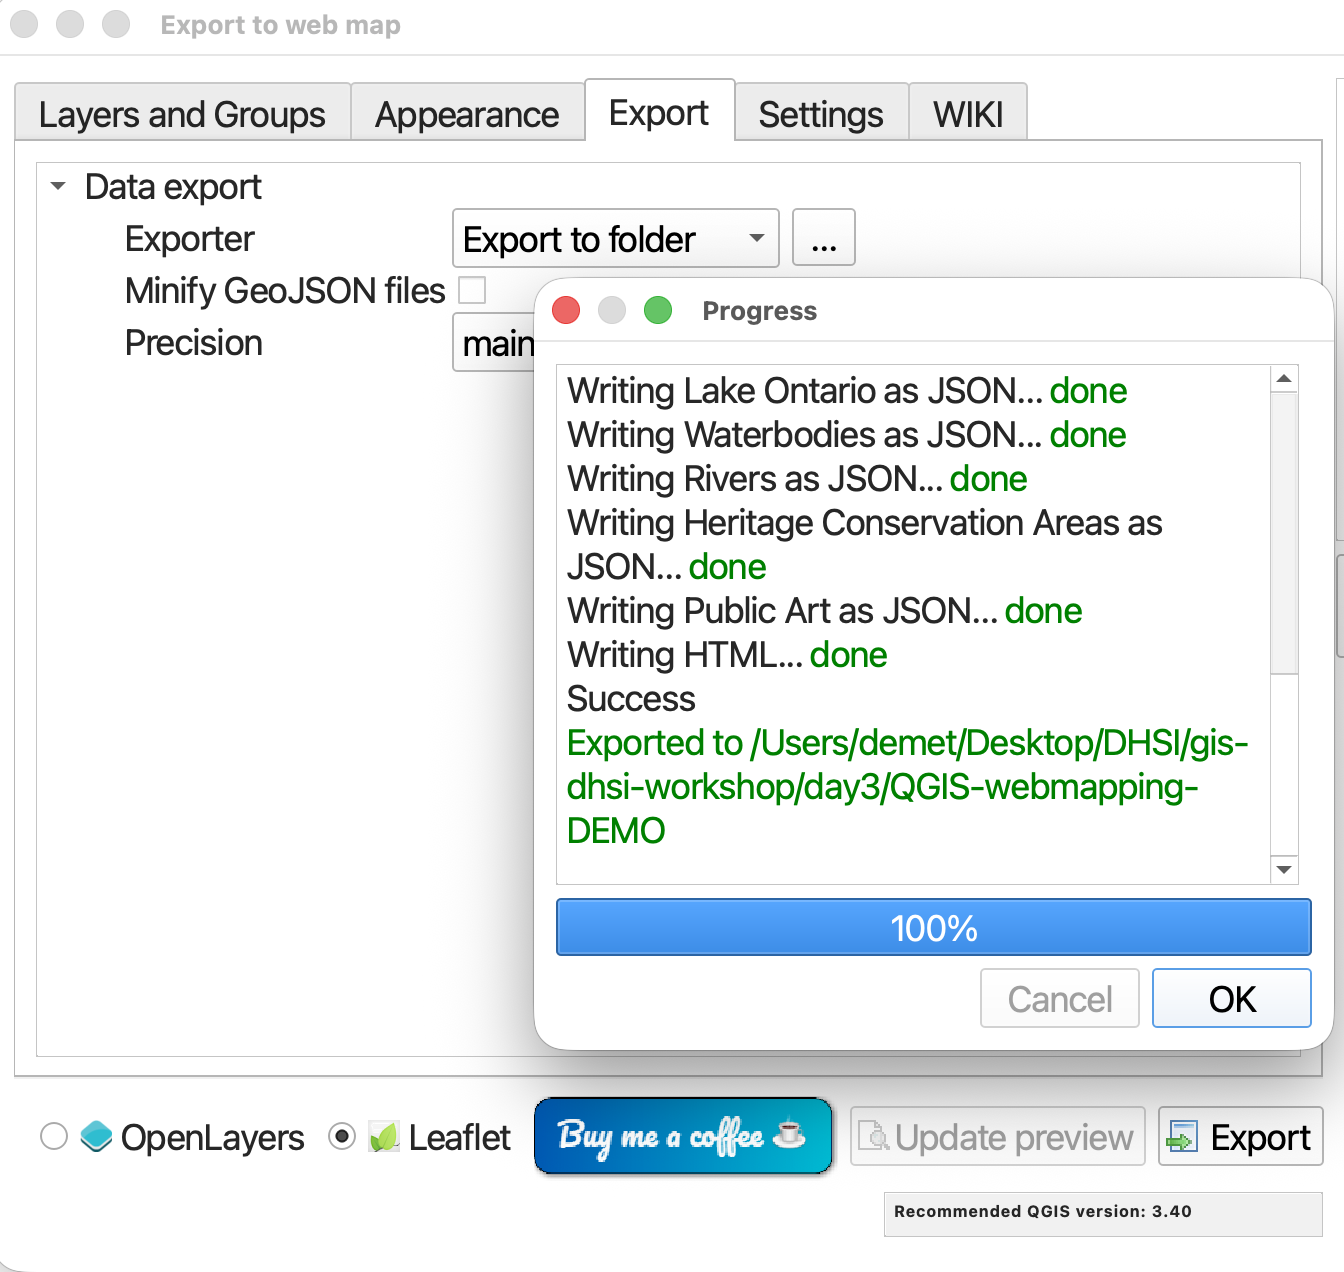
6. Export
It’s now time to export your map. Set the export folder to the workshop folder, but not the data subfolder. When the qgis2web tool runs, it will output a separate folder containing your data as well as the associated styling.
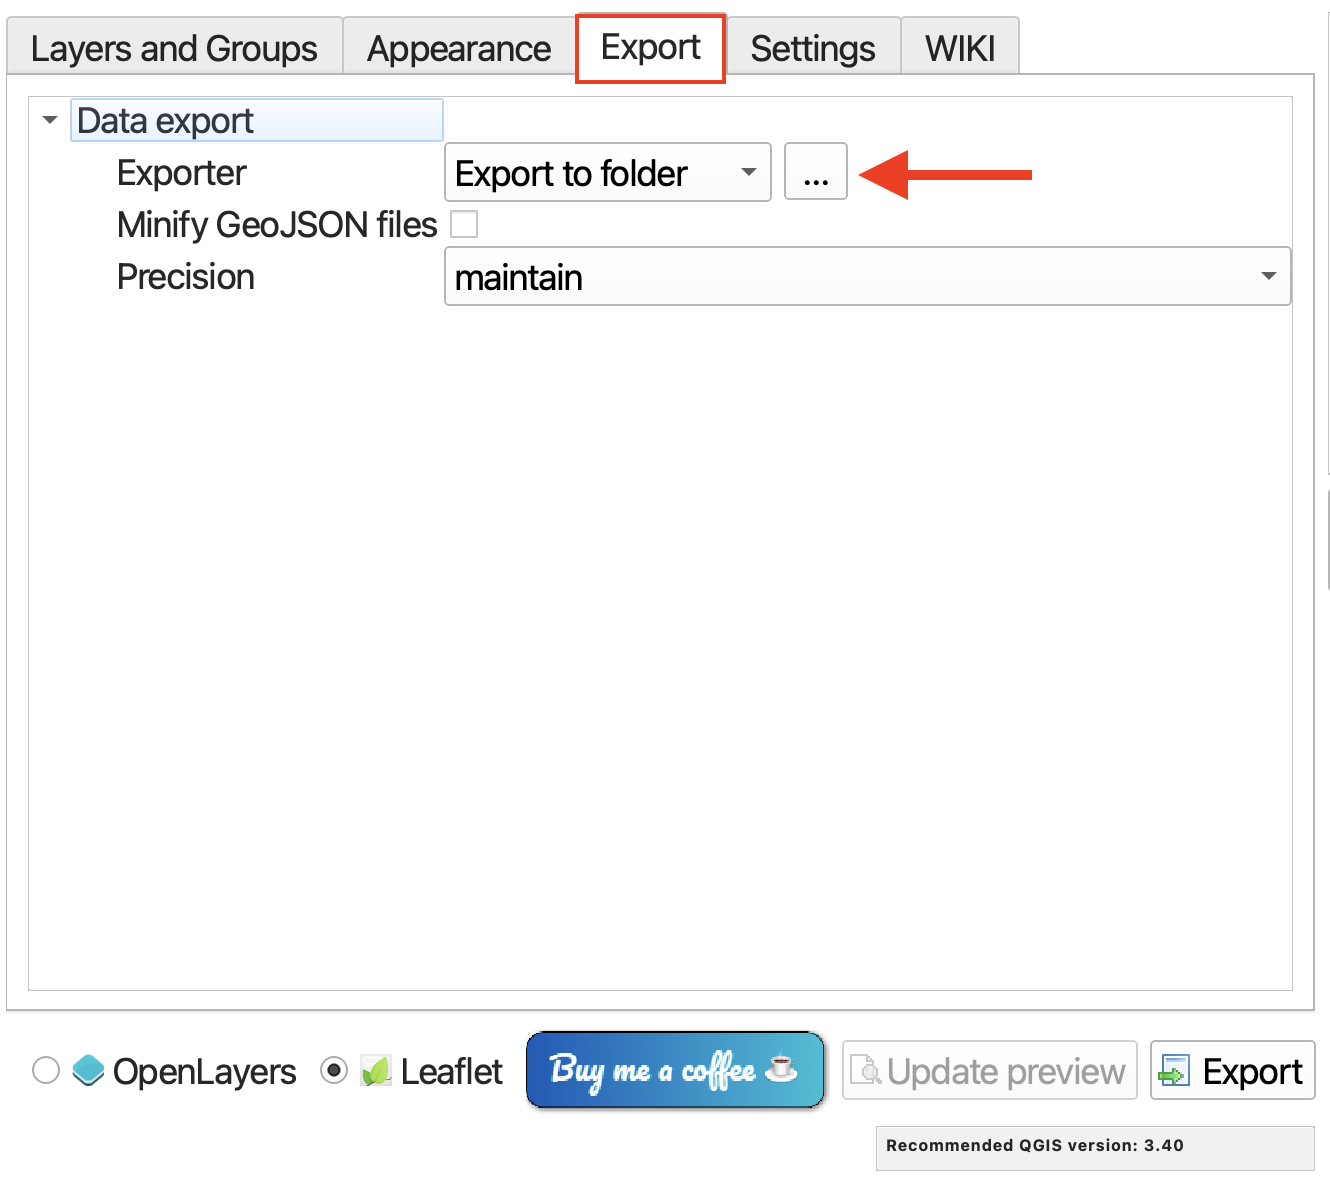
Uncheck minify geojson files. The files are not that large so this is not necessary.
Now, hit export. The run time should only be a moment as the datasets are not that large. You should get green messages if it works.
Explore your webmap
From your computer’s finder window, navigate to the workshop folder. Inside you should now see a new folder called qgis2web followed by the date. Open this folder.
Inside you will see a handful of subfolders.
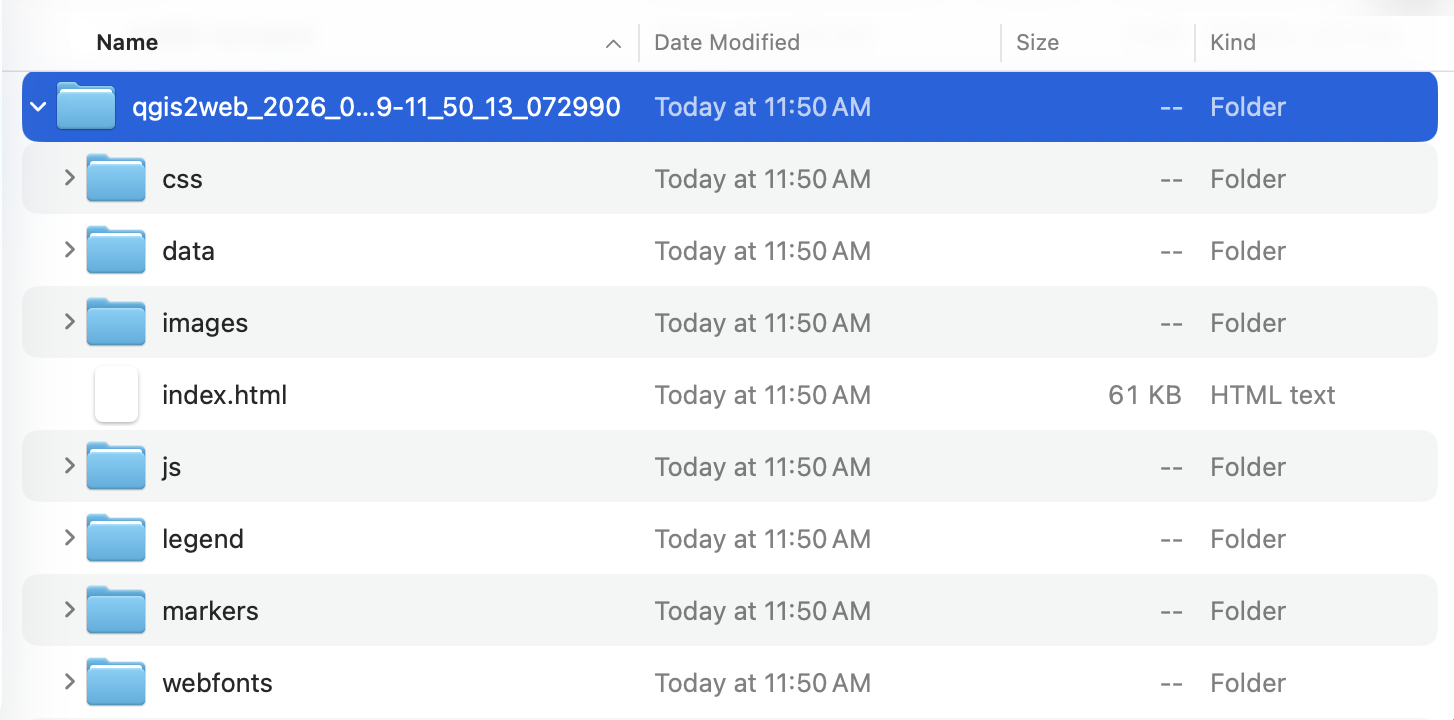
- css contains the cascading style sheets responsible for the synology of your map layers.
- data contains your data layers
- images contains any images
- js contains the javascript code which powers the interactivity of your webmap
- legend contains your legend’s icons
- markers would contain any markers on your map
- webfonts contains the font families of map text
There is also an index.html document. Html, or hyper text markup language, is the language read by web browsers. Either double-click this file or right-click and choose to open it with a web browser of your choice. Google Chrome is recommended. (DuckDuckGo sometimes doesn’t work.)
Your webmap should load in a web browser: 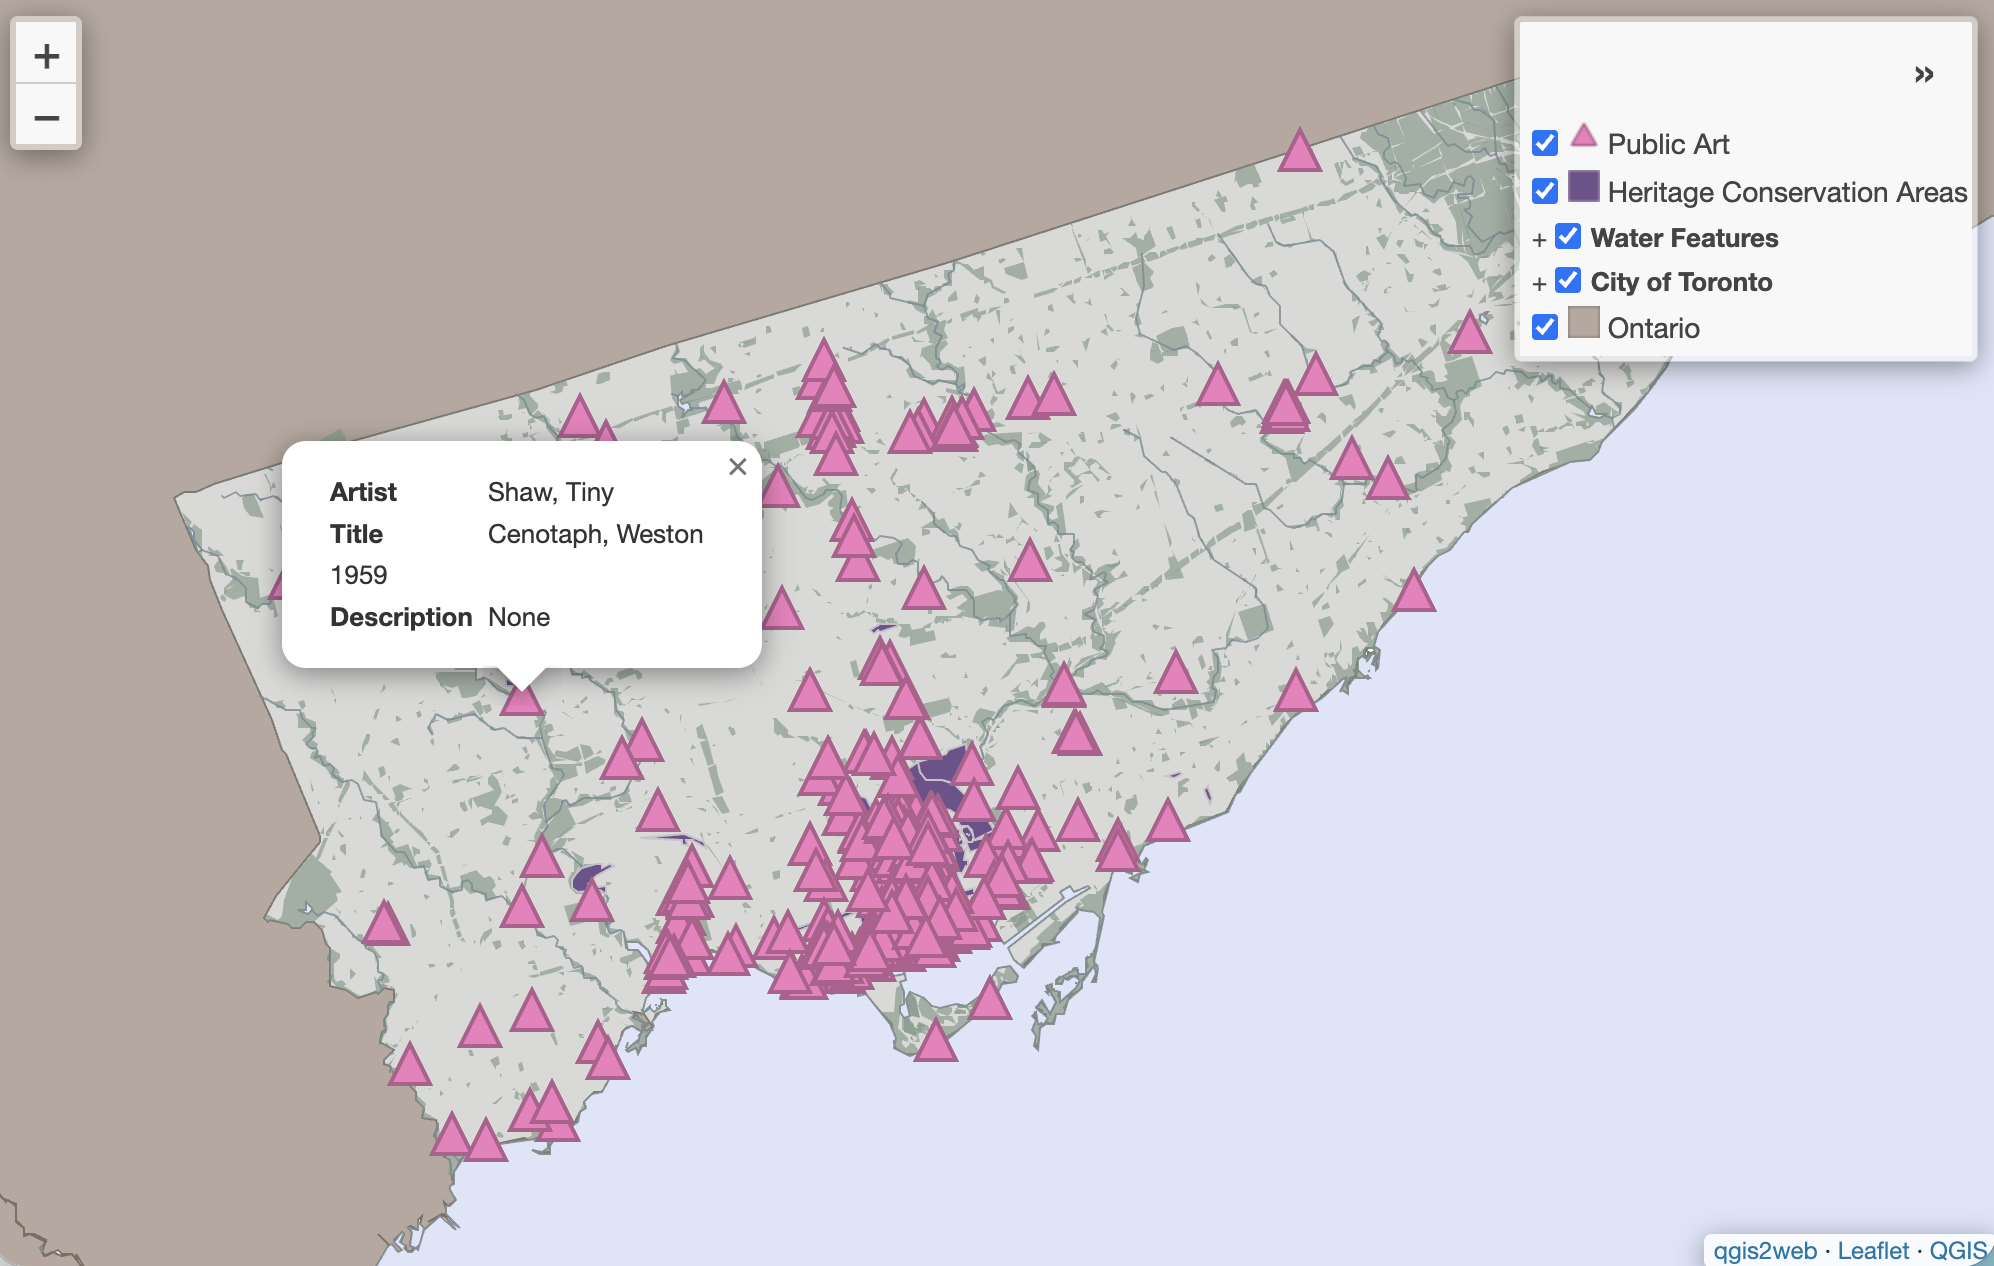
Try interacting with your map!
- Check and uncheck the visibility of different layers
- Collapse and expand the layers list
- Zoom in and zoom out; pan around
- Click on different points and explore the pop-up information
Make note of the attribution at the bottom right corner of your webmap.
If you want to change anything, you can always return to QGIS and re-run qgis2web. It will create a new output folder each time. Though each successive output folder will be date and timestamped, it’s helpful to delete or discard deprecated folders so as to remain organized.
Notice the file path in your browser’s search bar. You should recognize it as referencing the location of your qgis2web output’s index.html file local to your computer. Because this map is stored on your local device, it can’t be searched via the web by others. To share the map as is, you’d have to send the entire folder to someone along with instructions on how to download and open your map. The next page will guide you through making this map accessible via the web.
Loading last updated date...