Spatial Data
Learning Objective 2: Be able to identify different kinds of spatial data.
A Geographic Information System (GIS) works with data that is tied to a location on Earth. This type of data is often referred to as “spatial data”, “geospatial data”, or even “GIS data”, and is spatially referenced using location information — most commonly geographic coordinates. A GIS uses this location information to project a geospatial file into a virtual geographic space where it can then be visualized and manipulated. If your data’s locative information is in the form of text — for example, country/city names or street addresses — this can be made legible to a GIS with a few extra steps (see geocoding). You may have to create new columns and populate them with coordinate information.
Raster vs. Vector Data
There are 2 main types of geospatial data: vector and raster.
Raster data is made up of pixels arranged in a grid, whereas vector data is made up of vertices and the paths between them that create geometries representing real-world features. If you’re working with continuous geospatial phenomena such as satellite imagery, topography, or climatic data (like rainfall or temperature), you’re likely using raster data. If you’re working with points, lines, or polygons, that’s likely vector data.
Vector Data
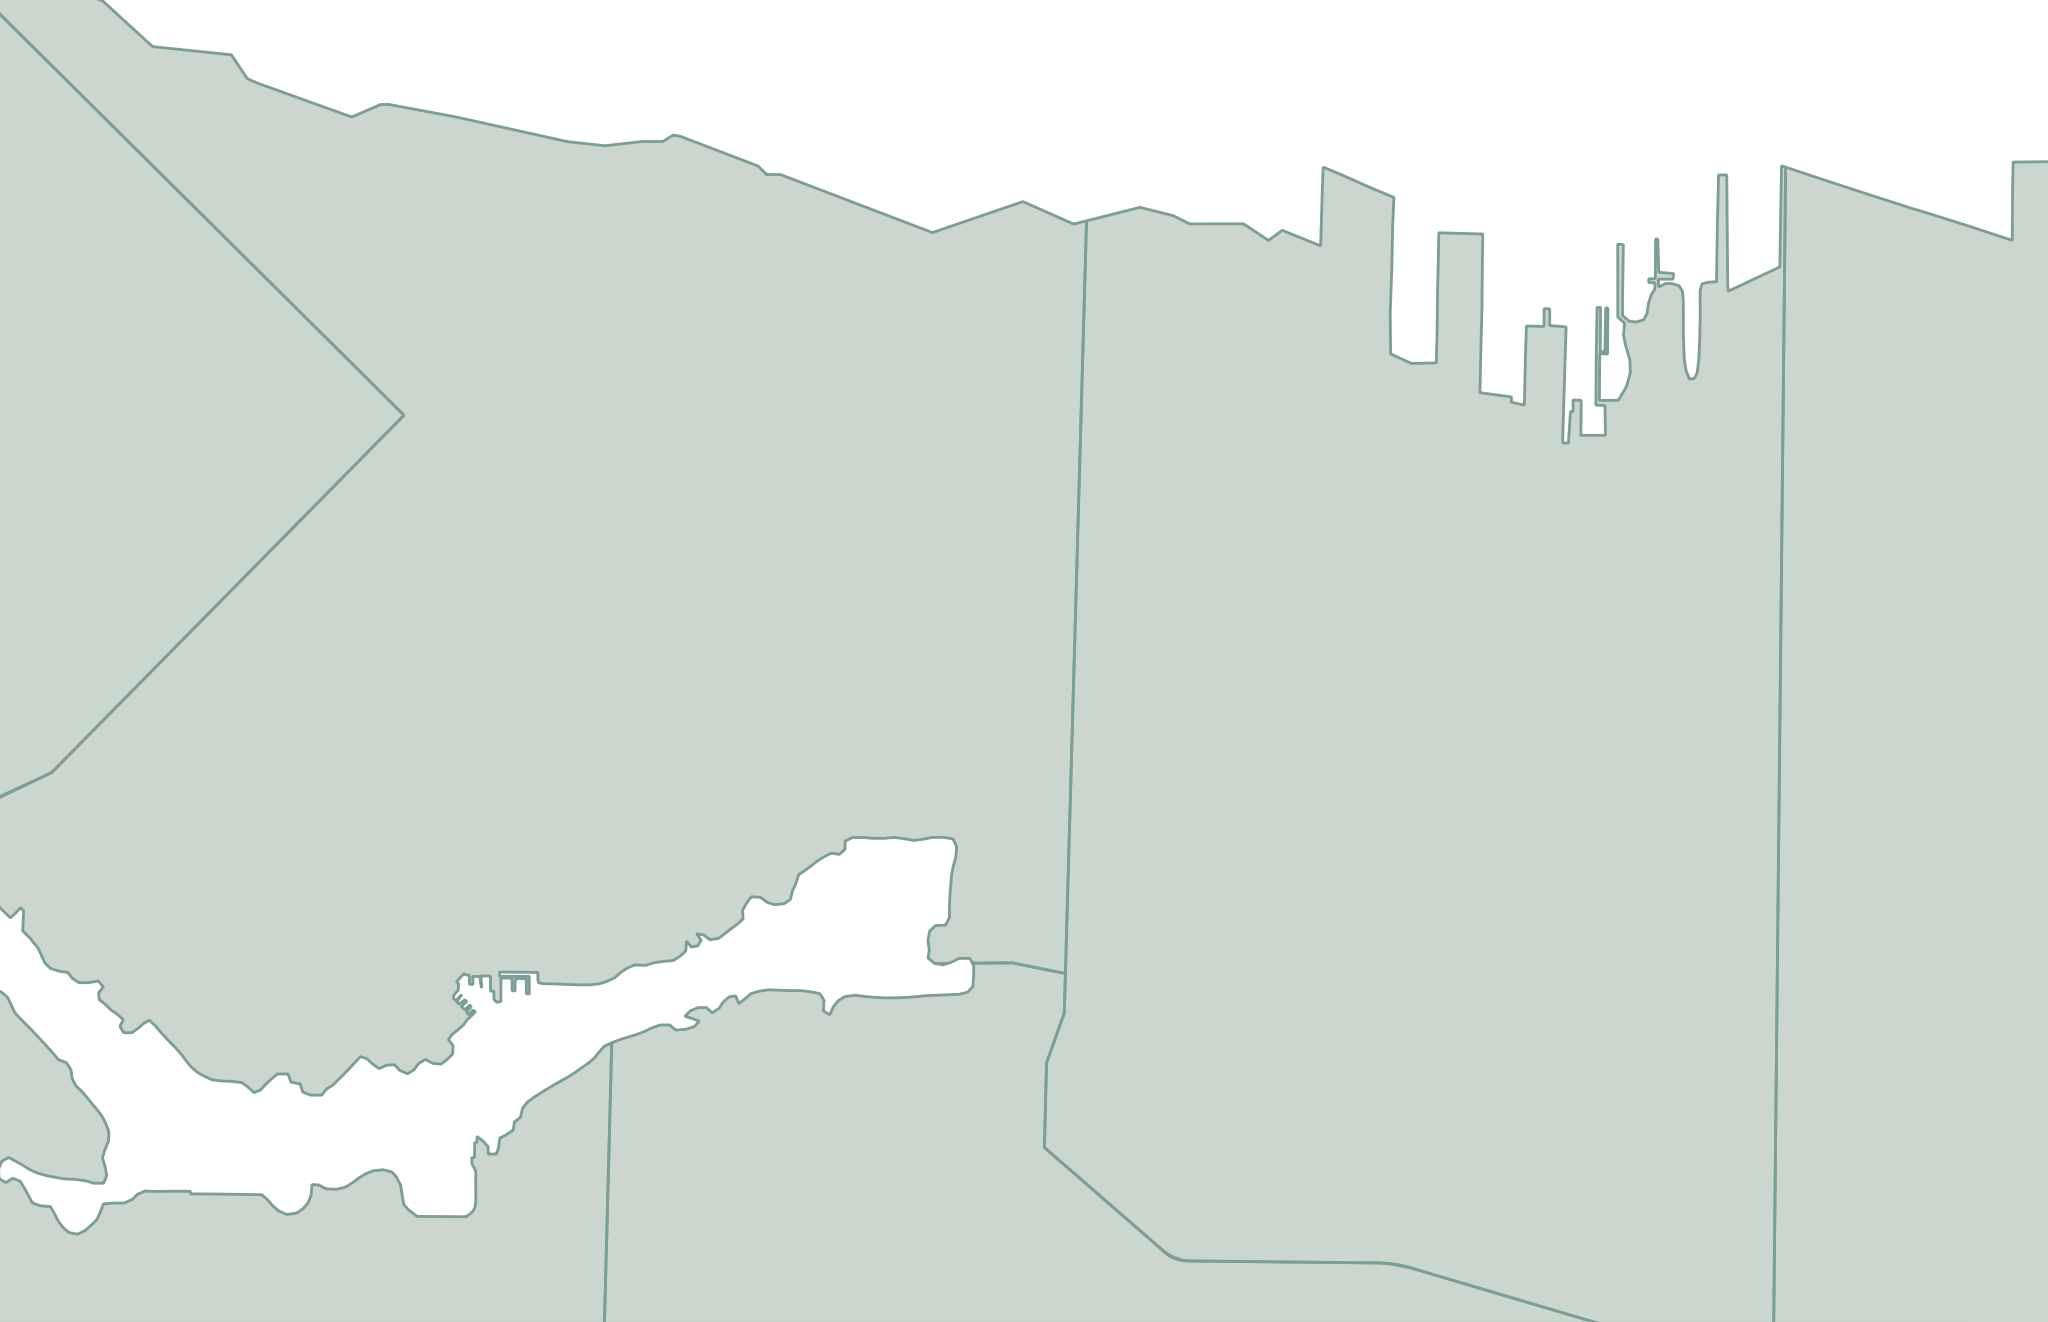
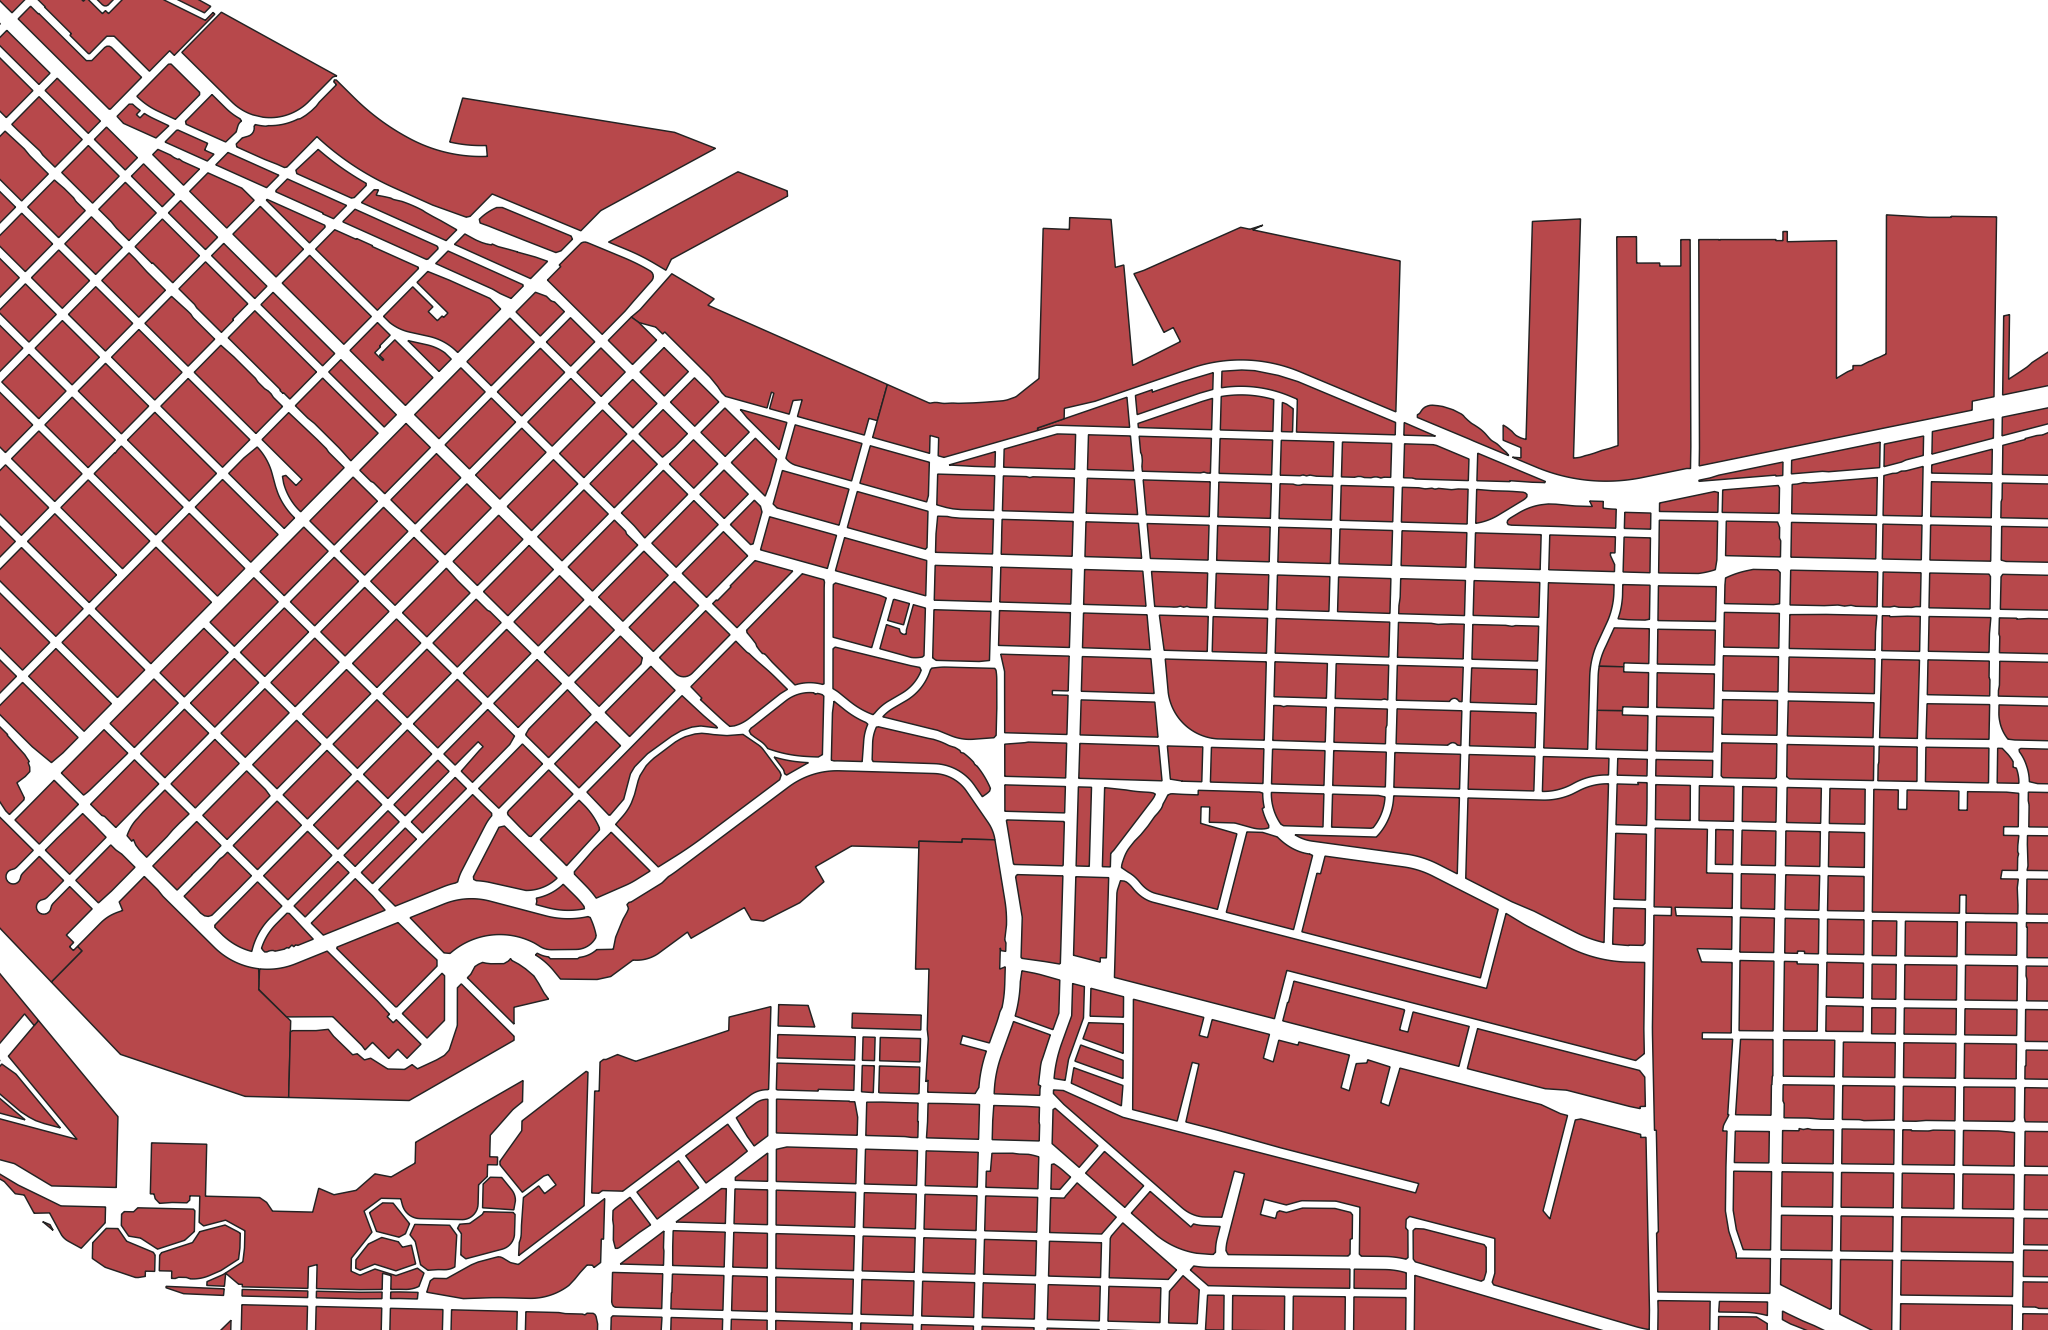
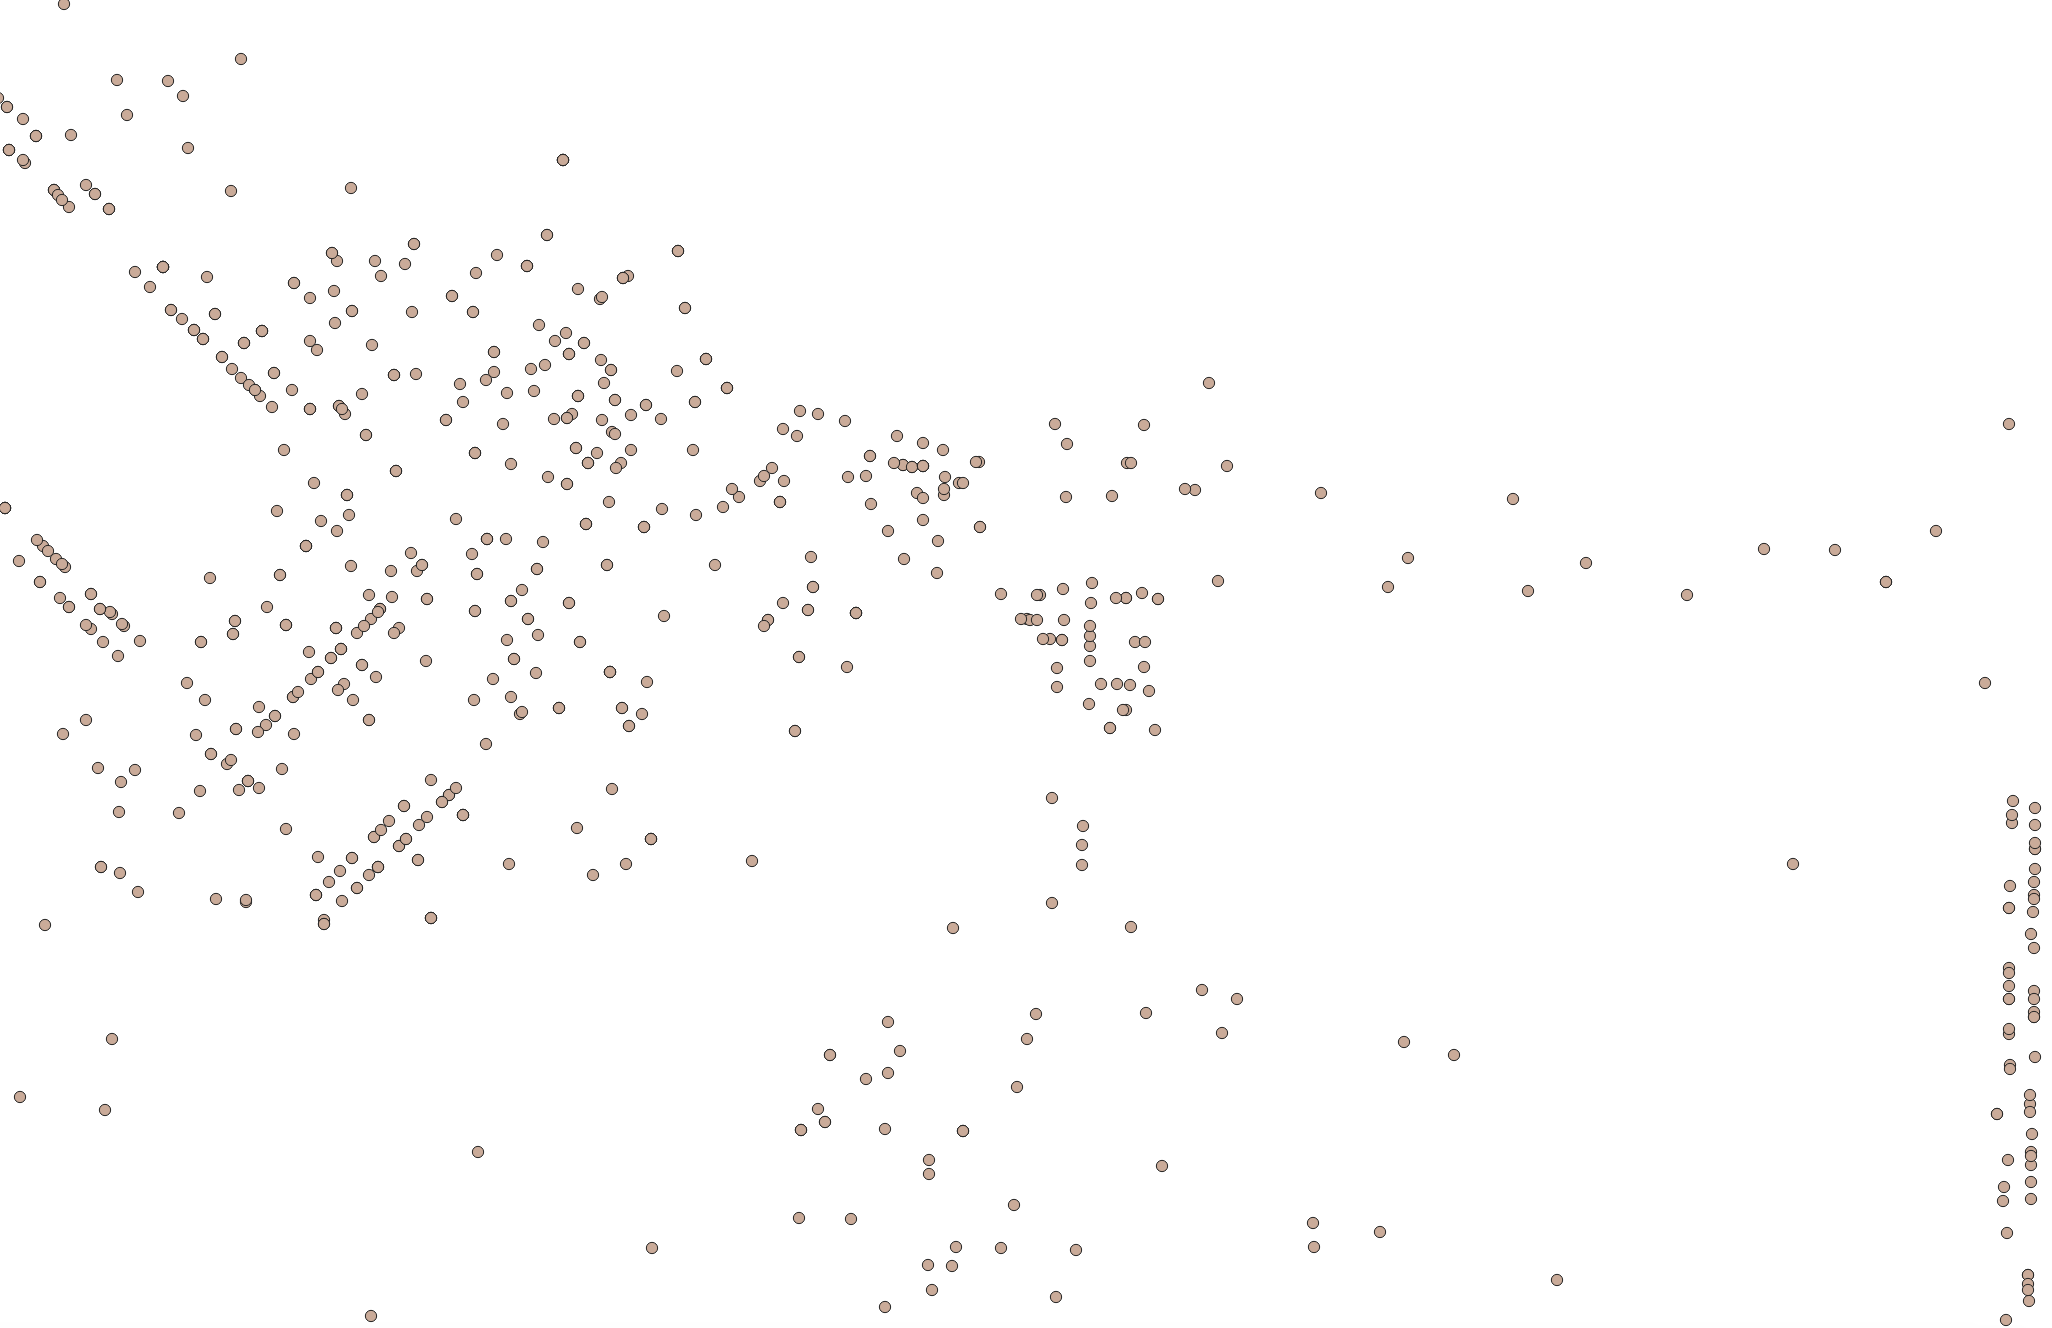
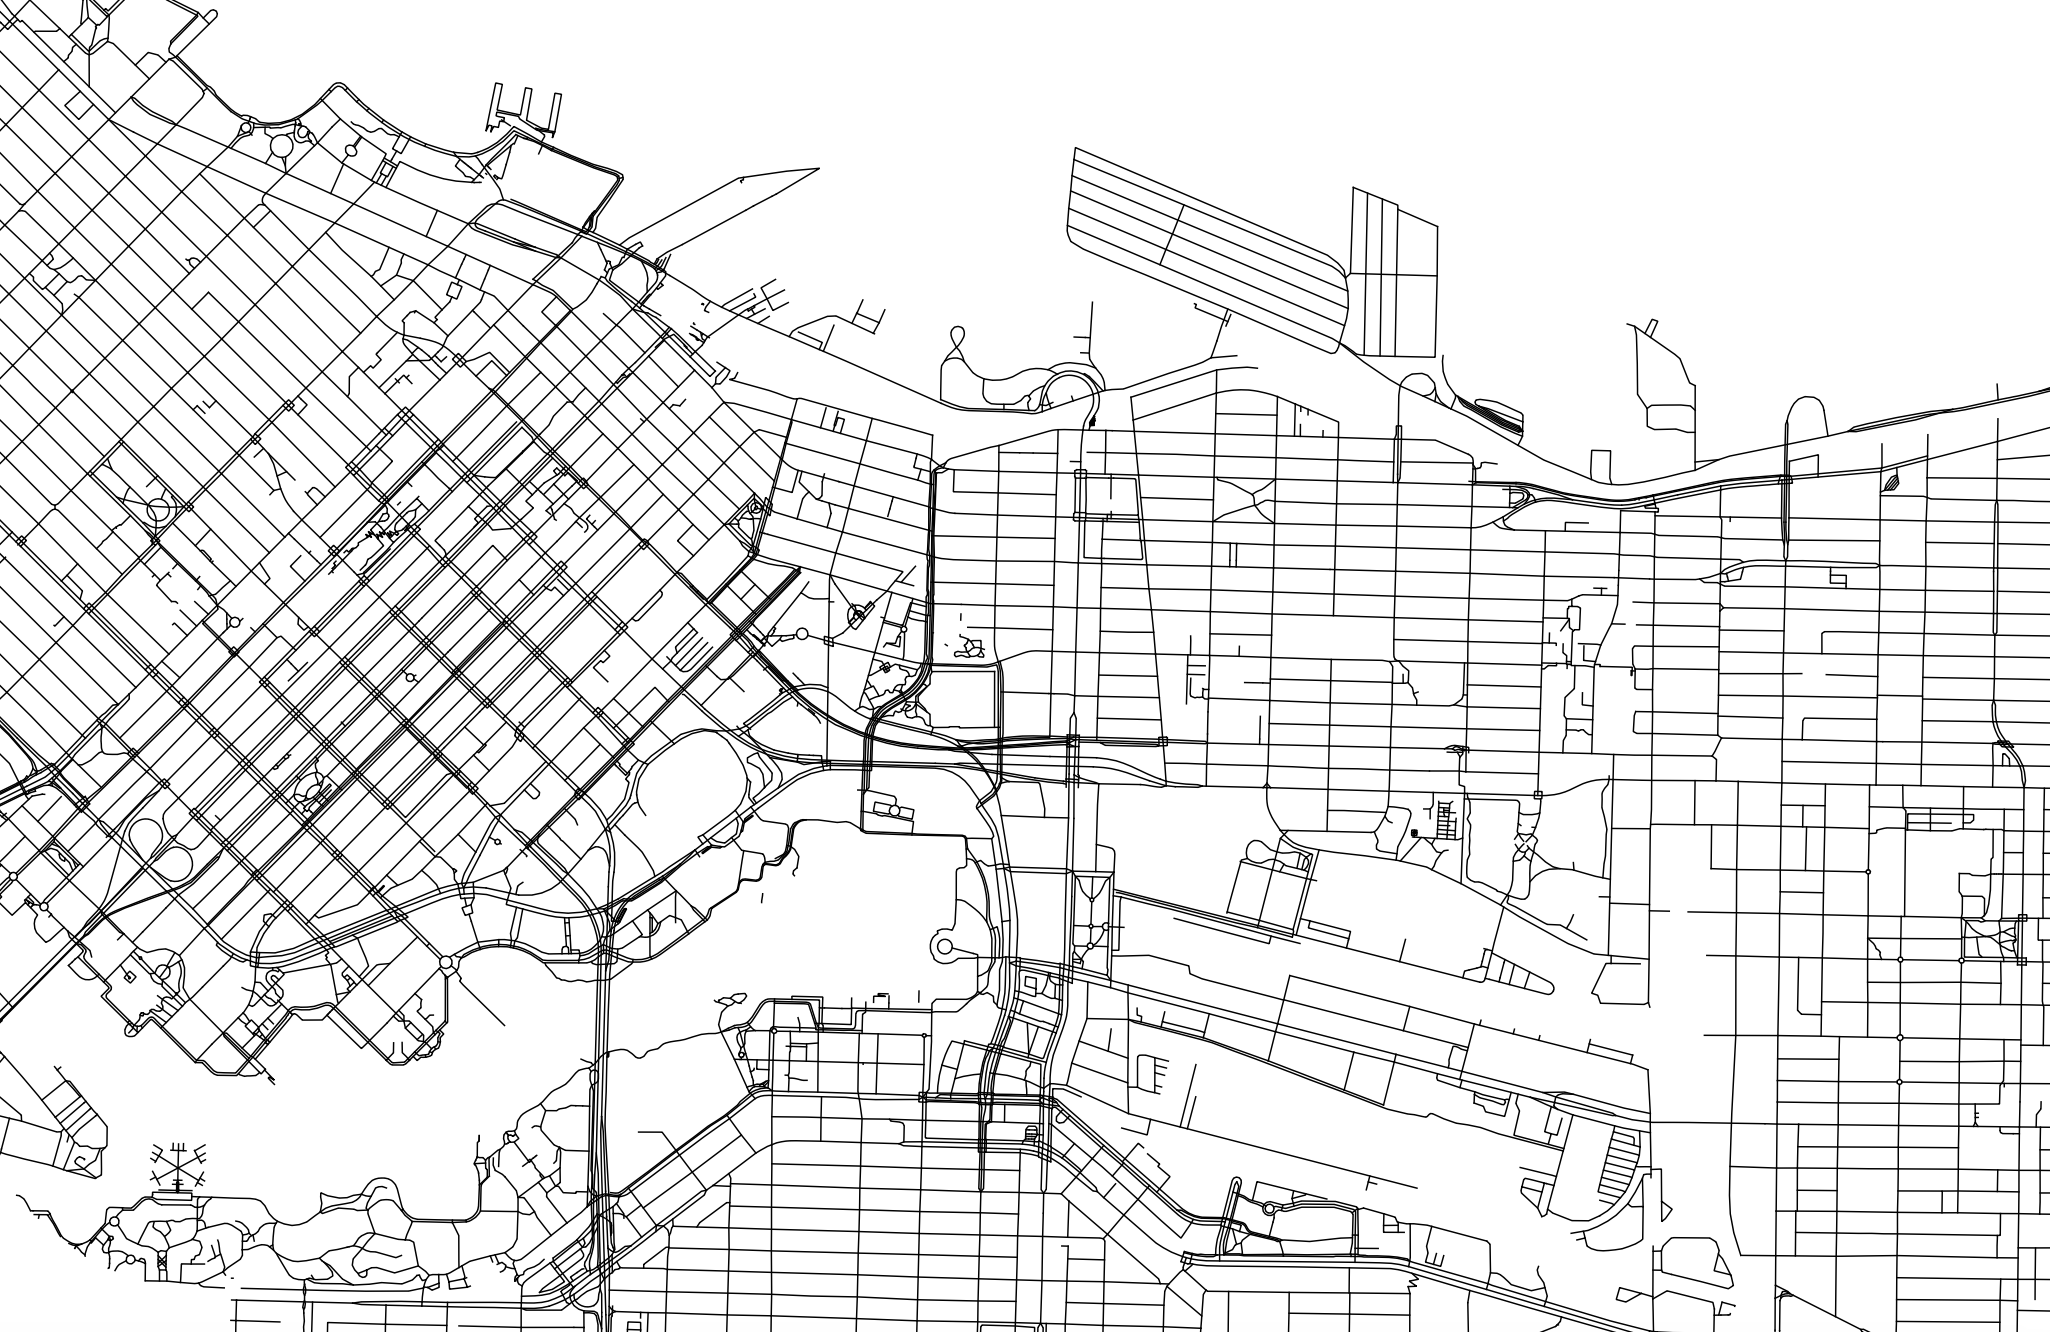
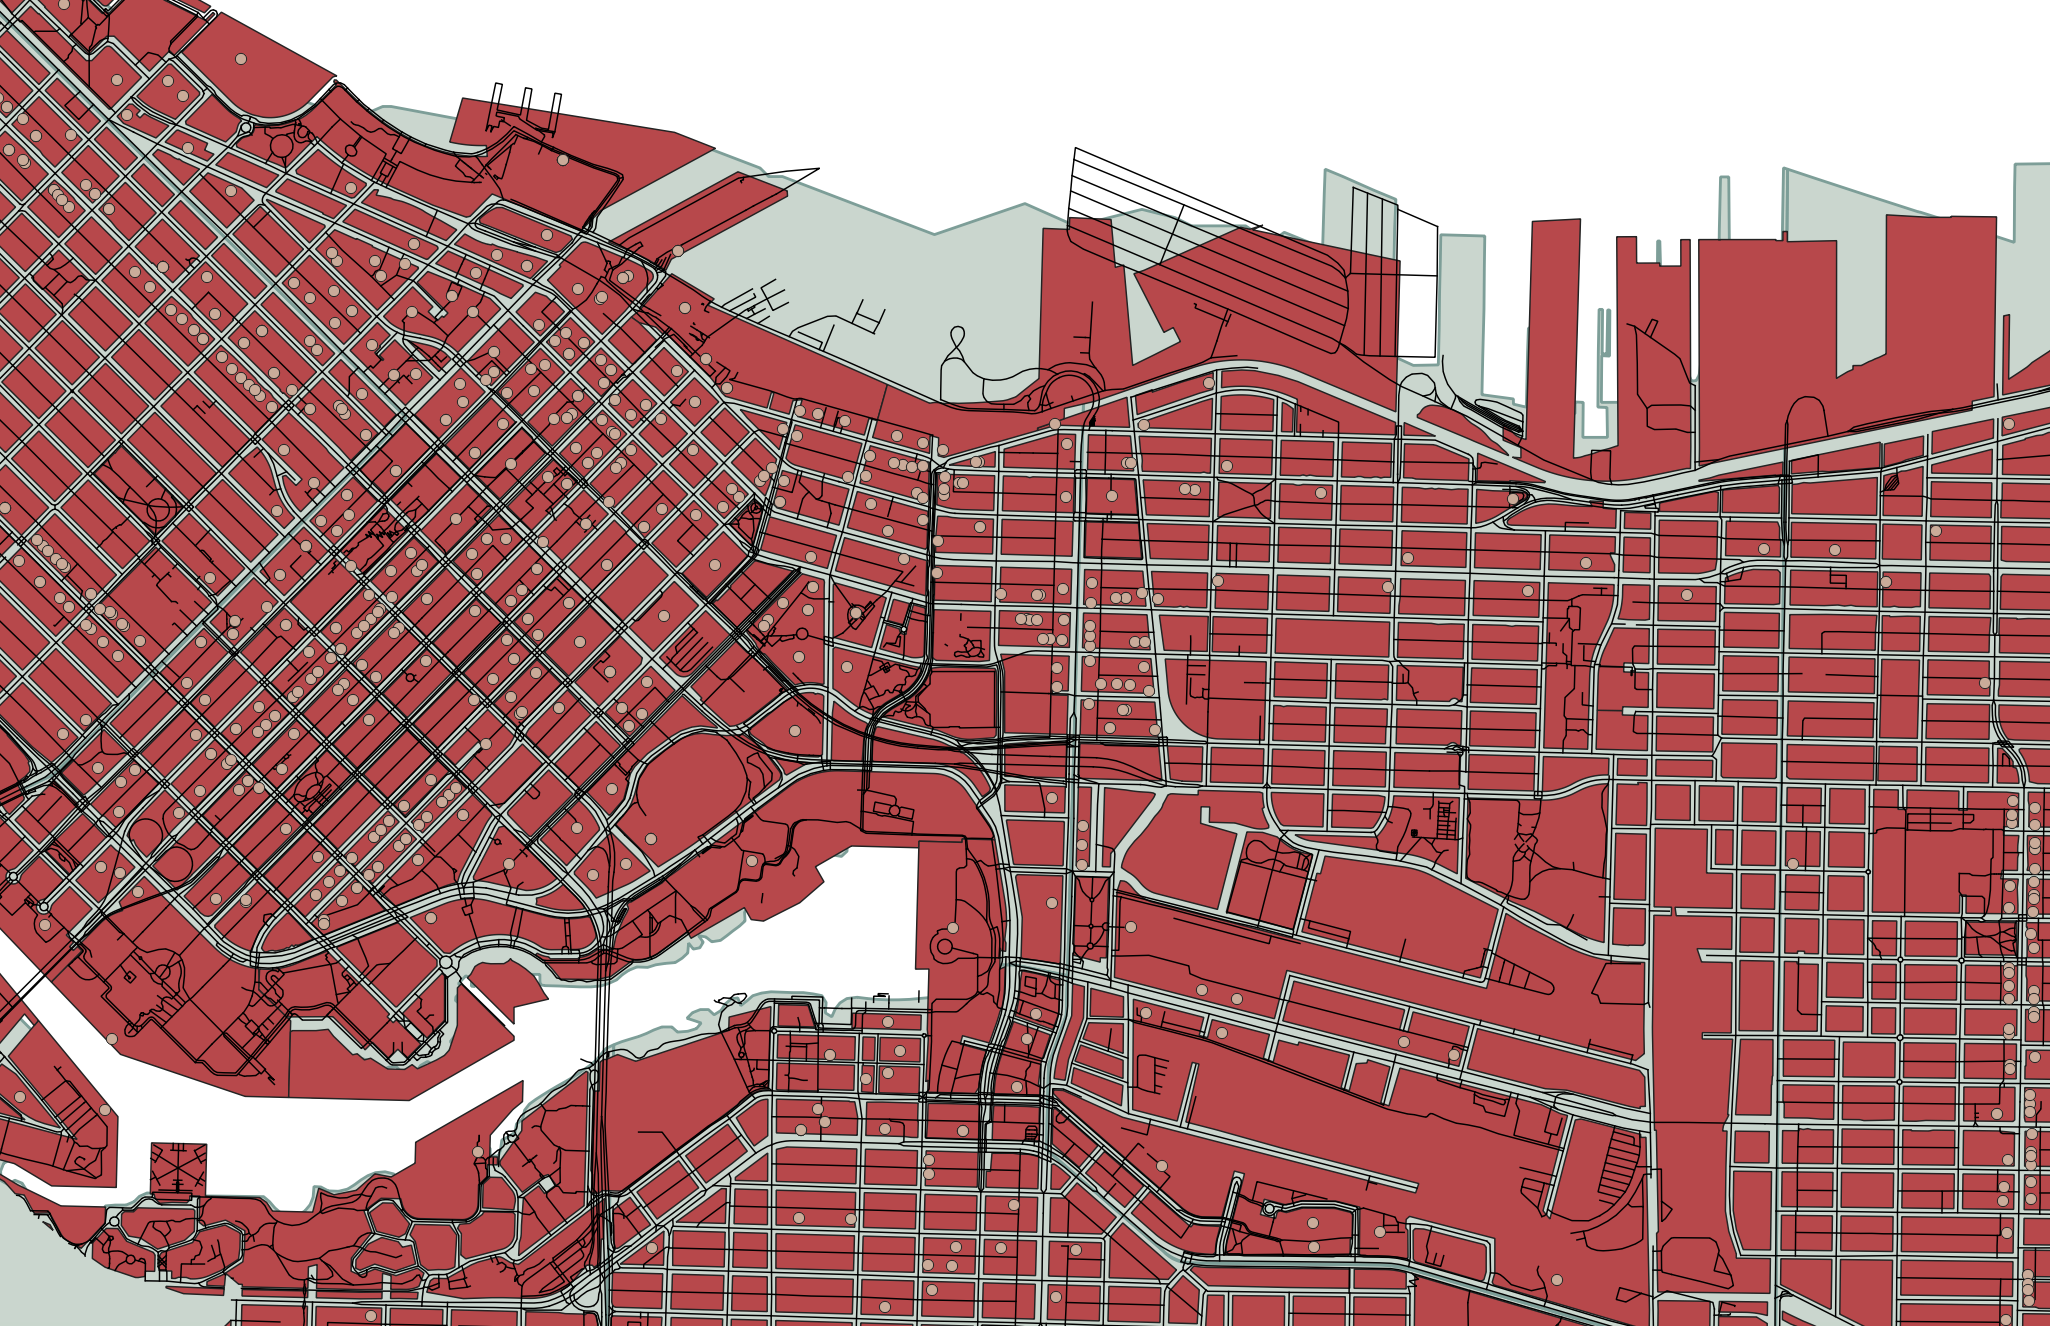
Each vector dataset will contain either points, lines, or polygons. However, a dataset can include multiple features (multiple points, or multiple lines, or multiple polygons). For example, below are a handful of vector datasets, including Vancouver neighborhoods (polygons), city blocks (polygons), restaurants (points) and streets (lines). A Geographic Information System (GIS) allows you to add multiple datasets, layering them on top of each other in order to run calculations between them to answer spatial questions. For instance, in a GIS, you could load in the below datasets and then use vector analysis tools to learn how many restaurants are within a 5 kilometer radius of a given city block, or the square area of each neighborhood.
In another example, below is a map consisting of three layers of vector data: cities (points), major roads (lines), and land/water (polygons). Cities, roads, land, and water are all different datasets consisting of vector data. 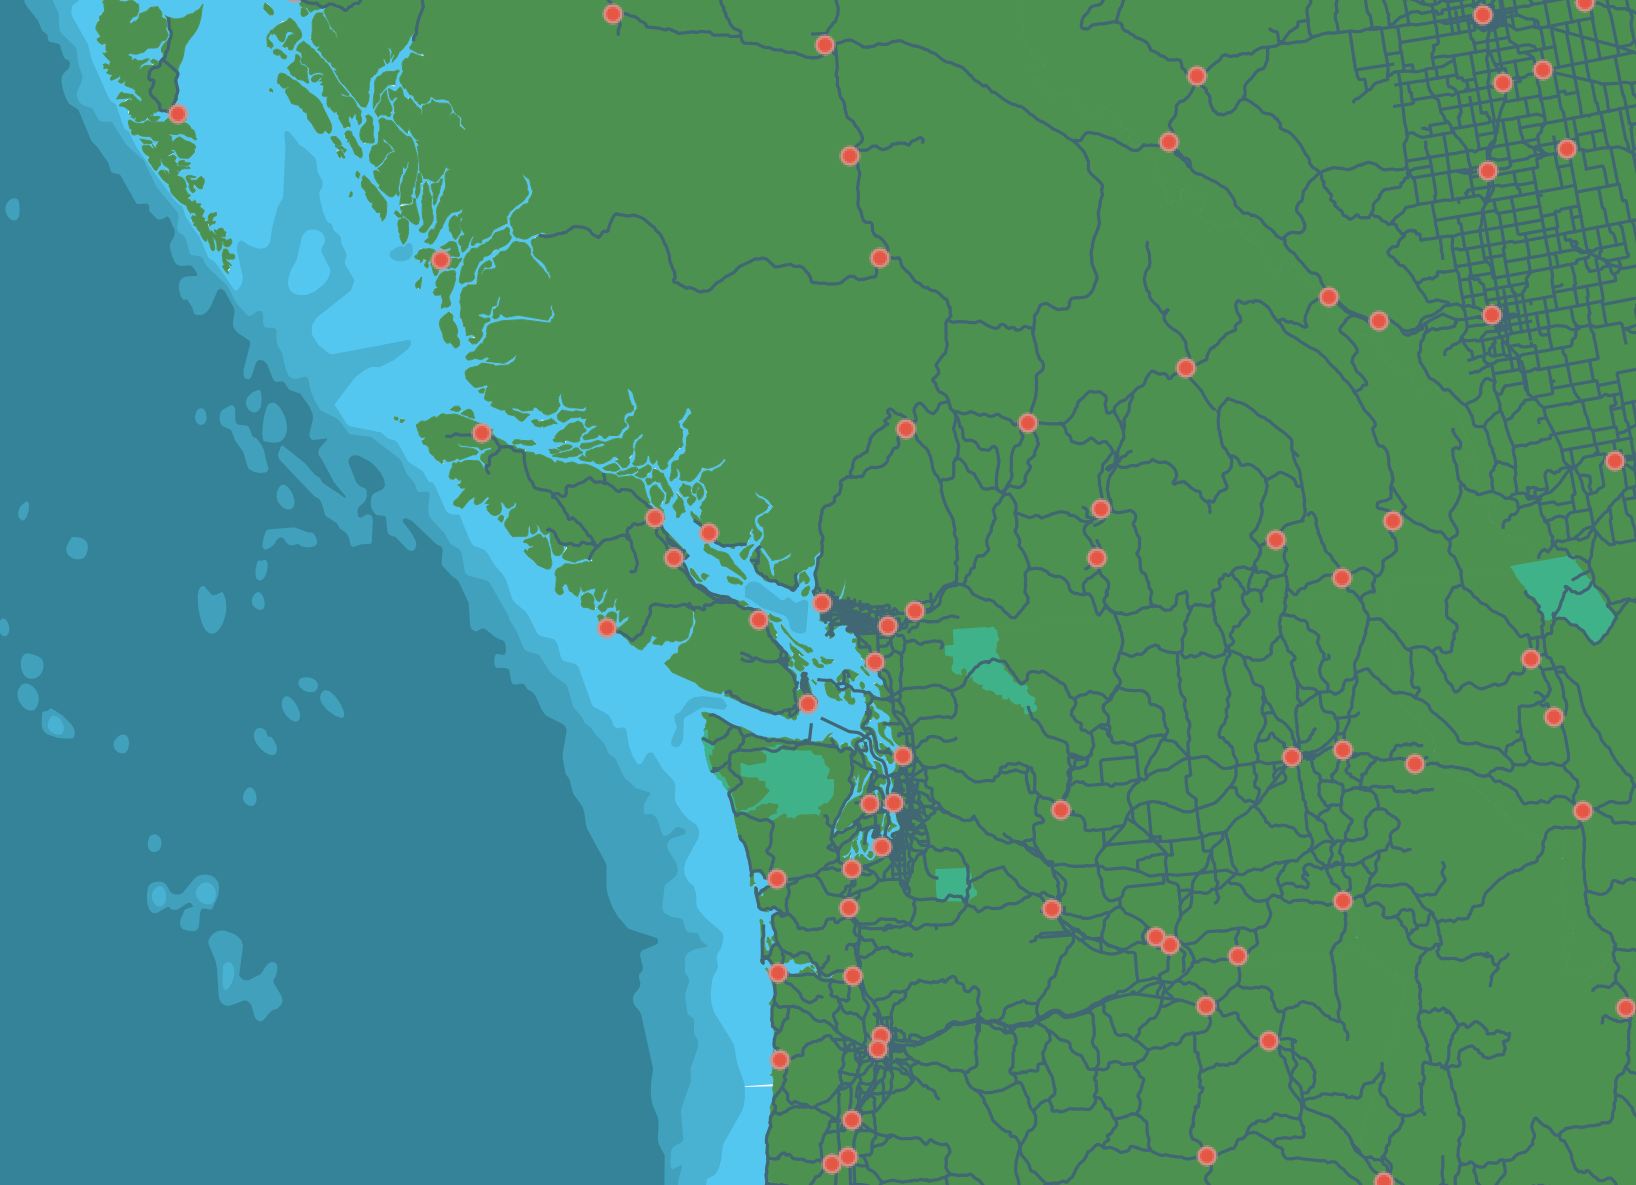
Each feature (each polygon, point, or line within a given dataset of points, lines, or polygons) contains various information such as a unique identifier, the area in square kilometers or length, the name, the population, etc. These attributes can be explored from within a GIS by opening what’s called the Attribute Table.
Raster Data
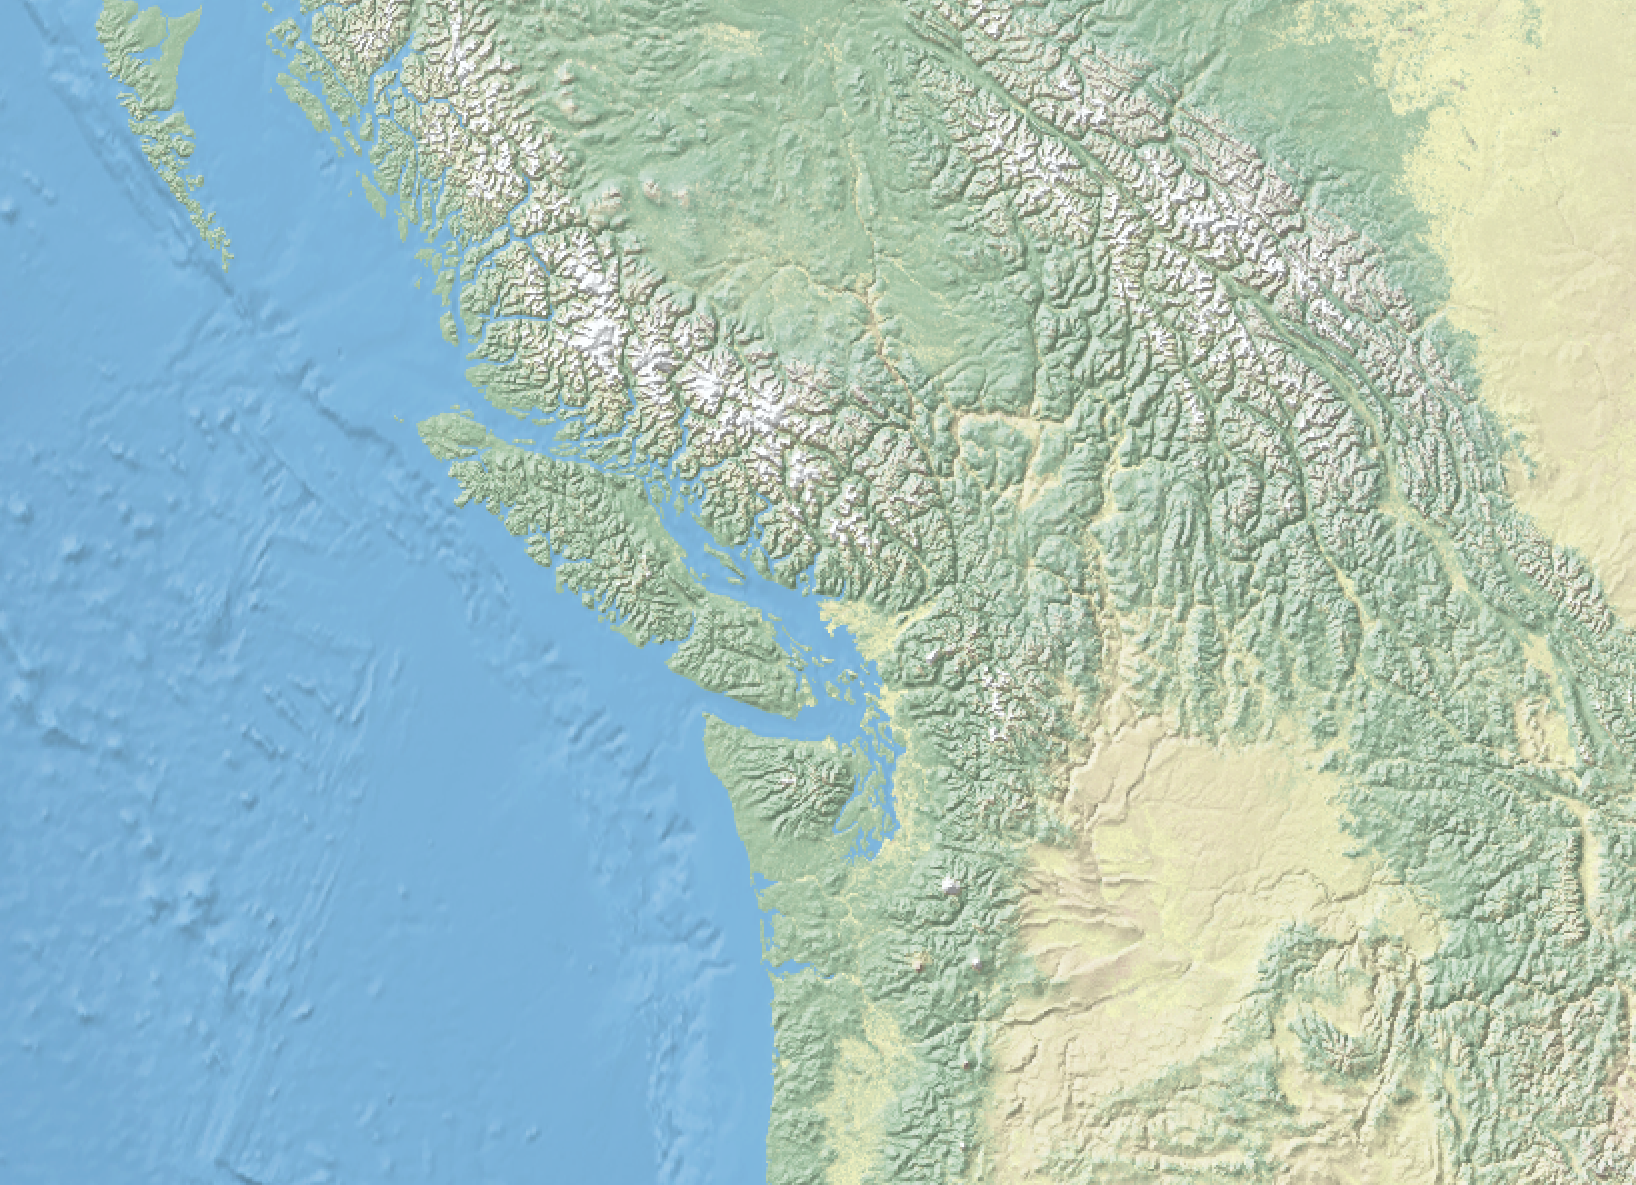
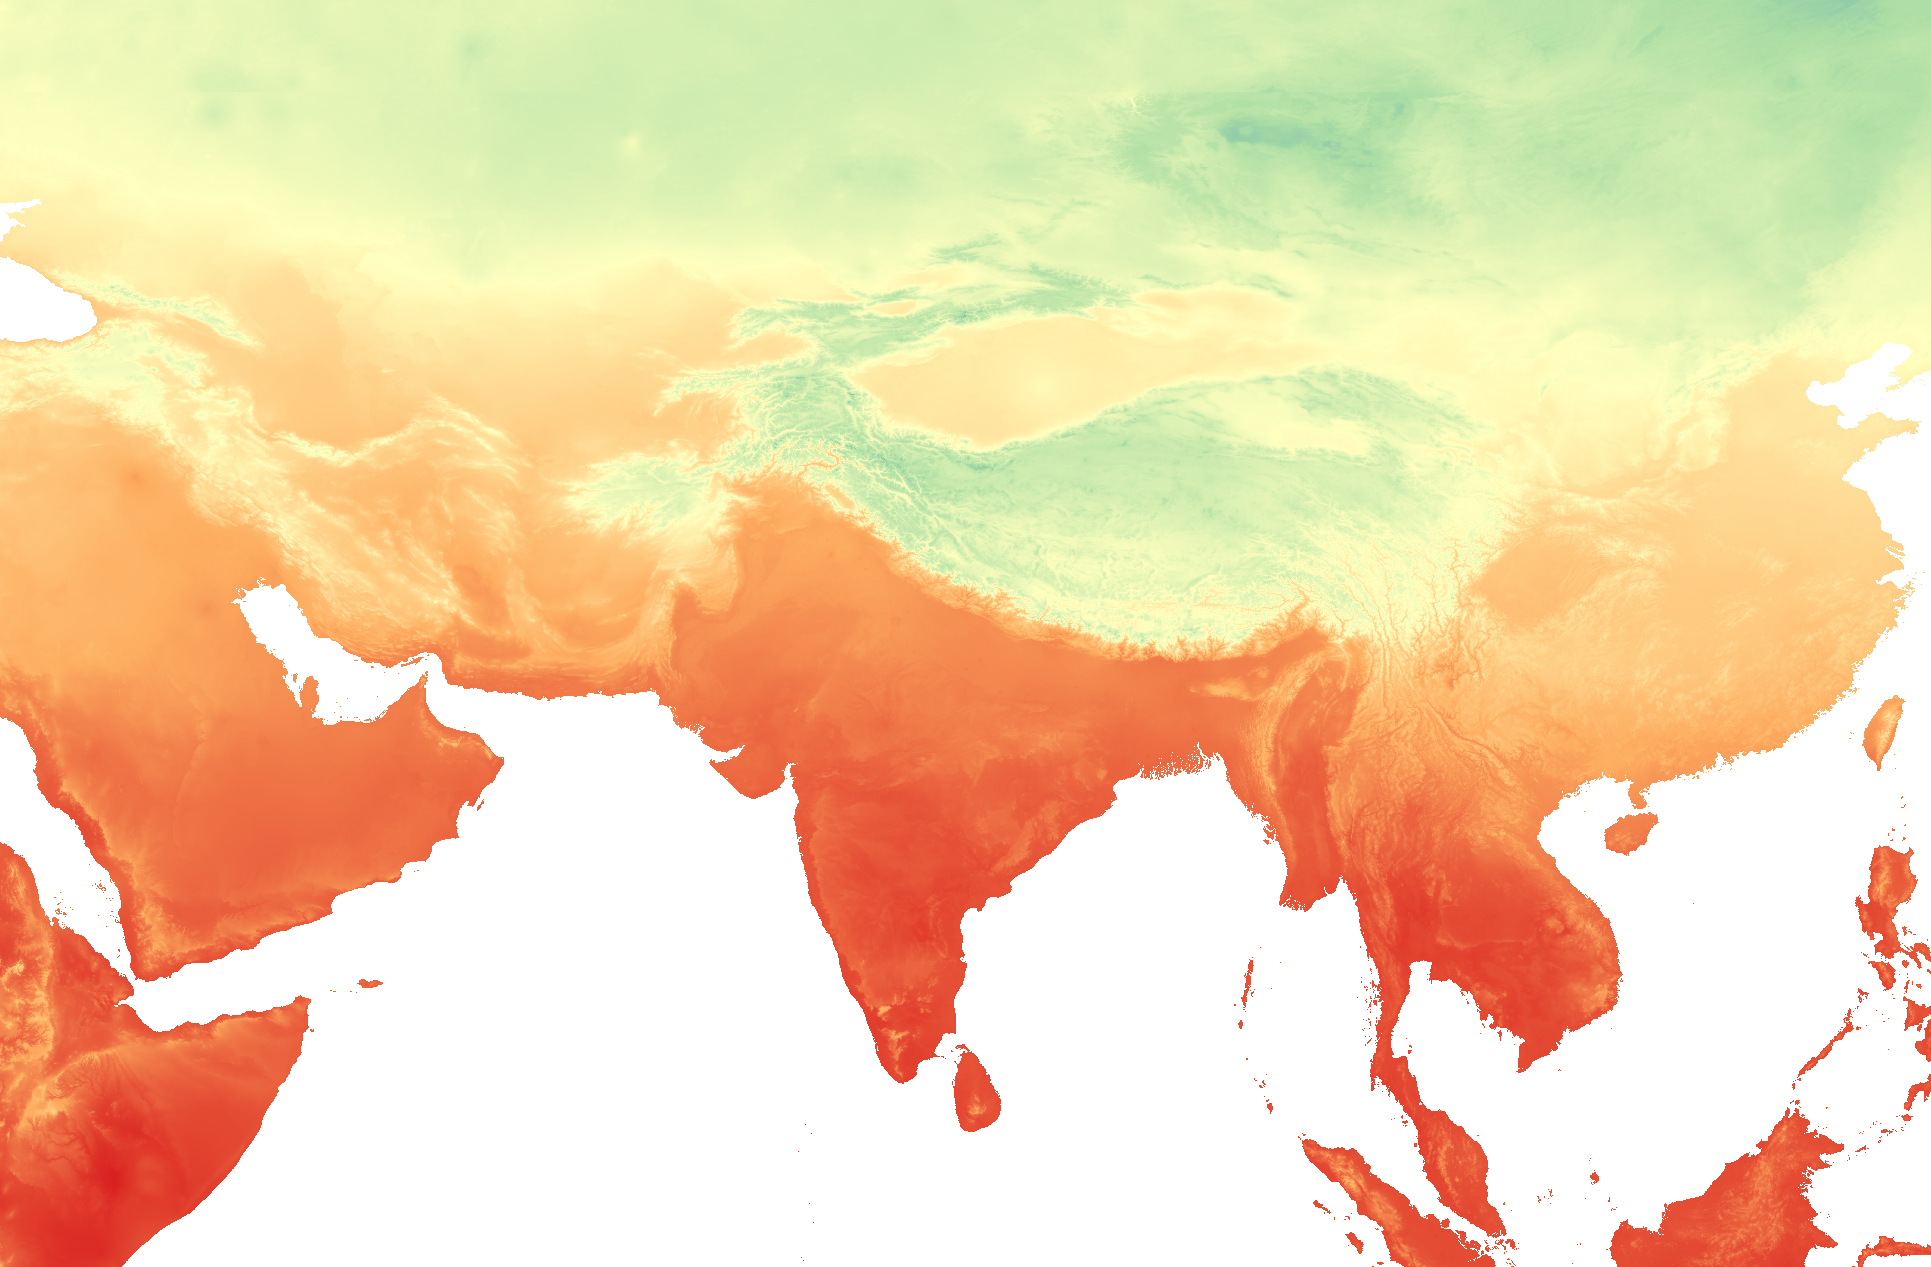
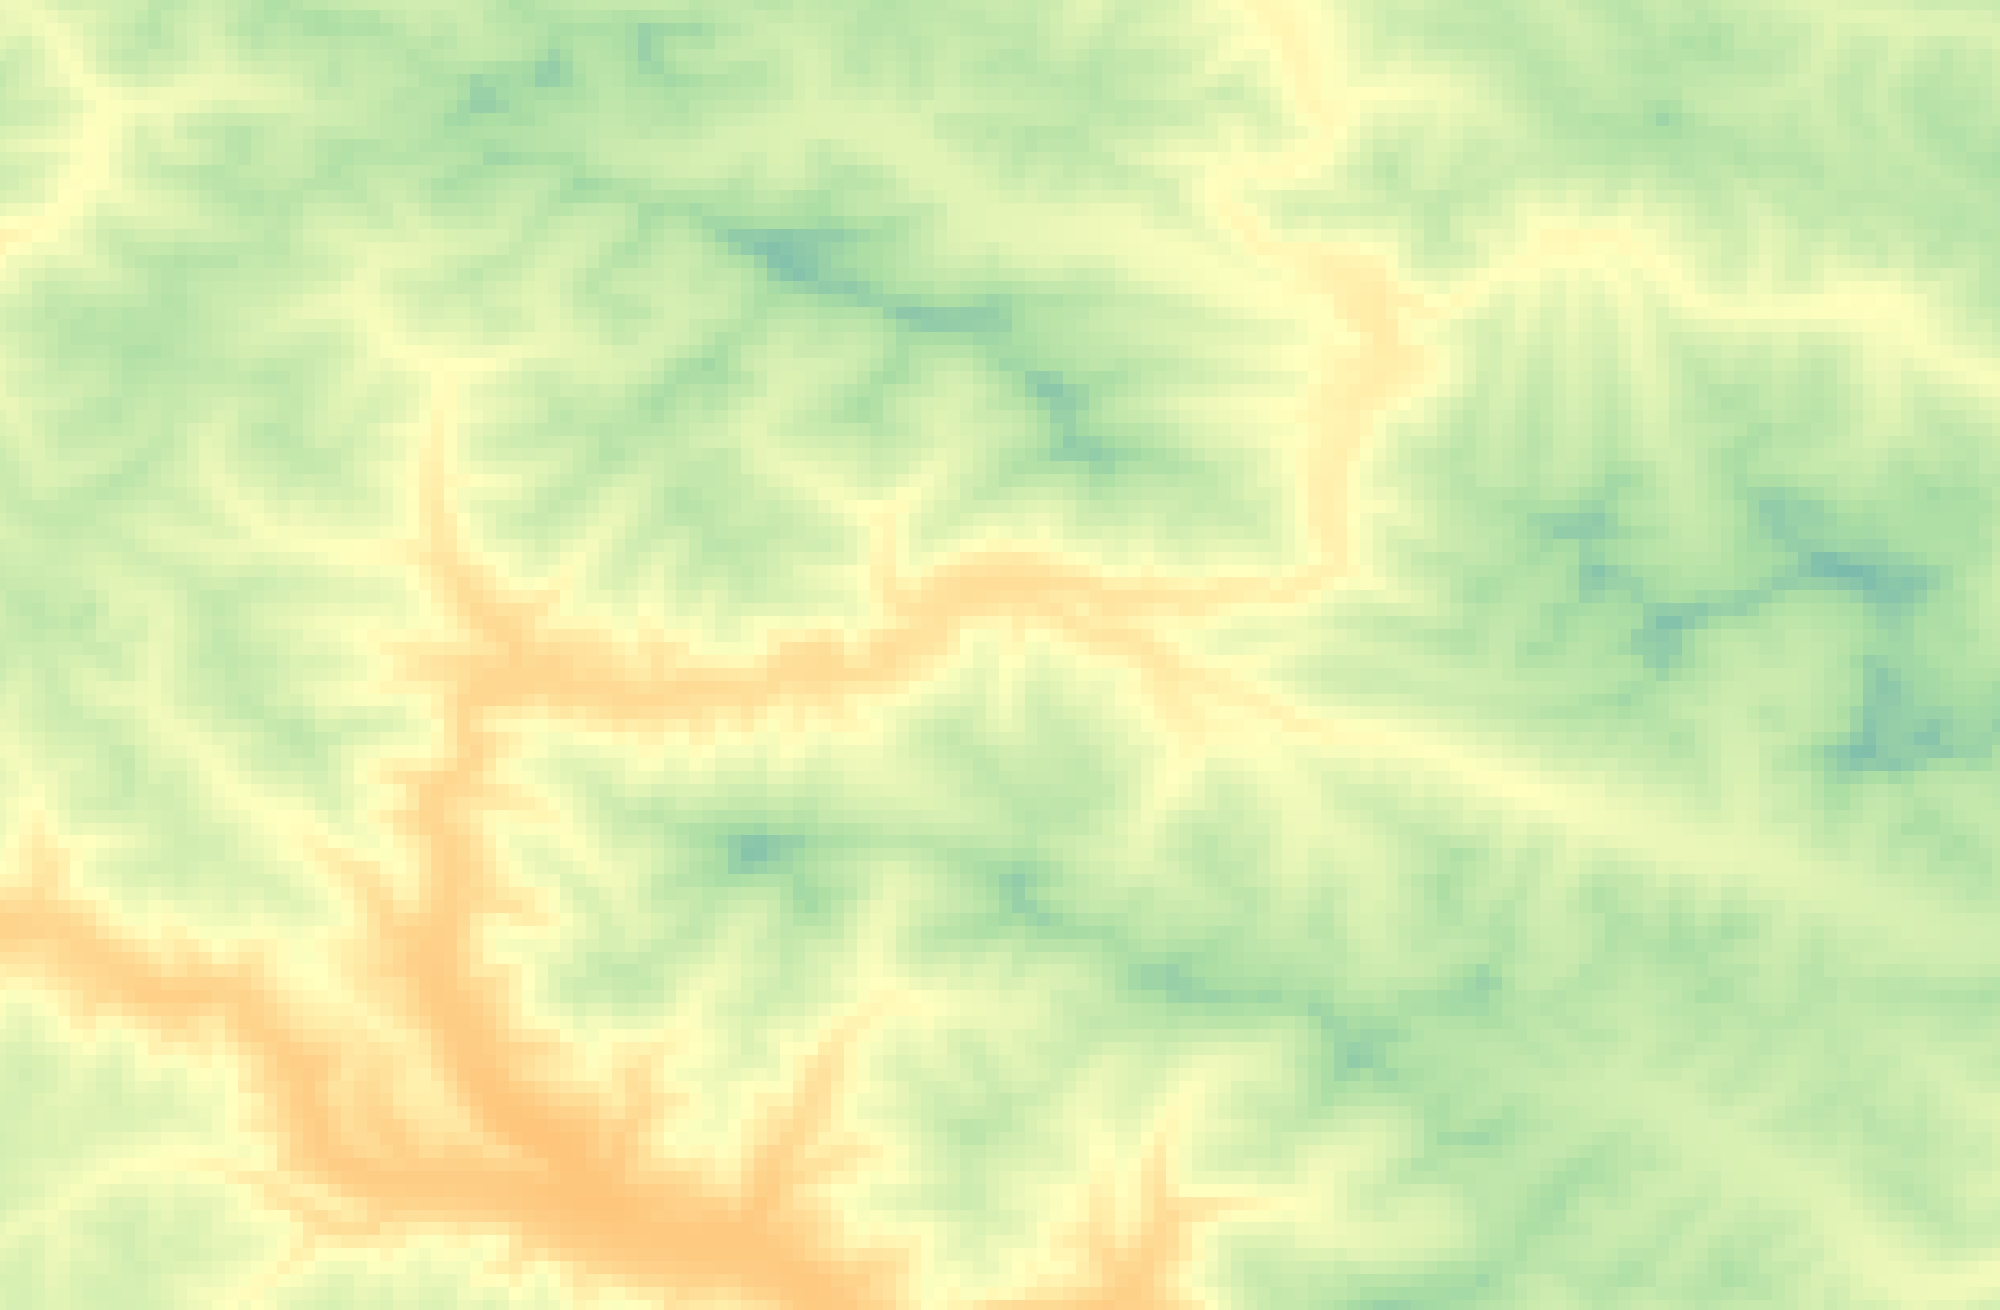
Rasters, on the other hand, can generally only store one value per pixel. This value could be a color representing different kinds of topography (think of the whites, greens, and browns representing different elevations in the image below) or the quantity of something like rainfall, temperature, or distance. Multiple rasters can be overlaid to generate a multi-part raster, but generally, each pixel of a single raster can store one value meaning your raster is showing one variable. You can also do math between raster layers, or run boolean operations to isolate all pixels that do or do not meet certain criteria. An example of this is Suitability Analysis, where multiple rasters are created, each representing the where a single criteria is met; then, these rasters are overlaid to visualize areas of high suitability (such as habitat).
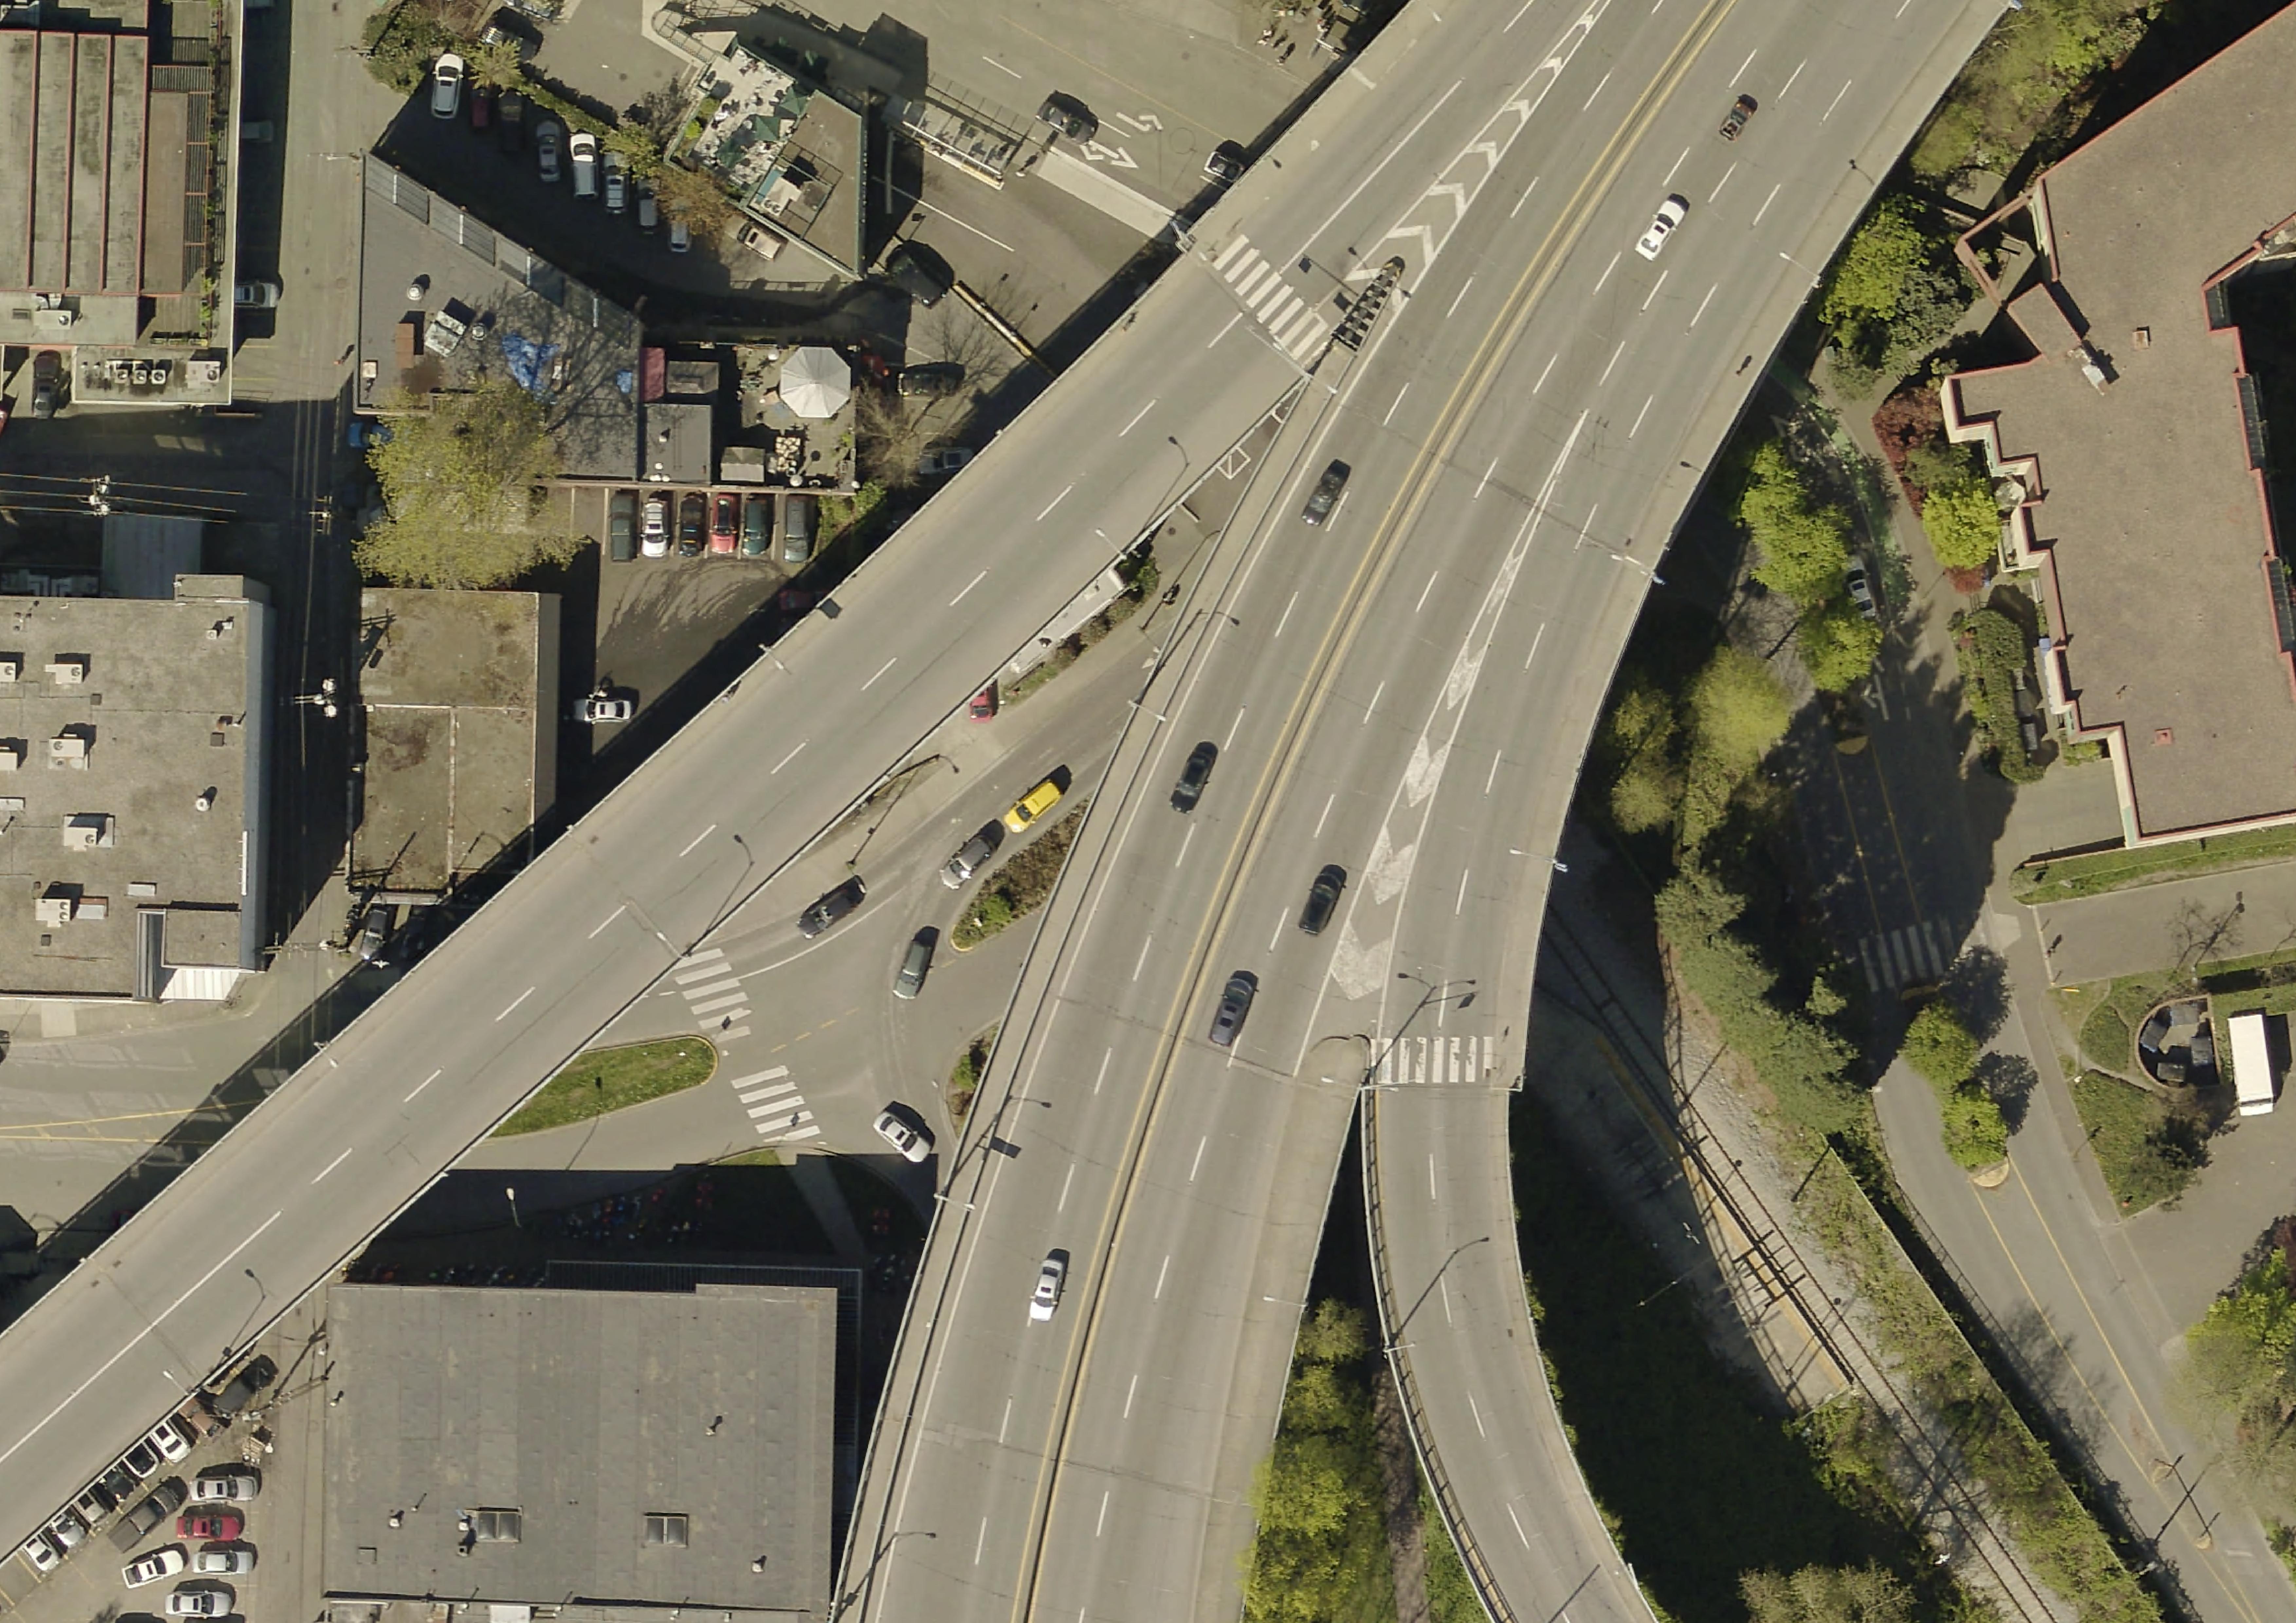
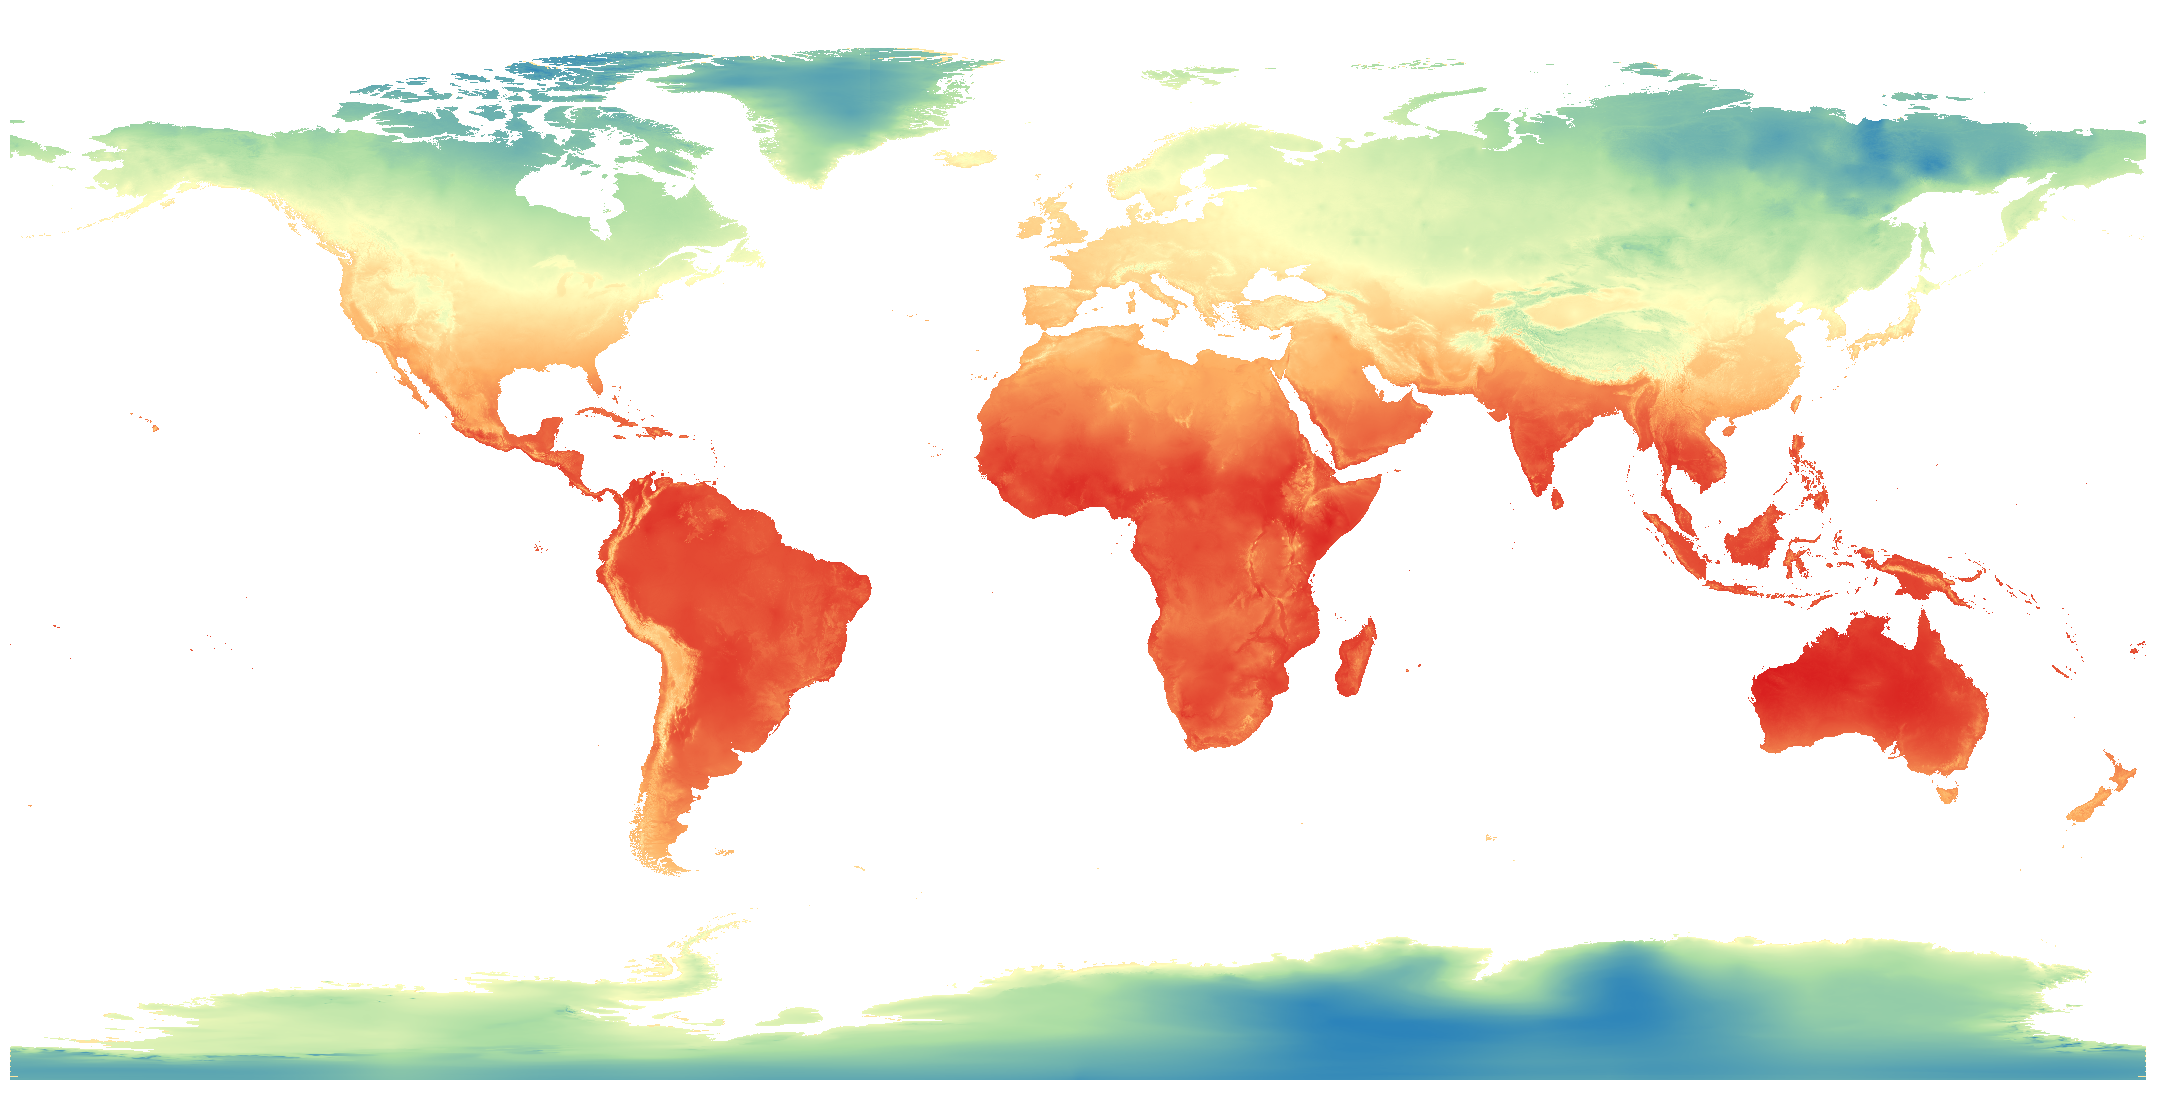
Below is are three examples of raster data: topography, aerial imagery, and historical rainfall for the month of February (averaged 1970-2000) from WorldClim, an excellent database of freely available historical climate data.

In a GIS, you can convert raster data to vector data and vector data to raster data, and extract raster values to a vector dataset.
File Extensions
Just like a textual data can be stored in different document formats (.docx, .pdf, .txt, .rtf, etc.), spatial data can be stored in different formats too. The file extensions of spatial data give us clues about the kind of data we’re working with. Although the nuance of file formats might seem too detail oriented for an introduction to reference mapping, being aware of different spatial data types and formats will help you know what to download and troubleshoot why something may not be opening/working. If you have no prior experience with spatial data, this may be quite overwhelming right now. However, with a little bit of practical experience under your belt file formatting will quickly become common sense to you. See here for an exhaustive list of formats spatial data can take.
- Raster data will often be TIF (aka TIFF) file and have the extension
.tifor.tiff. Raster data may also be in an ASCII text file, with the extension.asc, or a compressed raster file formats. Vector data come in more diverse file formats: - The Shapefile is an industry standard format with the extension
.shp(and a host of “sidecar files” — be sure to keep them all together). Vector data downloaded in a shapefile format will almost always need to be unzipped before use. Shapefiles store data in binary. Therefore, shapefiles are not legible to human eyes and can only be opened and visualized by a GIS. - GeoJSON, on the other hand, stores vector data in
.geojsonfiles that can be opened (and edited) in a code editor or online in geojson.io. From there, geoJSON can easily be parsed with human eyes. - Spatial data might even be stored in an excel sheet or a
.csvfile. - KML, or Keyhole Markup Language, is particular to Google Earth and Google Maps and doesn’t work well in a GIS. This is why, when using Google platforms, you’ll need to upload your data in either
.kmlor.csvformat. - If your data does not have an explicit spatial component, but includes place names or addresses, with a little work, this can be made legible to tools and platforms designed to read spatial data. Also note that historical data might come in the form of a scanned map that will need to be “georeferenced”, or projected into a 2-dimensional coordinate space. Additionally, in a GIS, you can convert raster data to vector data and vector data to raster data, and extract raster values to a vector dataset.
- If your data’s locative information is in the form of text — for example, country/city names or street addresses — this can be made legible to a GIS with a few extra steps (see geocoding). You may have to create new columns and populate them with coordinate information.
See here for an exhaustive list of formats spatial data can take. Although the nuance of file formats might seem too detail oriented for an introduction to reference mapping, being aware of different spatial data types and formats will help you know what to download and troubleshoot why something may not be opening/working. If you have no prior experience with spatial data, this may be quite overwhelming right now. However, with a little bit of practical experience under your belt file formatting will quickly become common sense to you.
Resources for Finding and Working with Spatial Data
Loading last updated date...