Making a Proportional Symbol Map
Now, let’s use symbols to convey the range of total trees by making a proportional symbol map of Douglas Firs in each Vancouver neighbourhood.
You can make proportional symbol maps in QGIS simply by applying a graduated symbology to a point layer, where each point represents a standard geographic area and contains the value of interest.
Convert polygons to points
Currently, we have a polygon layer vanHoodsCount but no point layer for neighbourhoods. We can turn this layer into a point layer, however, by running another QGIS processing tool.
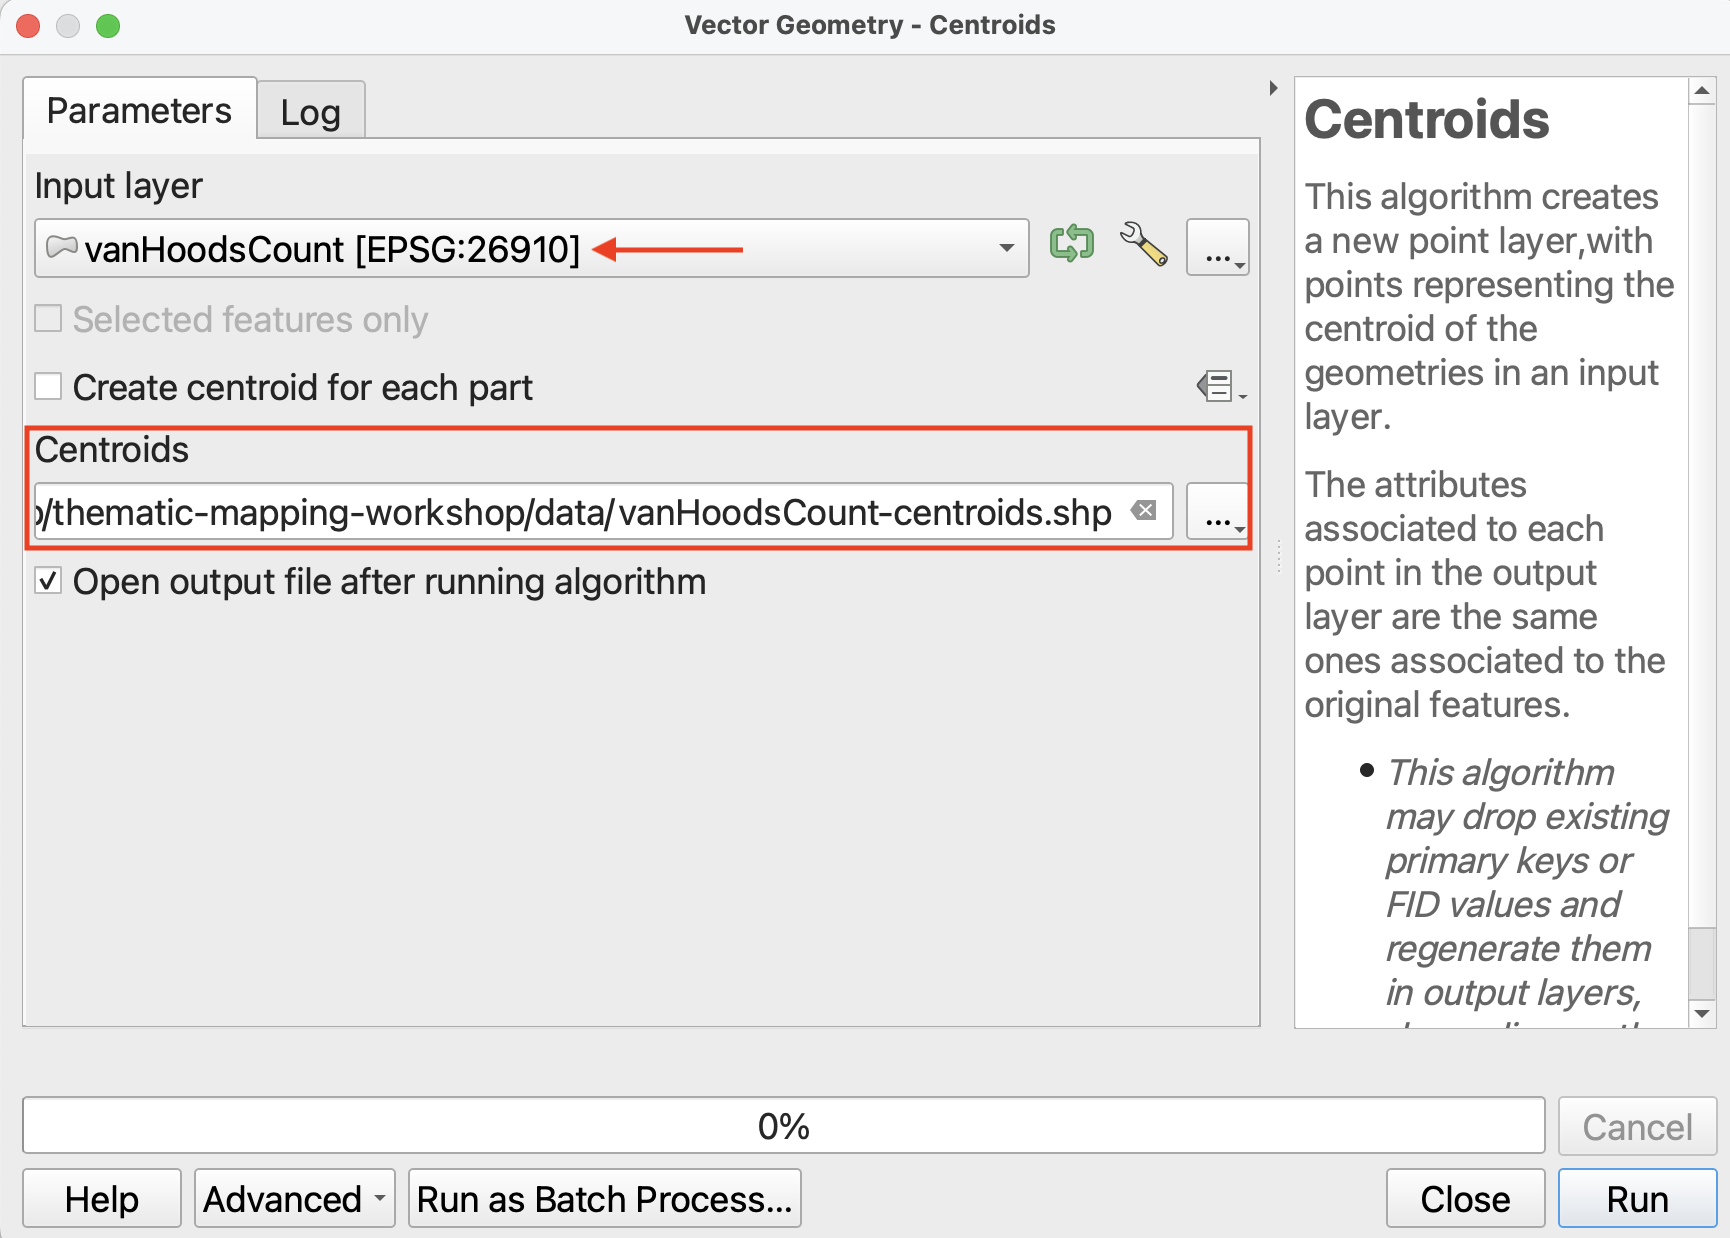
1 In the Processing Toolbox, search for the tool called Centroids. It should be under Vector Geometry.
Run the Centroids tool with the following parameters:
- Input layer:
vanHoodsCount - Save the output layer as a file to your
thematic-mapping-workshop/datafolder, and call itvanHoodsCount-centroids.
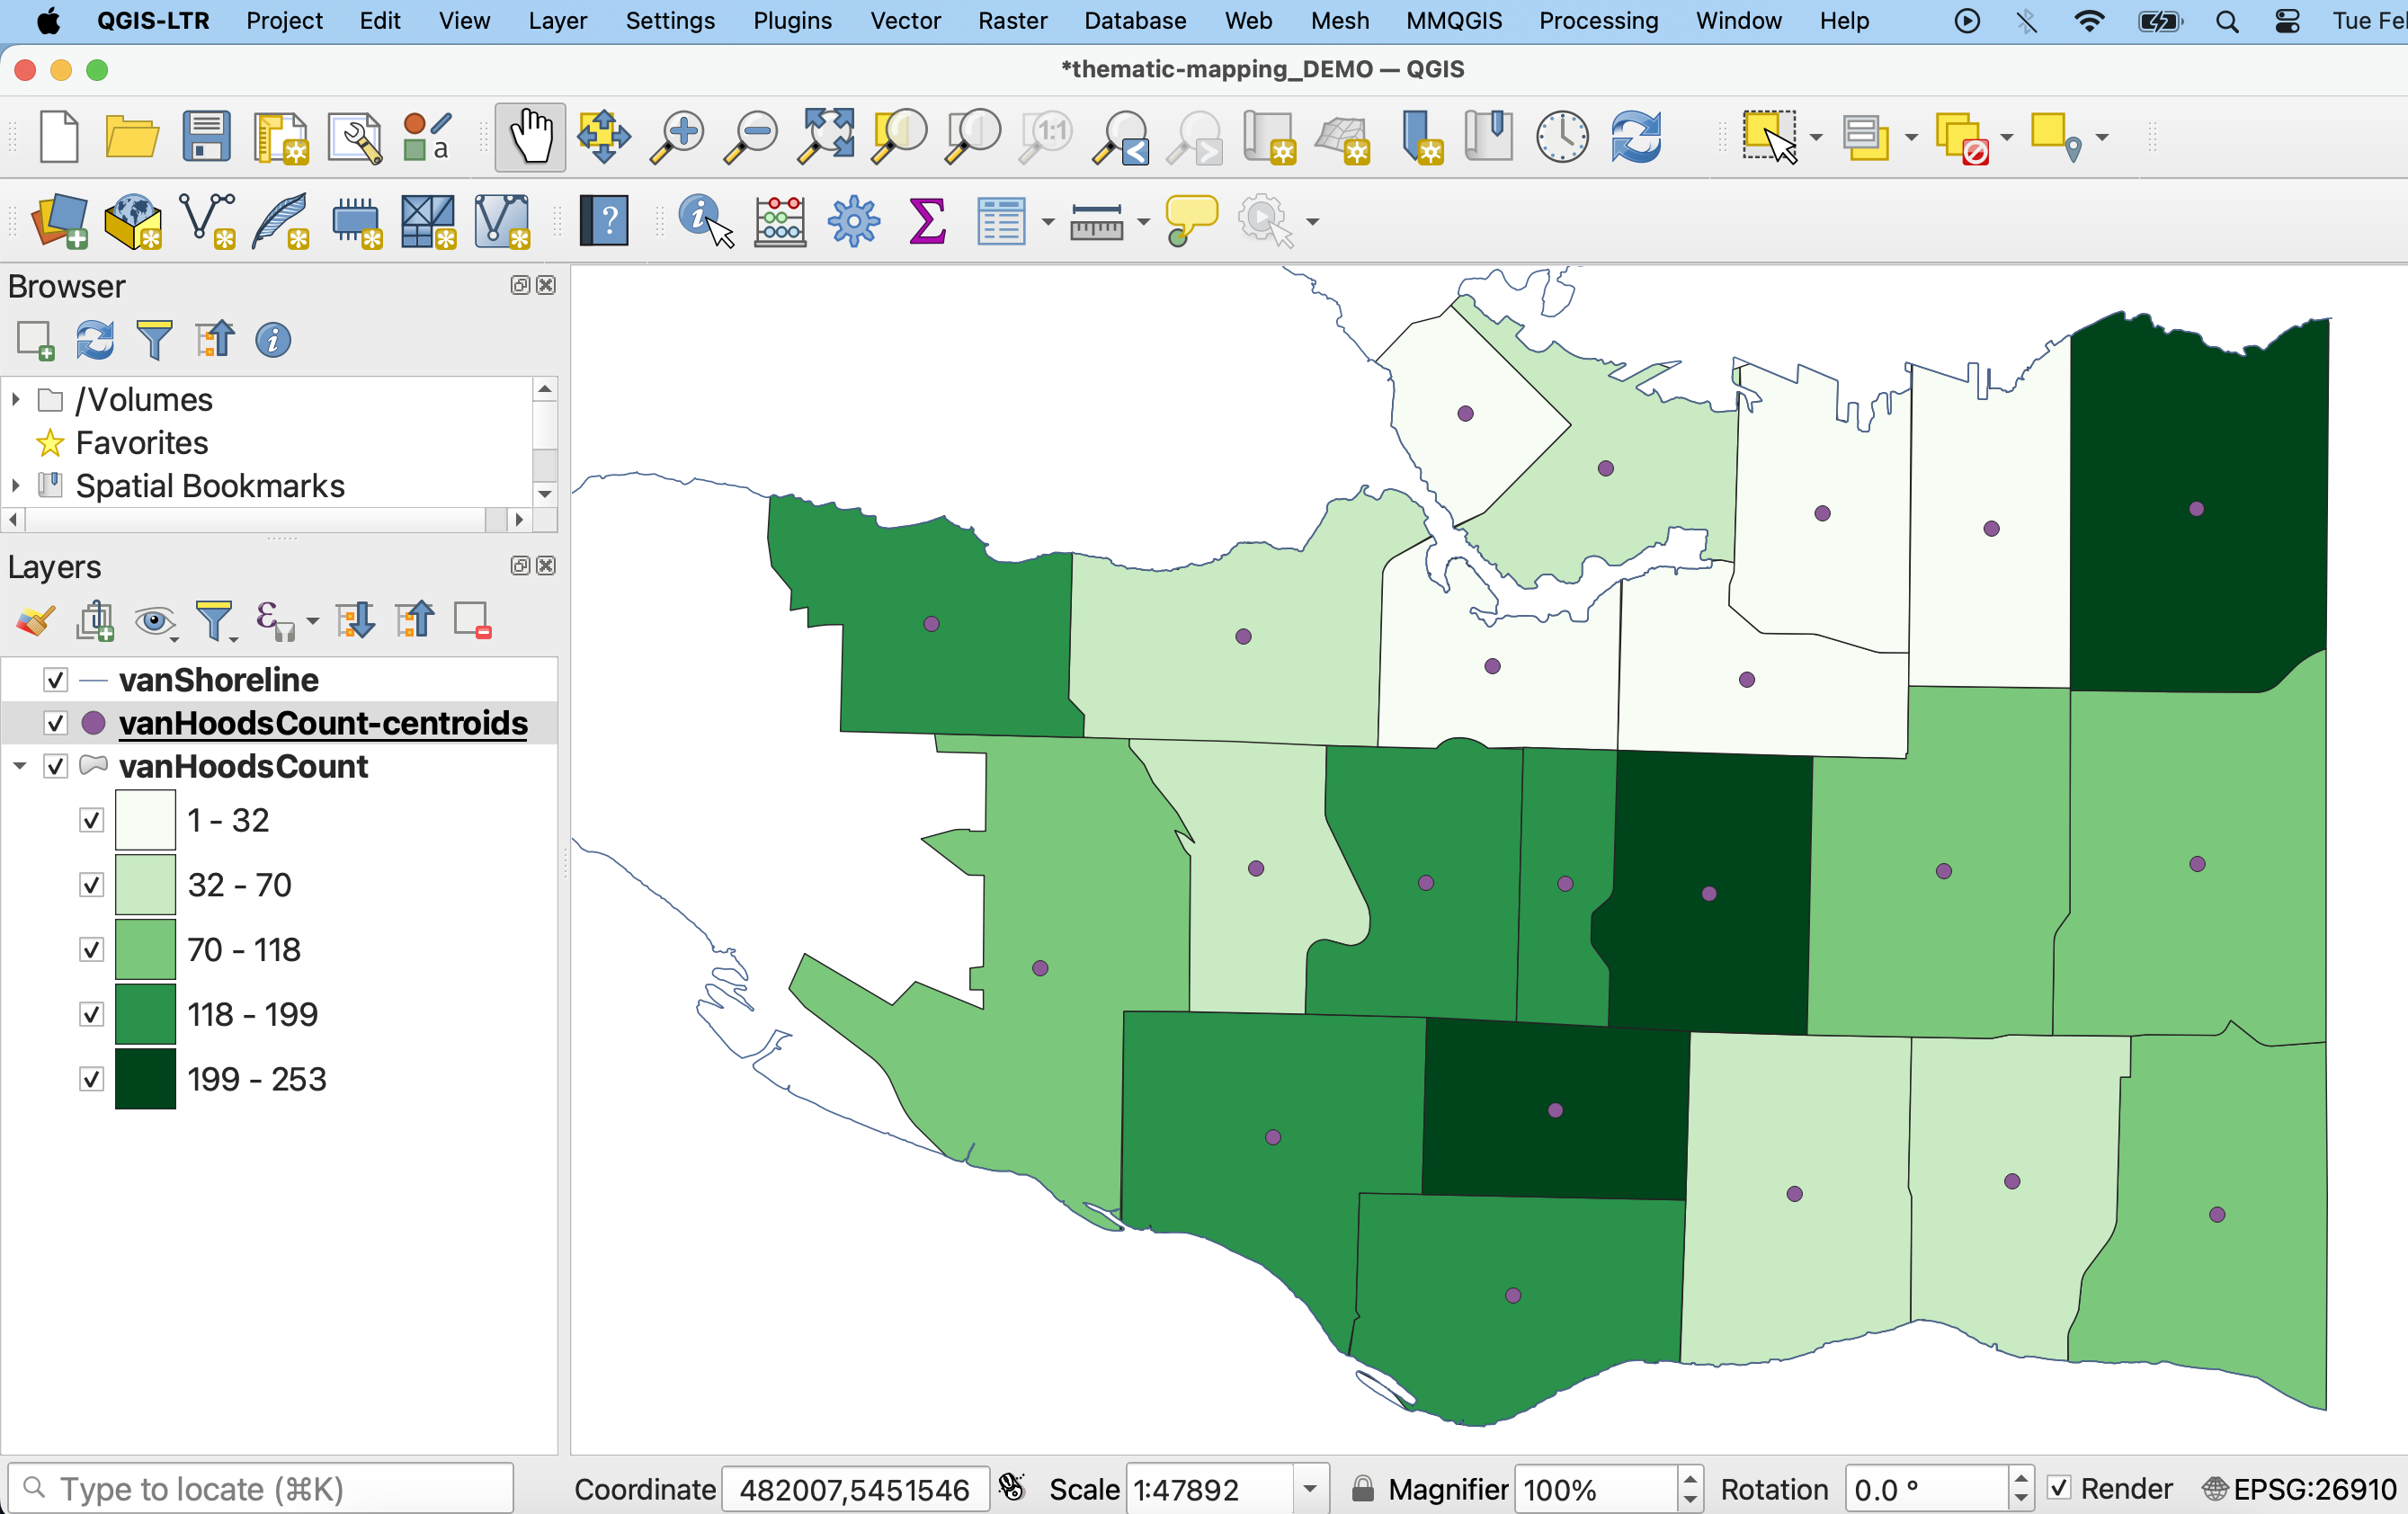
2 If not automatically added to your map, load vanHoodsCount-centroids.
3 Open the Layer Properties of vanHoodsCount-centroids and navigate to the Symbology.
- Change the symbology type to Graduated.
- Set the Value to
DougFirs. - Then, change Method to Size.
- Change the minimum size to 3mm and the maximum size to at least 20mm.
Then, hit Classify and Apply.
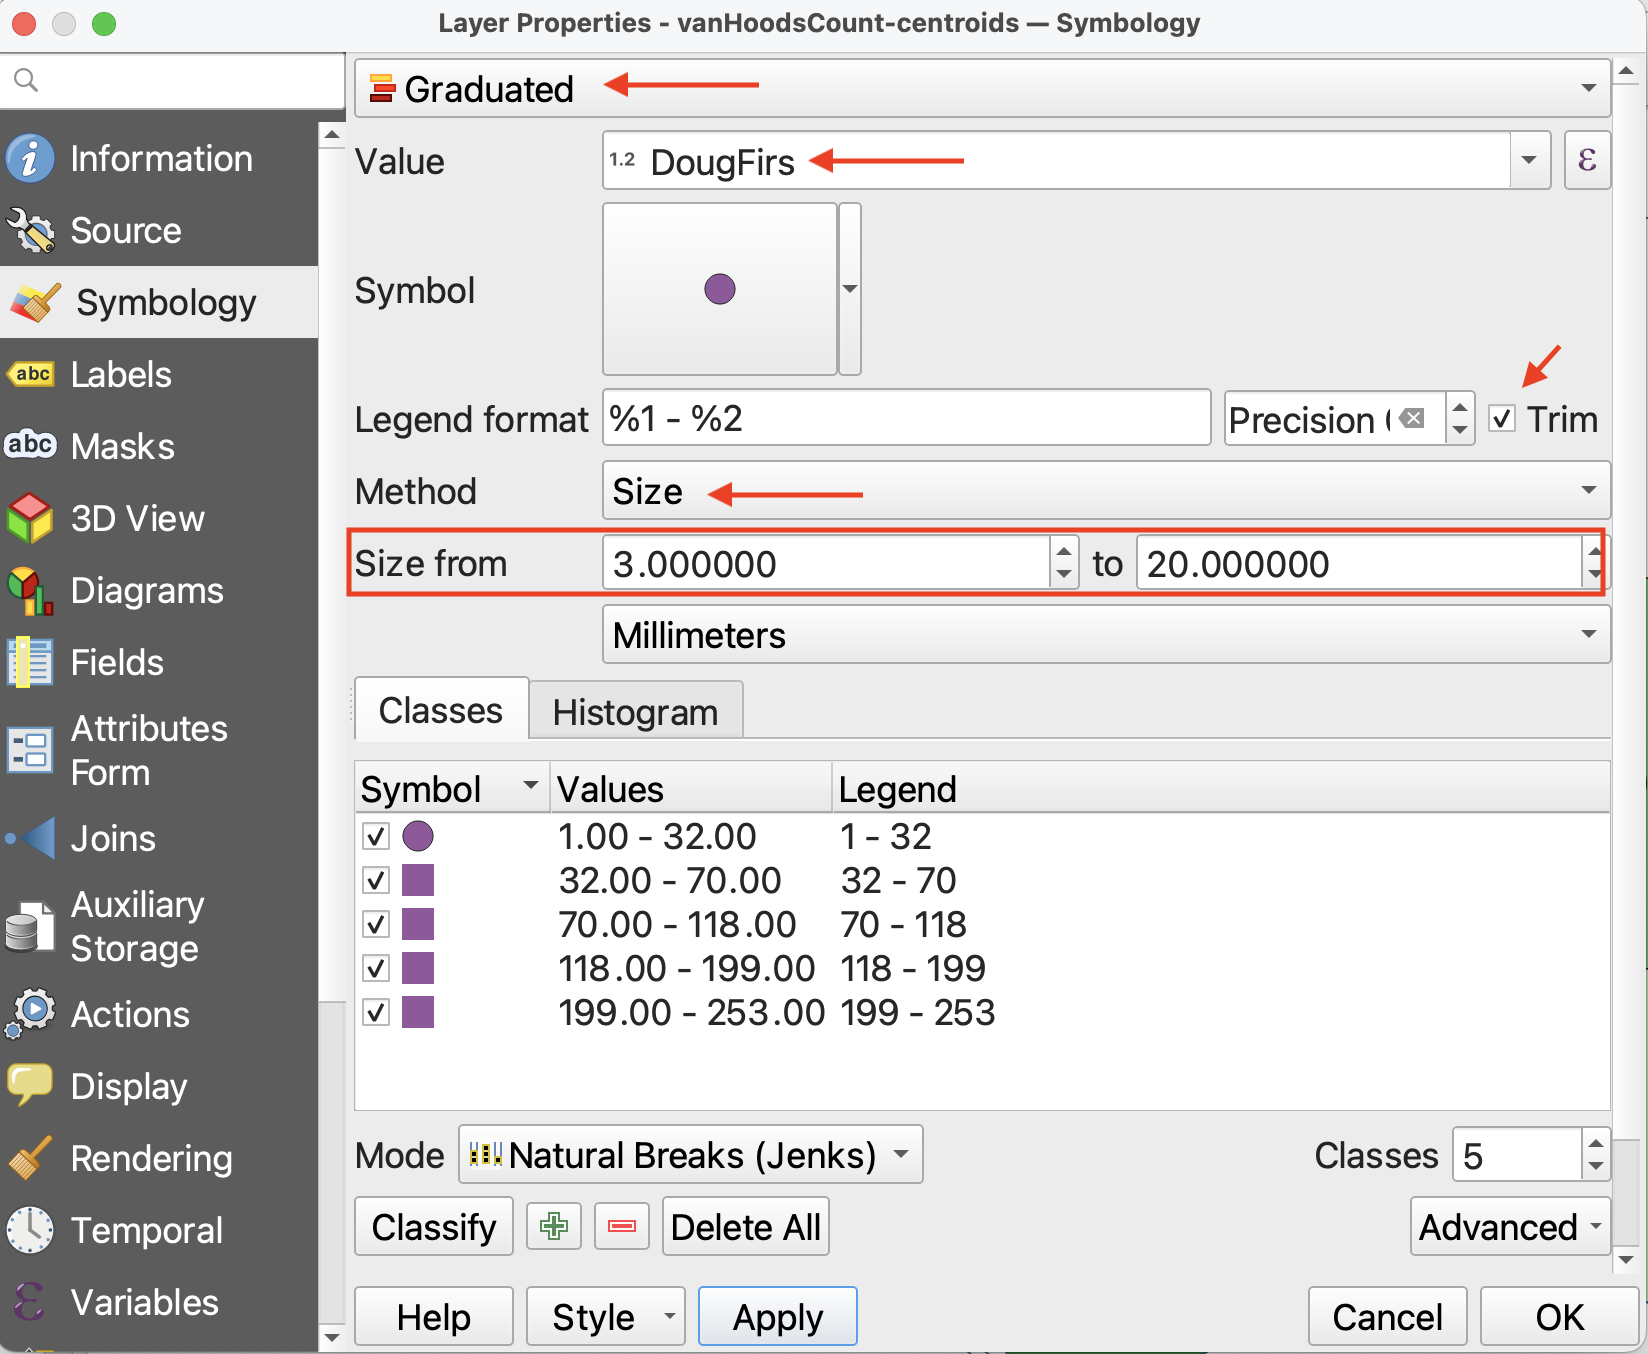
4 Just like in the previous page, you can change the classification mode. Keep it at Natural Breaks (Jenks).
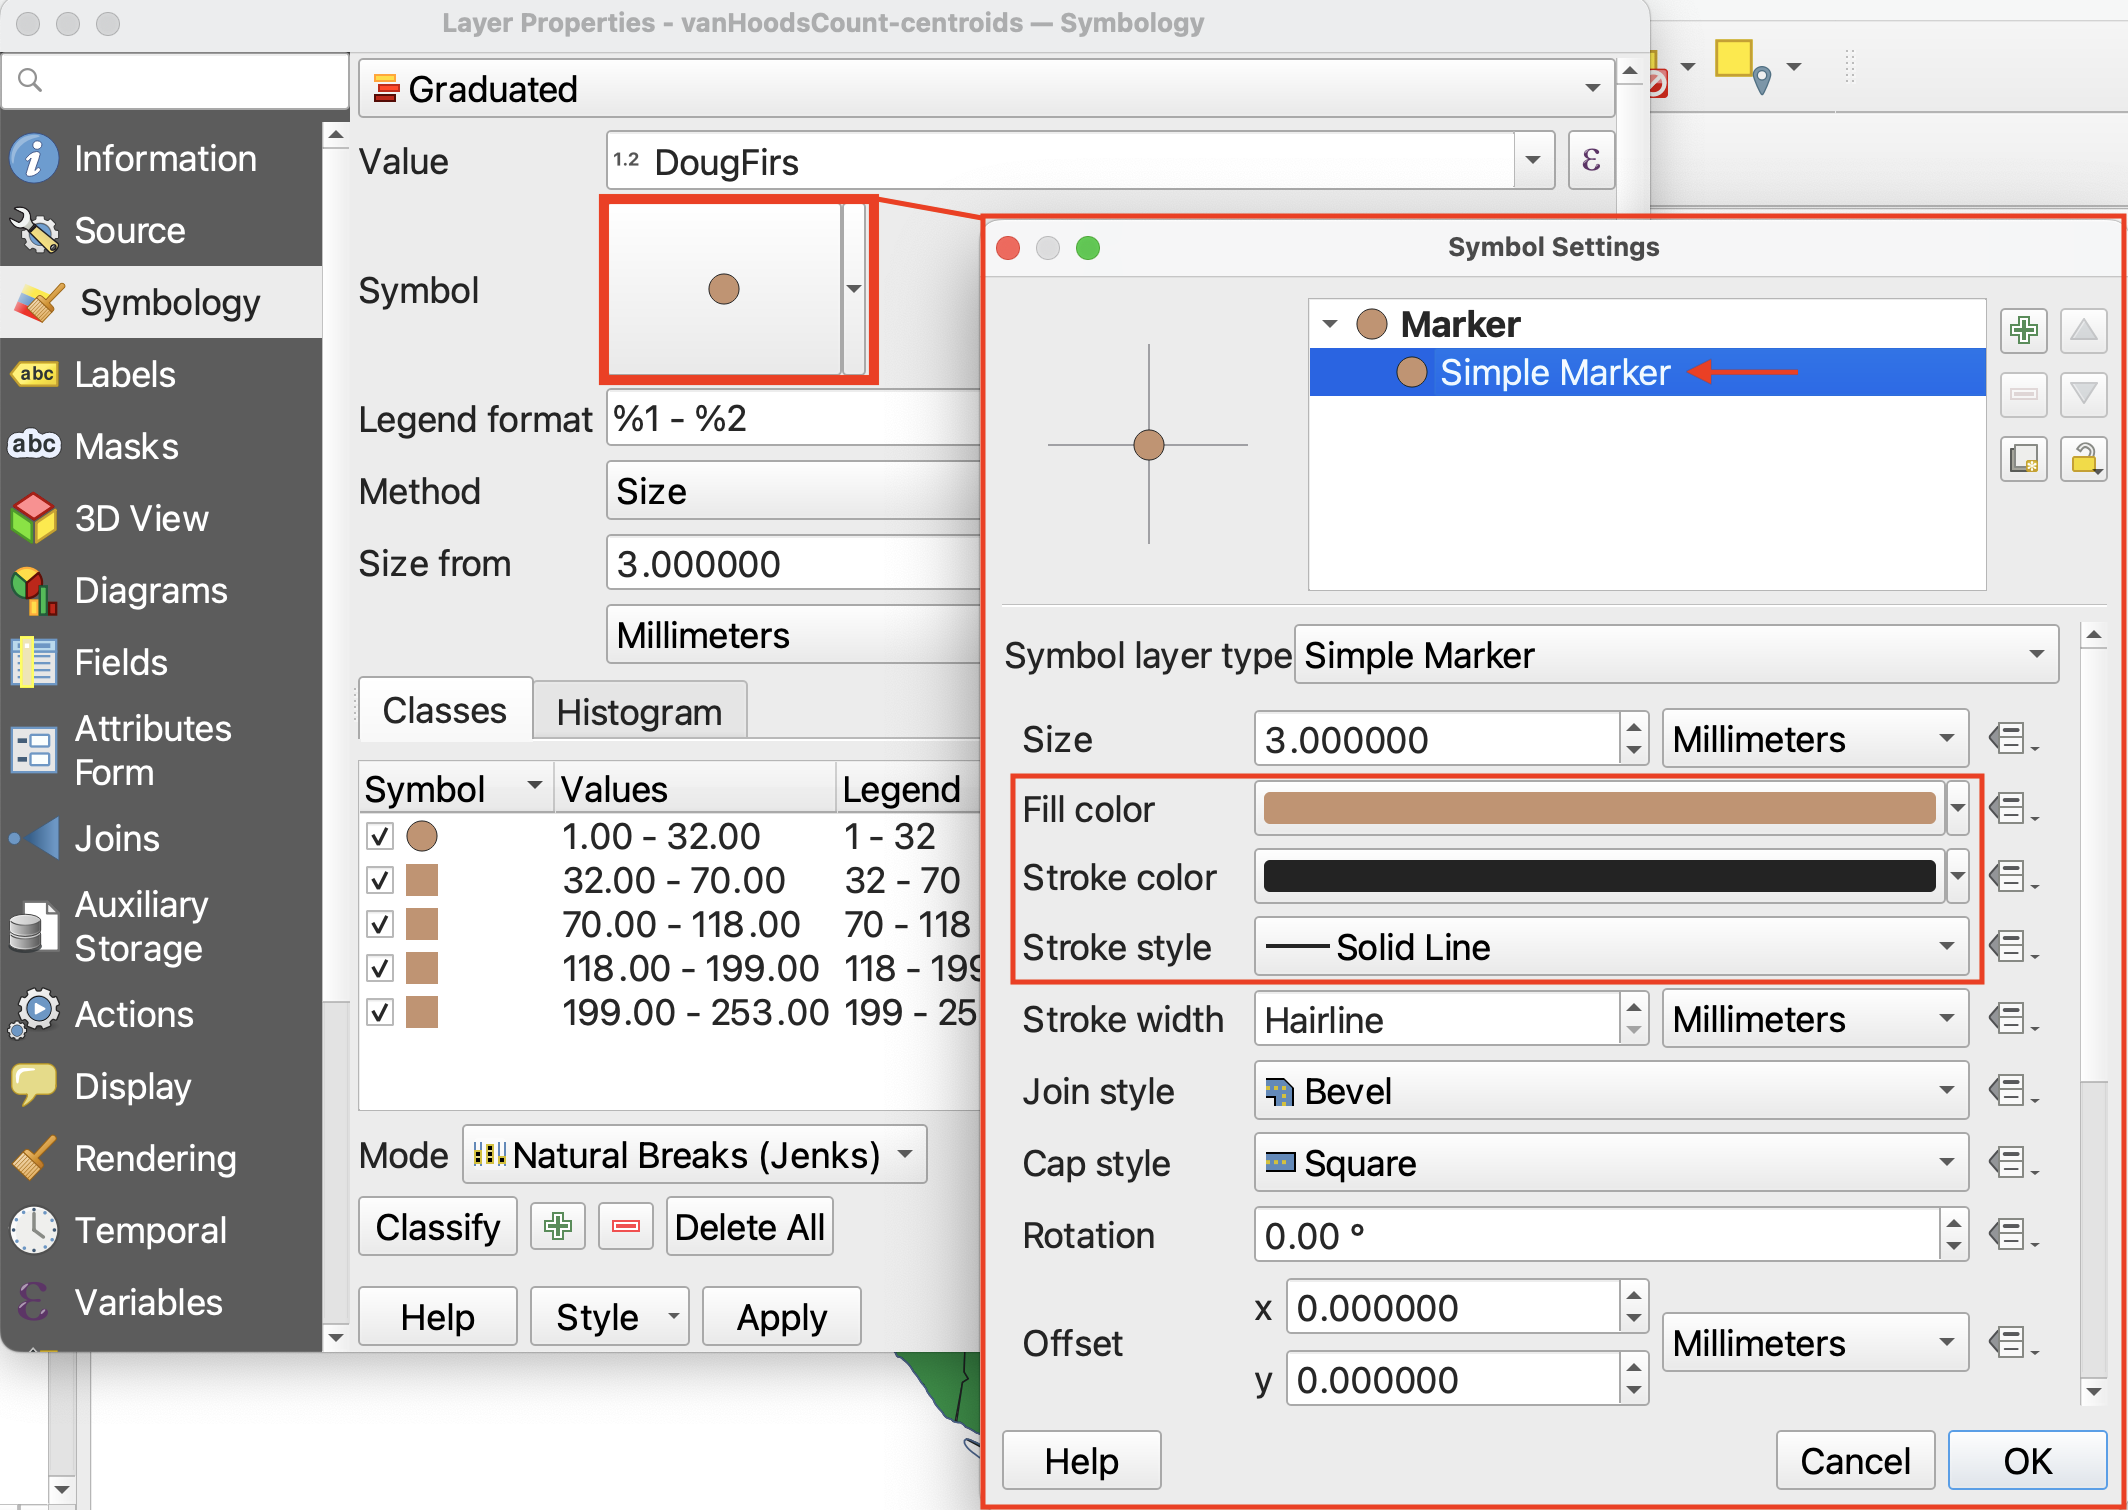
5 To change the symbol symbology, click on Symbol option and then select “Simple Marker”.
6 When you’re satisfied, click OK and return to the map view.

Loading last updated date...