Map Data
Inside the workshop data folder, besides boilerplate.html you should see van-parks.geojson, a geospatial file downloaded from Vancouver’s open data portal. van-parks.geojson is a geojson file containing point data for 216 parks across the city. Take a moment to view the dataset as a table and map in the open data portal.
GeoJSON
If you’ve used a geographic information system (GIS) before then you have likely encountered a Shapefile. Shapefiles are the industry standard file type for geographic vector data. Shapefiles are meant to be used in GIS software and weren’t designed to be displayed in the web. The GeoJSON format, on the other hand, is a geographic file type specifically meant for the web. GeoJSON files are “easy for humans to read, and easy for machines to read”, meaning that they’re a lightweight, simplified format so your average web browser can use them. GeoJSON code is fairly straightforward making it easy to understand and modify properties in a code editor. Here’s a single point for a park in Vancouver in GeoJSON format:
    {
      "type": "Feature",
      "geometry": {
        "type": "Point",
        "coordinates": [
          -123.108174,
          49.264334
        ]
      },
      "properties": {
        "parkid": 137,
        "official": 1,
        "hectare": 1.4,
        "neighbourhoodname": "Mount Pleasant",
        "facilities": "Y",
        "advisories": "N",
        "name": "Jonathan Rogers Park",
        "ewstreet": "W 7th Avenue",
        "specialfeatures": "N",
        "washrooms": "Y",
        "nsstreet": "Manitoba Street",
        "streetname": "W 7th Avenue",
        "streetnumber": 110,
        "googlemapdest": [
          49.264334,
          -123.108174
        ],
        "neighbourhoodurl": "https://vancouver.ca/news-calendar/mount-pleasant.aspx"
      }
    }
Even without prior GeoJSON knowledge, can you deduce the name of this park and whether or not it has washrooms? A shapefile, in contrast, is a binary (0s and 1s, not text) format, so you wouldn’t be able to read the file with human eyes. For these reasons, this workshop uses GeoJSON data.
Visualizing GeoJSON
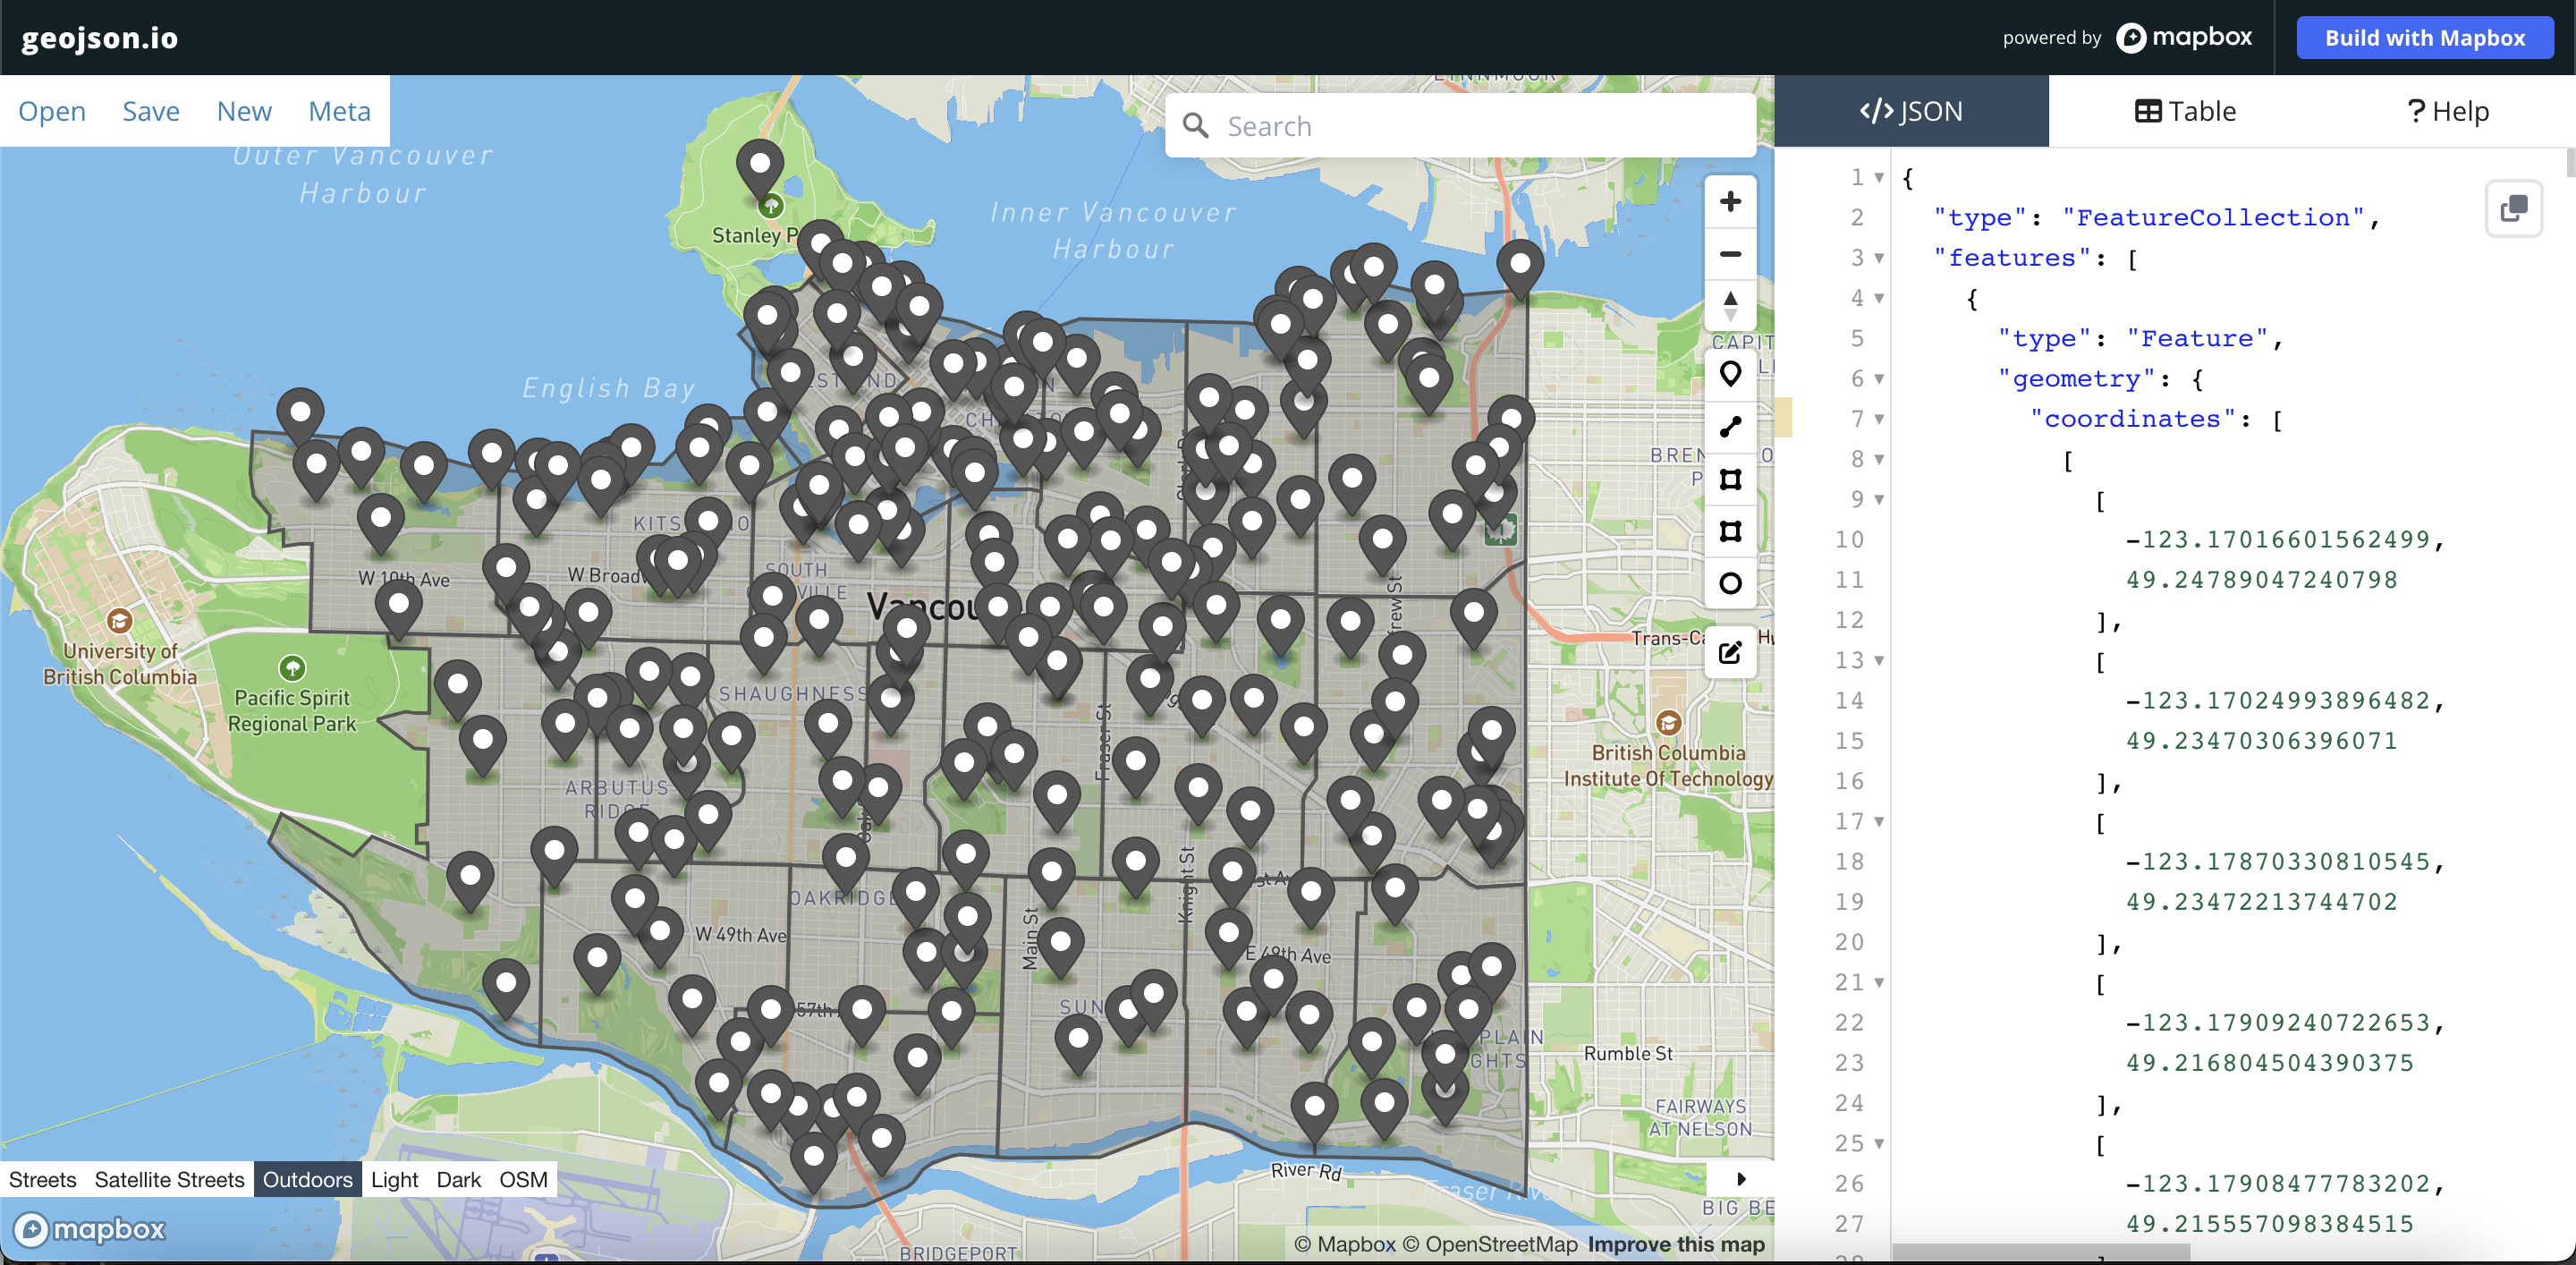
One other great thing about GeoJSON, is that because they are open-source and simple to understand, there are several tools that allow you to create and edit them in the web, like geojson.io.
To Do
- Go to geojson.io and delete existing geoJSON text on the </>JSON panel.
- Copy the GeoJSON text above and paste it into the blank the </>JSON panel.
- On the right-hand side of the map interface there is a vertical toolbar.Use the + icon from the map toolbar to zoom into the icon that for Jonathan Rogers Park you just added to the basemap. Click on the pop-up to see the feature properties. Here you can add new information about the park, for instance, a personal_memory column. Use the edit button (at the bottom of the same toolbar) to drag the point to another location.
- Open geojson.io again in a new tab. Drag and drop
van-parks.geojsoninto the </>JSON panel. This is a quick and easy way to visualize a GeoJSON dataset before you begin web-mapping. Now let’s return to the code editor and addvan-parks.geojsonto the map.