Practice
Practice choosing a dataset from Vancouver’s open data portal, downloading it, and adding it to your map. Remember to specify geometry type when adding sources. Take a few minutes to try on your own or refer to the hints below.
-
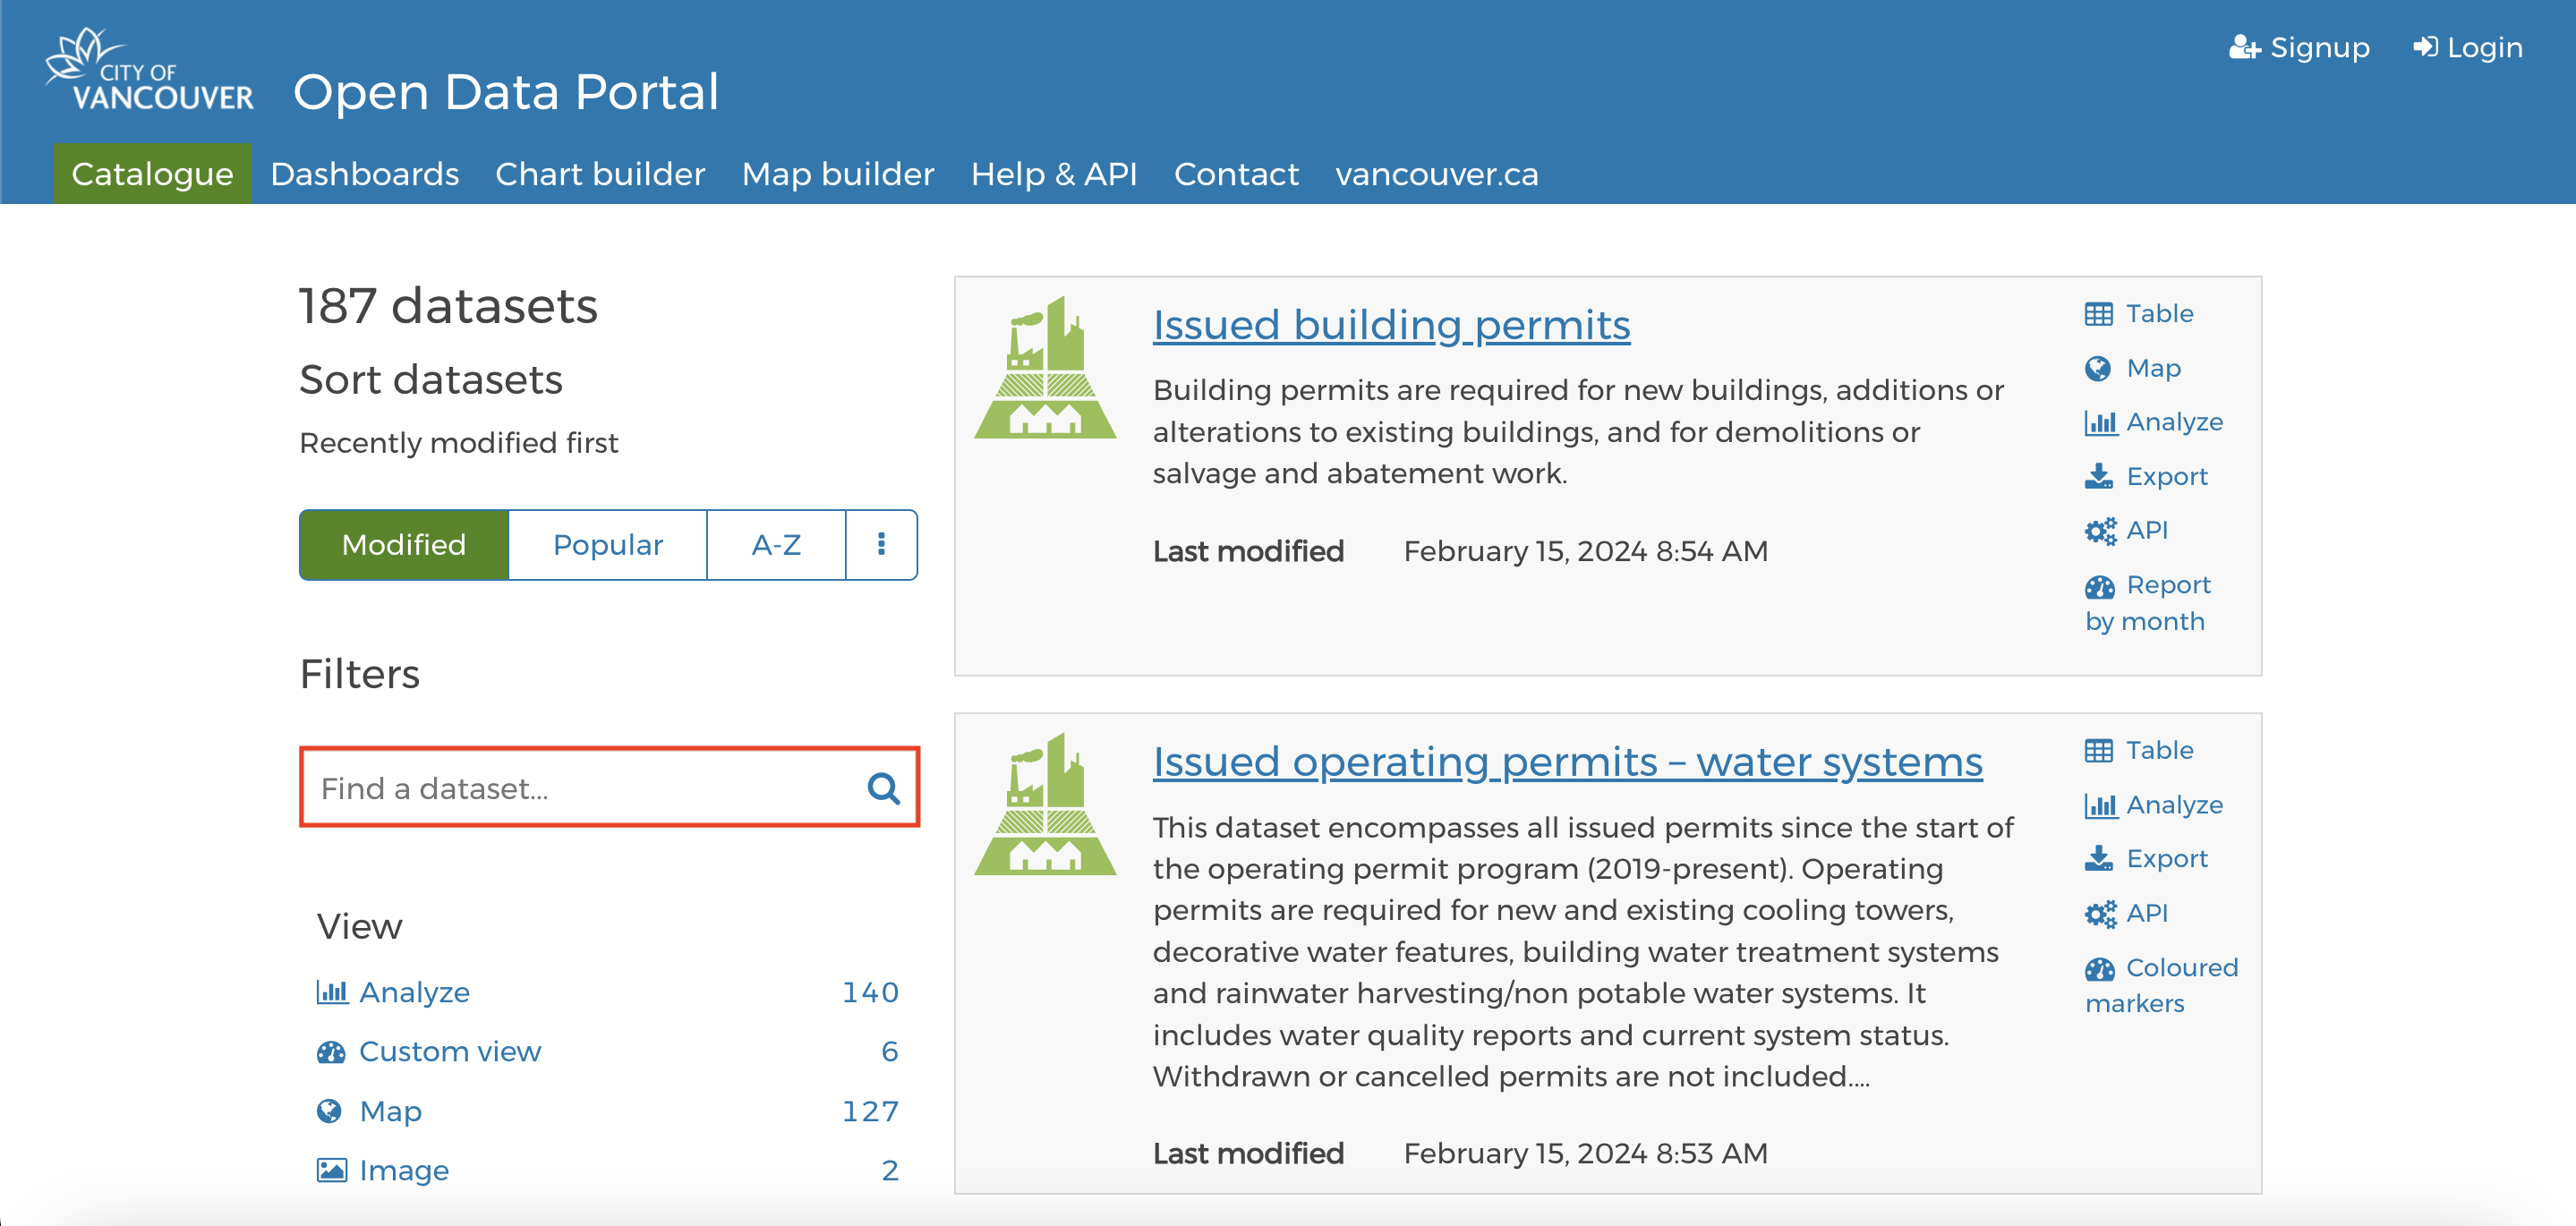
Go to Vancouver open data portal
-
Browse or filter for datasets, eg
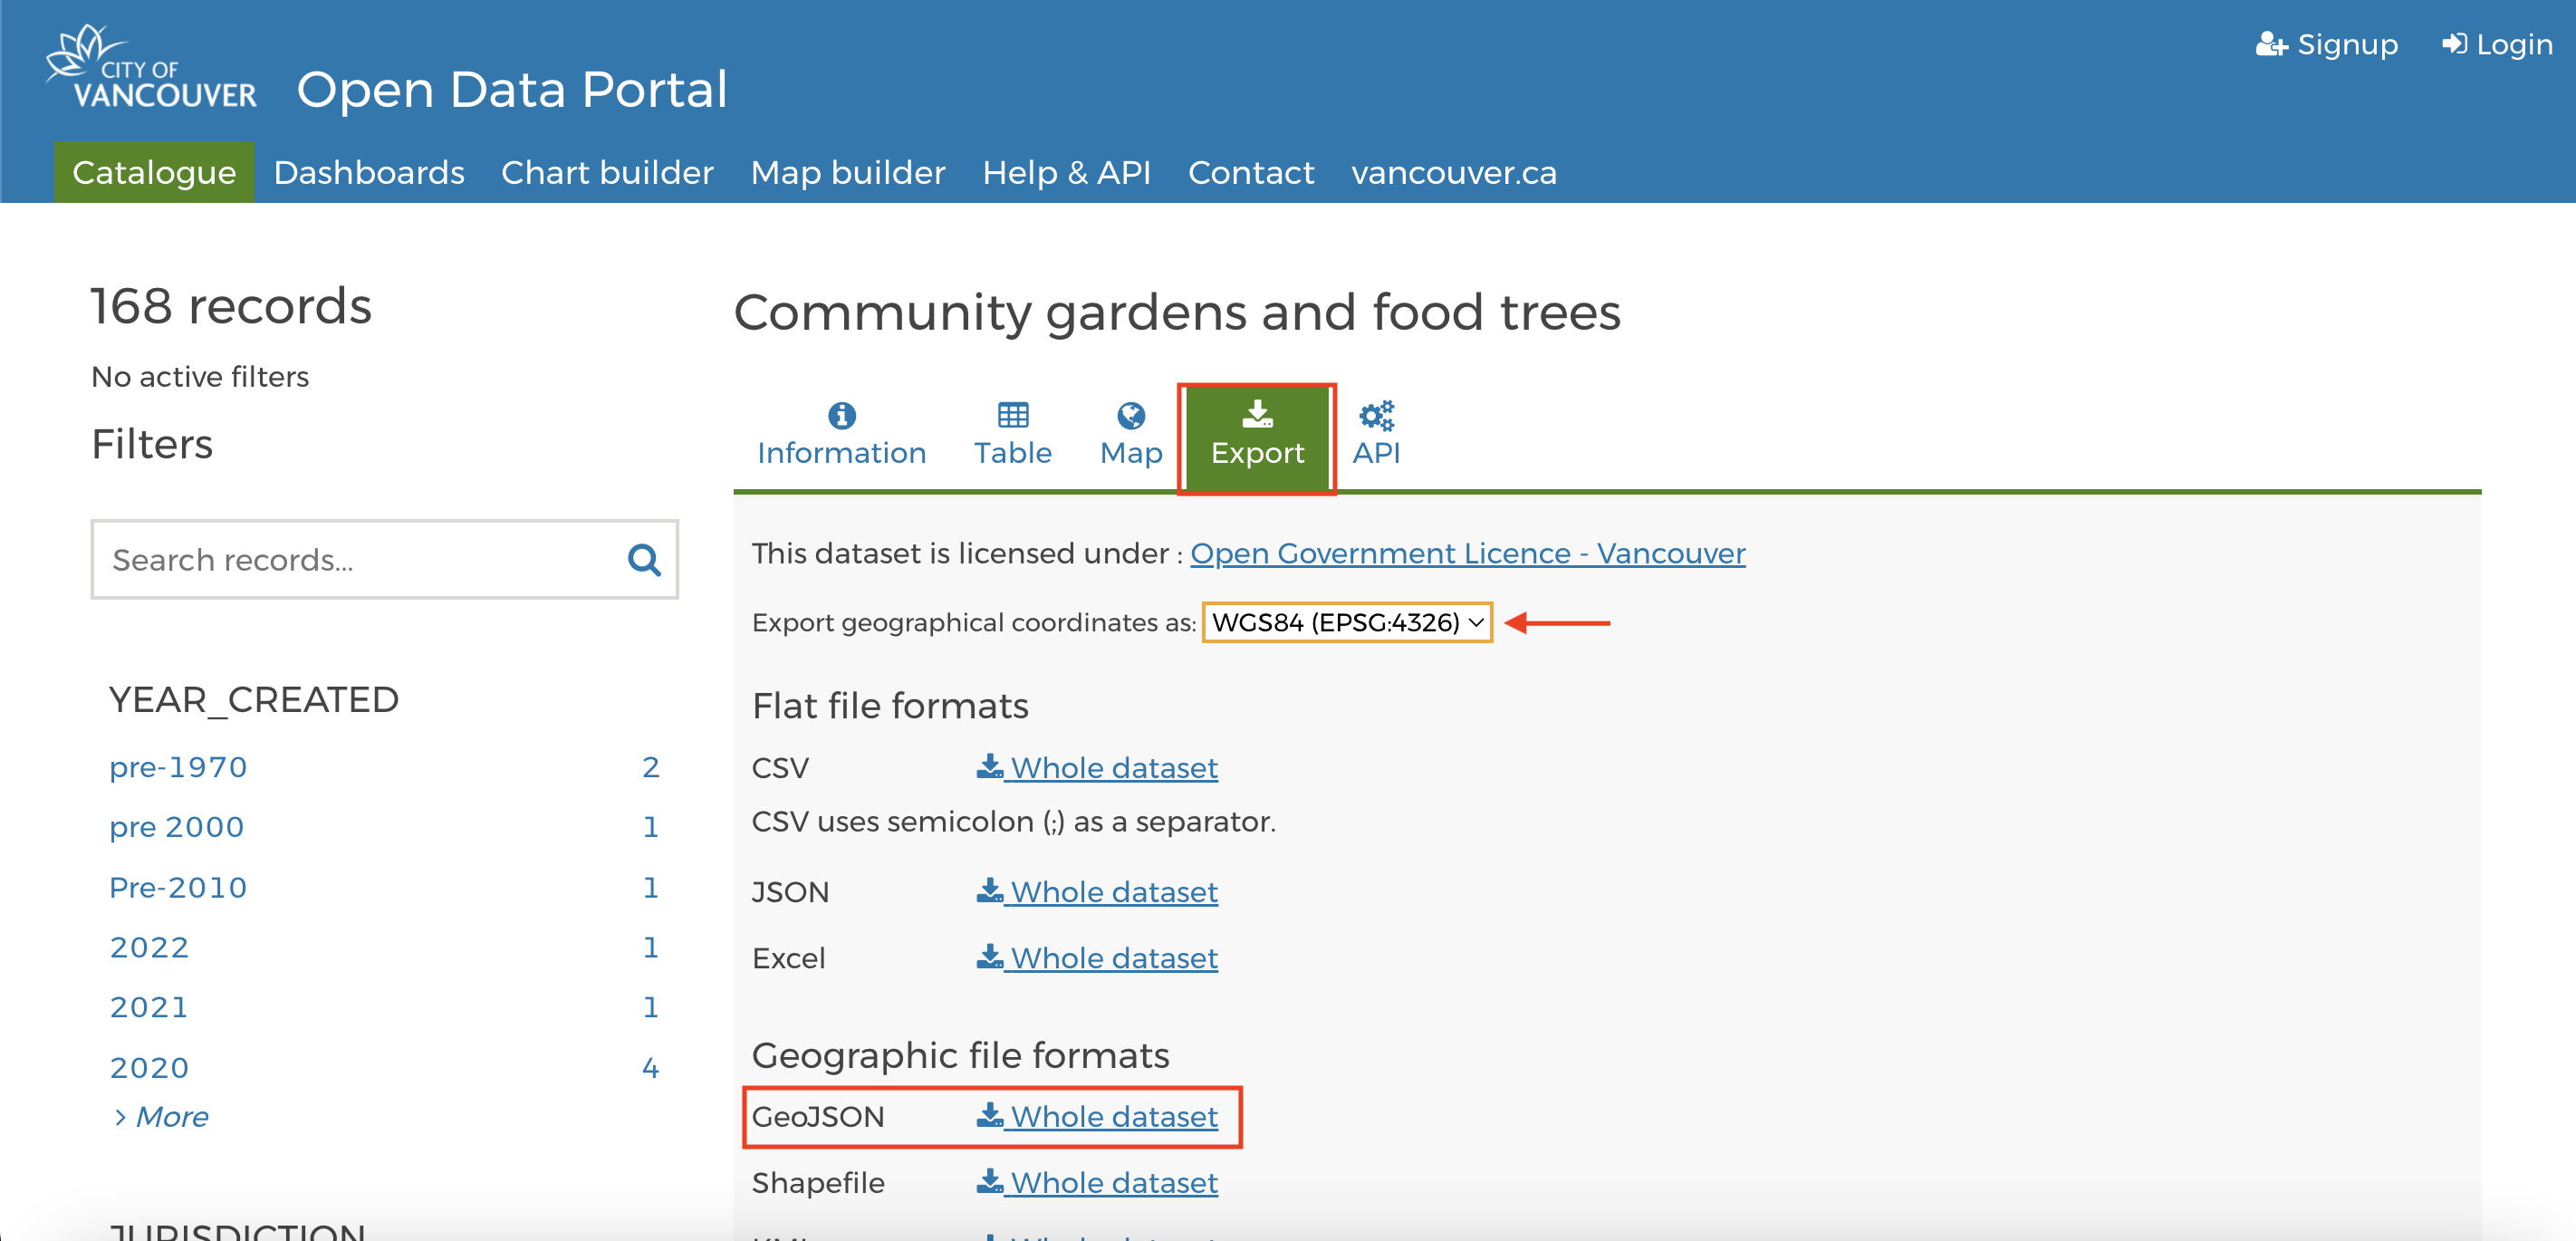
Community gardens and food trees -
Export data in geoJSON format. Keep projection set to WGS 84; web maps are projected in WGS 84 web mercator.
-
Locate downloaded file on your computer and move to workshop data folder
-
Add as a source and as a layer inside script tag and
map.on('load', () => {function. Make sure to update the name paramater within inside the source, as well as how it appears in the add layer function. If you downloaded Community gardens and food trees, see example below. Style your data as you’d like.
map.addSource('gardens', {
                type: 'geojson',
                data: './community-gardens-and-food-trees.geojson',
            });

            map.addLayer({
                'id': 'garden-markers',
                'type': 'circle',
                'source': 'gardens',
                'paint': {
                    'circle-color': '#f27ed3',
                    'circle-radius': 3
                }
            });

That’s that! Take a moment to browse Vancouver’s open data catalogue while exploring Mapbox Tutorials. What Mapbox skills interest you and what datasets might you use to practice?