3.2 Repeating Actions Over Multiple Files
Objectives
- Use a library function to get a list of filenames that match a wildcard pattern.
- Write a
forloop to process multiple files.
Questions
- How can I do the same operations on different files?
In order to repeat an action over multiple files, we need a way to get a list of the relevant files. We’ll start by getting a list of files that begin with "2026-02-18_google-trends-search- and end with VALUES.csv. The following library will help us to achieve this:
import glob
The glob library contains a function, also called glob, that finds files and directories whose names match a pattern. We provide those patterns as strings: the character * matches zero or more characters, while ? matches any one character. We can use this to get the names of all the CSV files in the current directory:
print(glob.glob("2026-02-18_google-trends-search-*VALUES.csv"))
['2026-02-18_google-trends-search-2_VALUES.csv', '2026-02-18_google-trends-search-1_VALUES.csv']
As these examples show, glob.glob’s result is a list of file and directory paths in arbitrary order. This means we can loop over it to do something with each filename in turn. In our case, the “something” we want to do is generate a set of plots for each file.
If we want to go through the files in alphabetical order, we can use the sorted built-in function to generate a new sorted list from the glob.glob output:
import glob
import numpy
import matplotlib.pyplot
filenames_original = glob.glob("2026-02-18_google-trends-search-*VALUES.csv")
filenames_sorted = sorted(filenames_original)
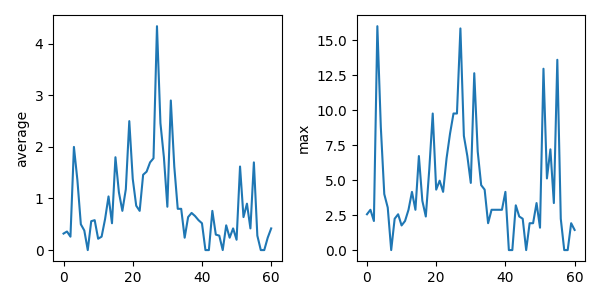
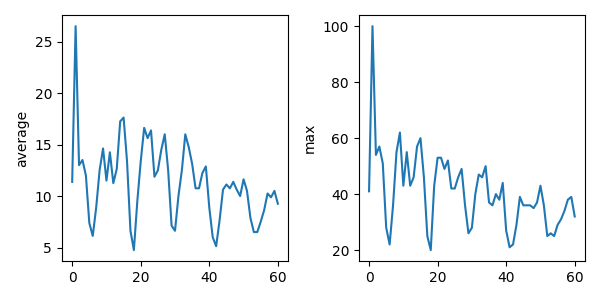
for filename in filenames_sorted:
print(filename)
data = numpy.loadtxt(fname=filename, delimiter=",")
fig, axs = matplotlib.pyplot.subplots(1, 2, figsize=(6, 3))
axs[0].set_ylabel("average")
axs[0].plot(numpy.mean(data, axis=0))
axs[1].set_ylabel("max")
axs[1].plot(numpy.amax(data, axis=0))
fig.tight_layout()
figure_filename = f"3.2_plot_{filename[:-4]}.png"
fig.savefig(figure_filename)
2026-02-18_google-trends-search-1_VALUES.csv
2026-02-18_google-trends-search-2_VALUES.csv
Key points
- Use
glob.glob(pattern)to create a list of files whose names match a pattern. - Use
*in a pattern to match zero or more characters, and?to match any single character.
Loading last updated date...