Practice
Add another marker
Try adding another stand-alone marker to your map, and adding an image to the popup. Remember to add any images you want to include to your webmapping-workshop data folder so you can easily link them with relative file paths.
Add another dataset
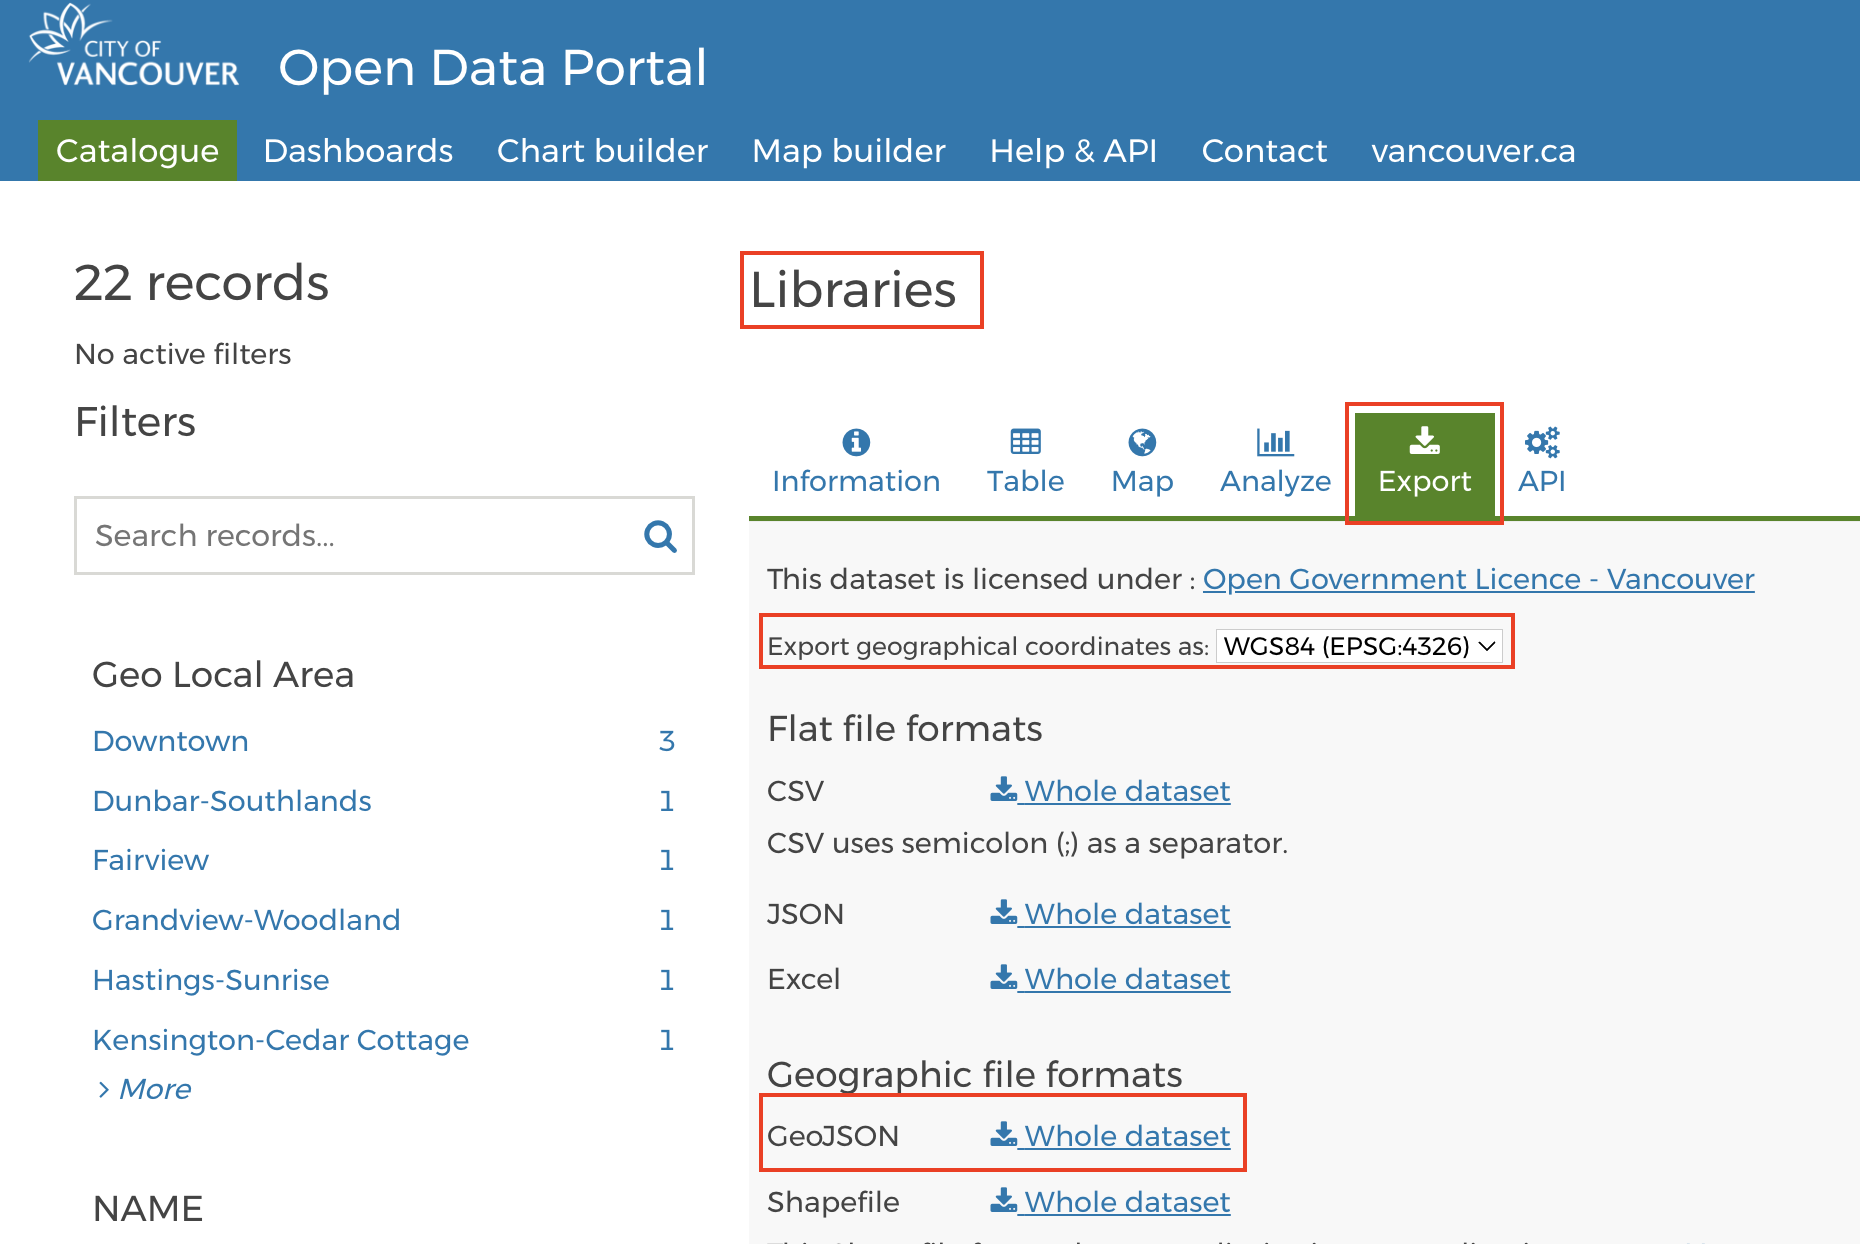
Practice what you’ve learned in this workshop by choosing a new dataset from Vancouver’s open data portal to add to your web map. You will need to download the dataset in GeoJSON format, move it to your webmapping-workshop folder, wrap it as a JavaScript variable, and add it as both a data source in the <head> element and as a data layer in your <script> element.
Take a moment to practice on your own. Reference the hints below if you get stuck.
-
For example, download Local area boundaries, aka neighborhoods or Vancouver Public Libraries (polygon representation) from the Open Data Portal.
-
Move the download file,
libraries.geojson, to your workshop folder. It’s important your data be in the same folder of your web map’s HTML document. -
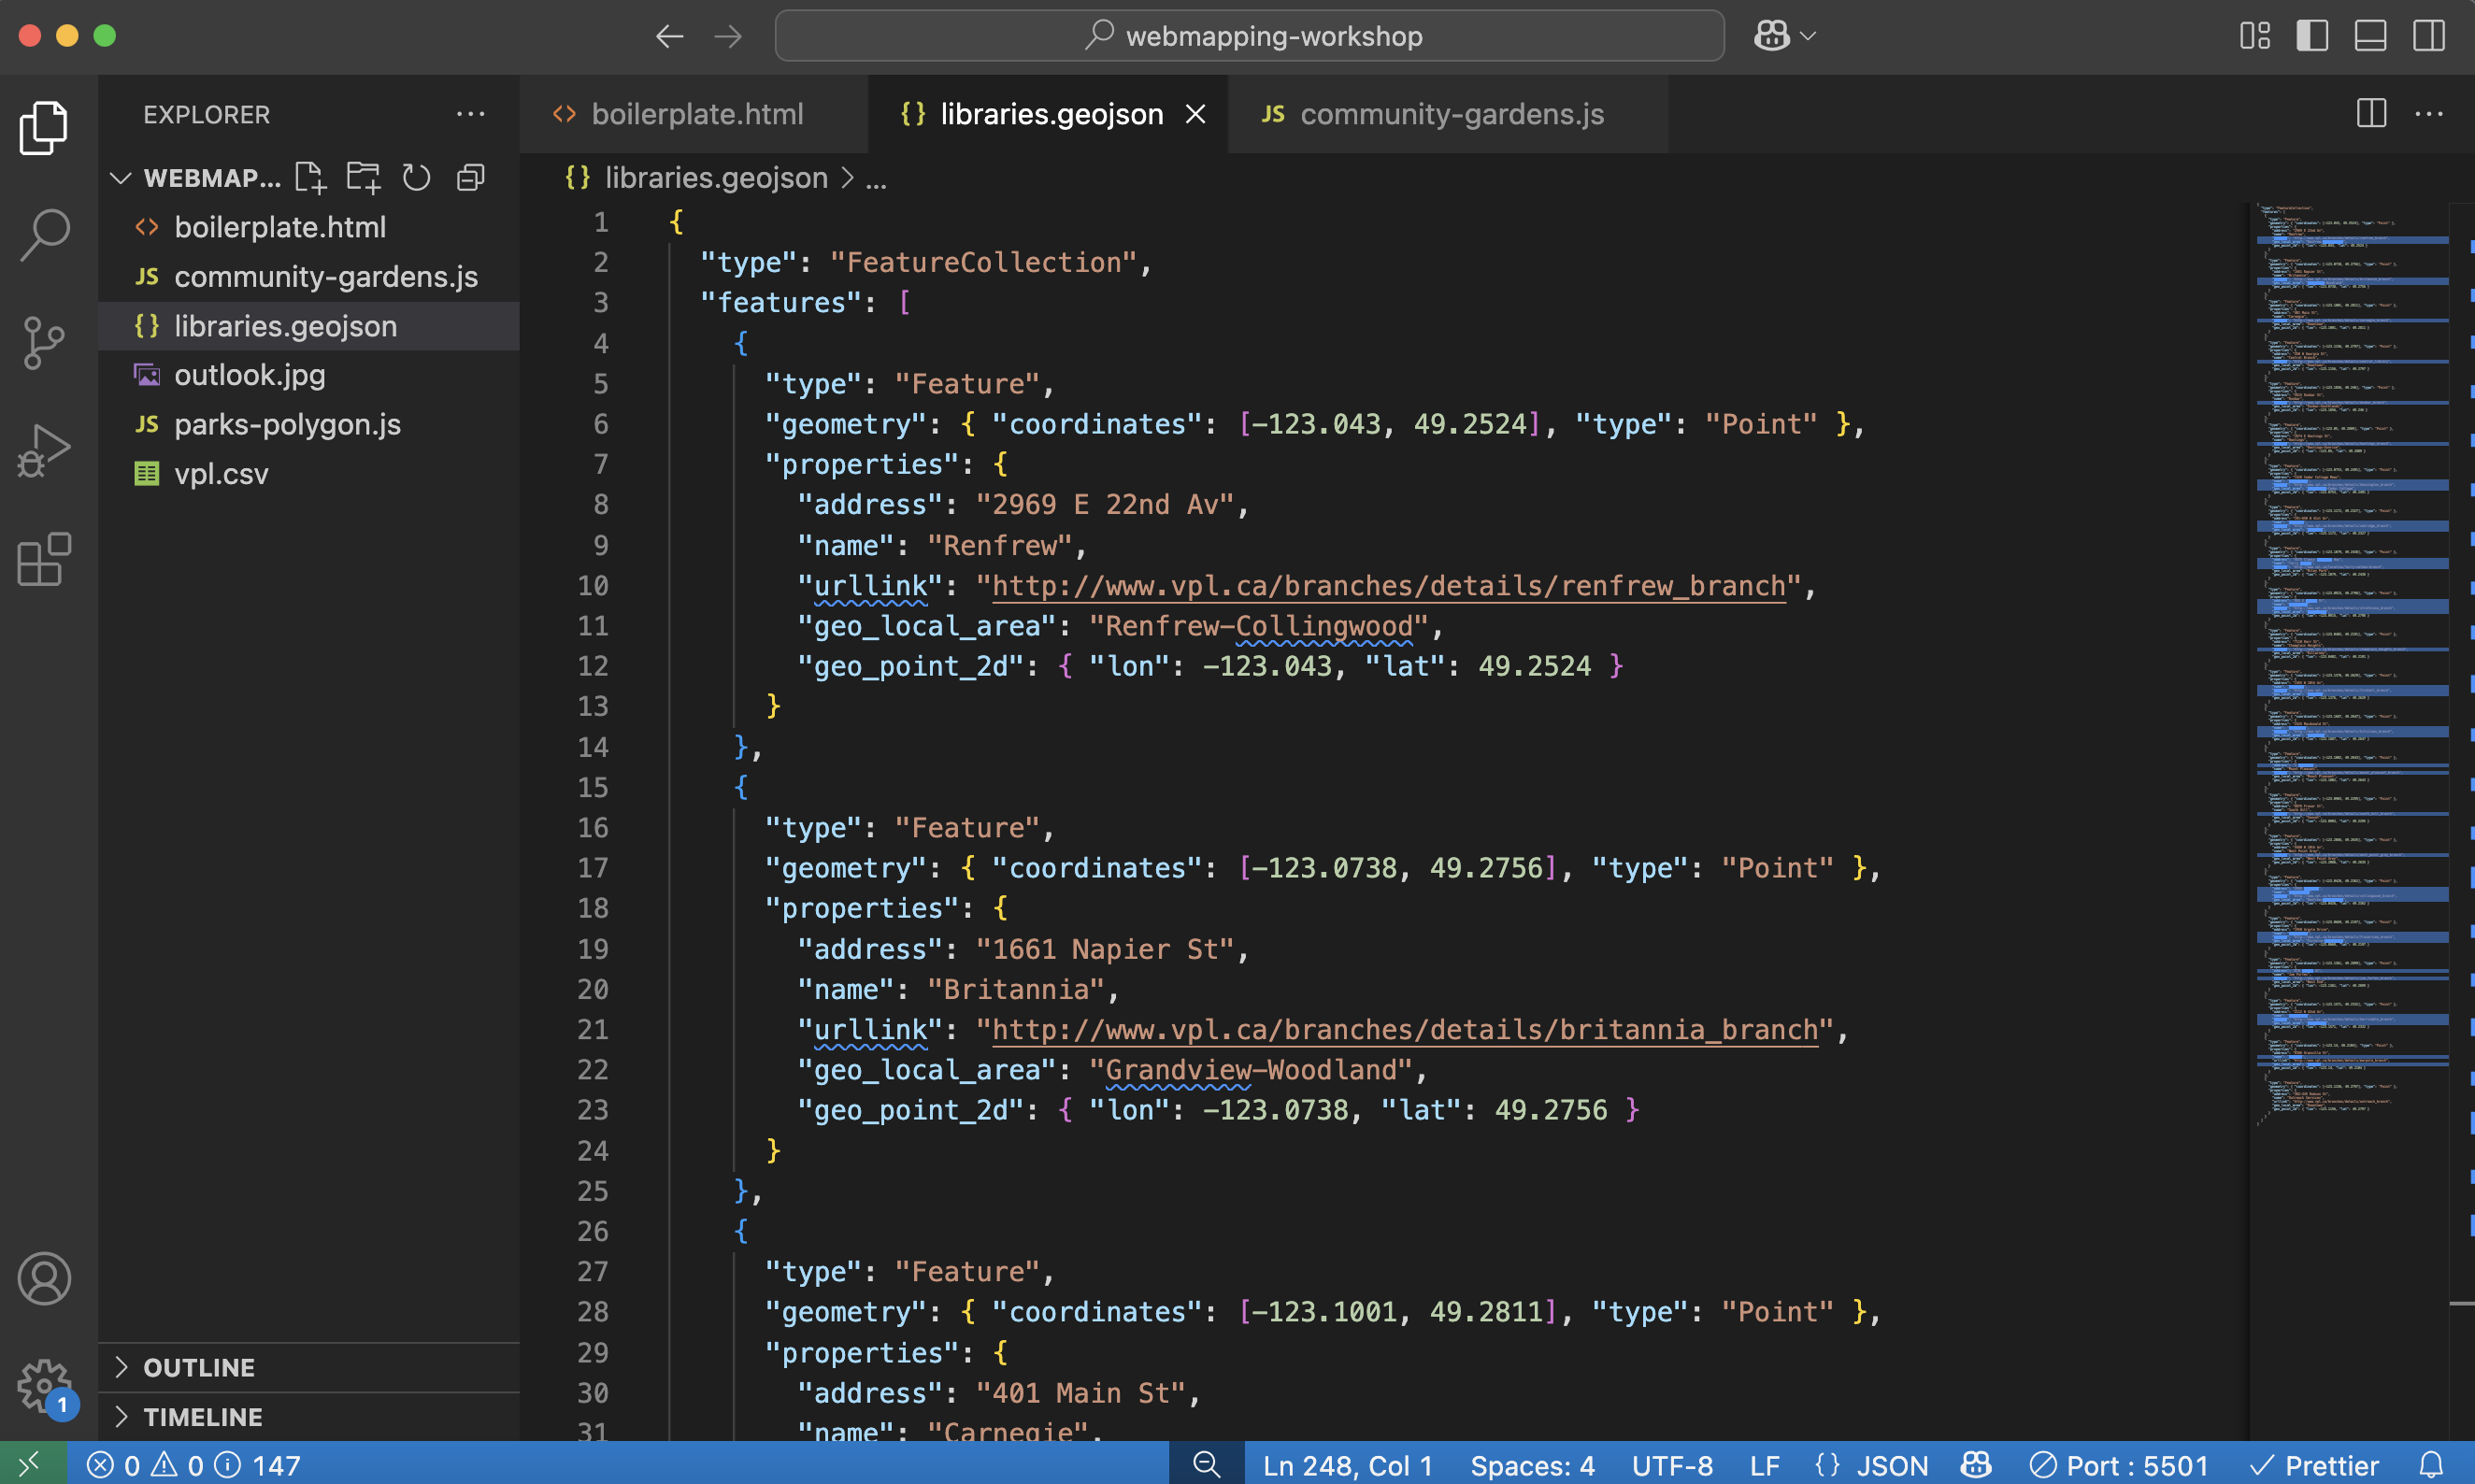
Open the dataset in VSCode. It will either appear in your Contents after you add it to your working folder, or you can right-click it from your computer and open it with VSCode.
-
It will look like a wall of code. Right-click anywhere on the page and format it.
-
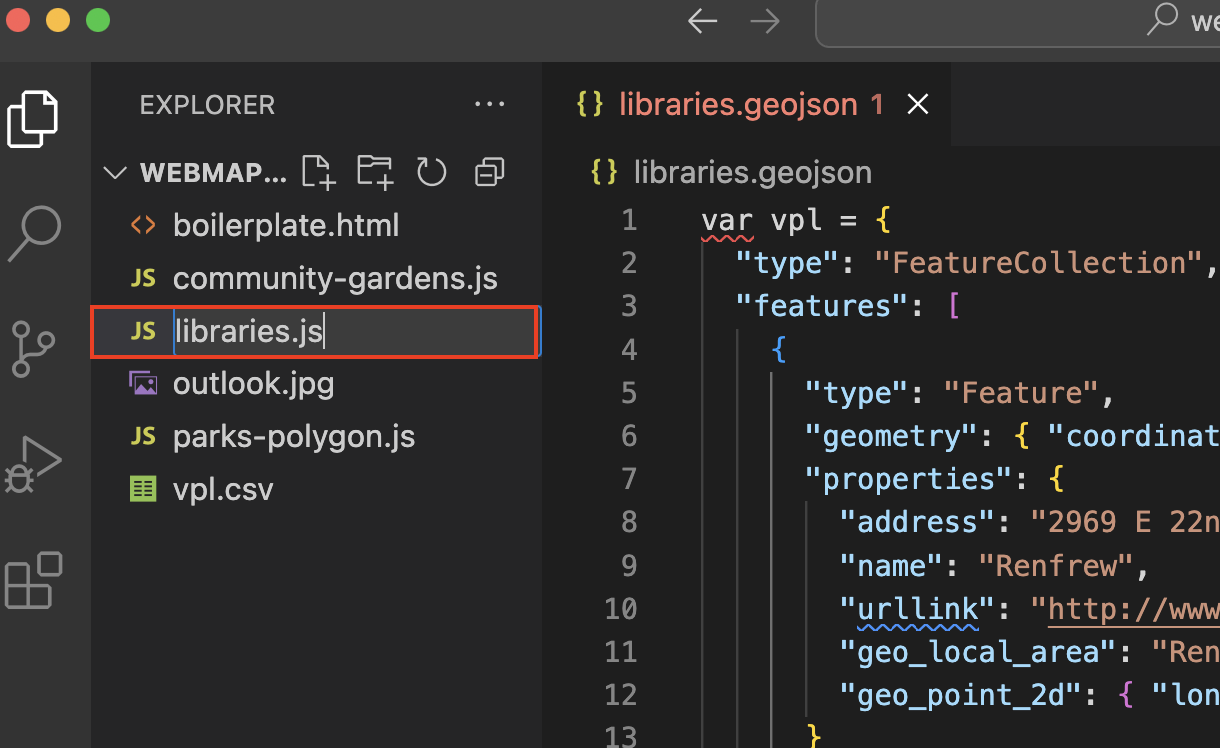
Now wrap it as the variable
vpl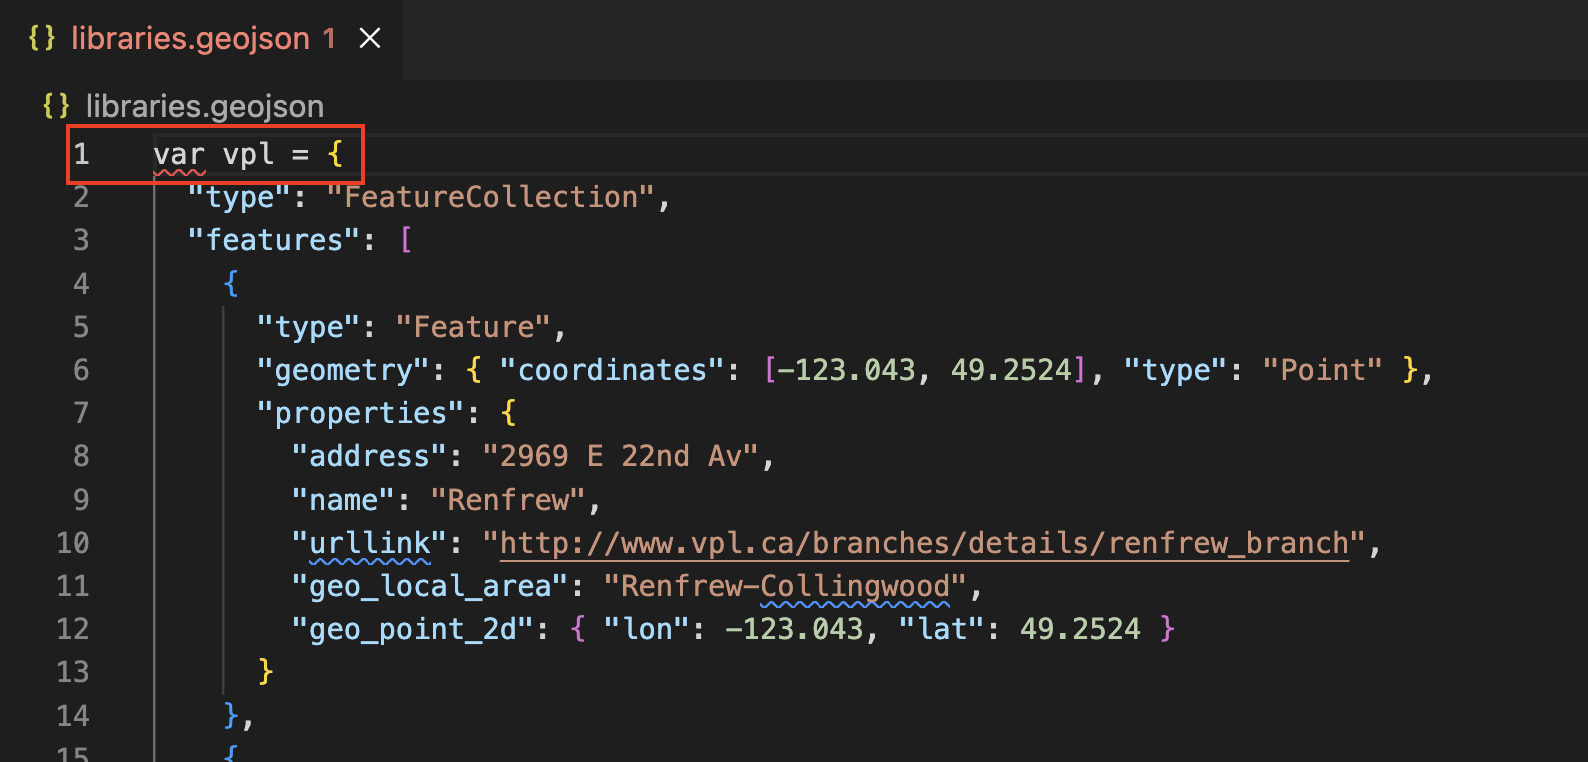
-
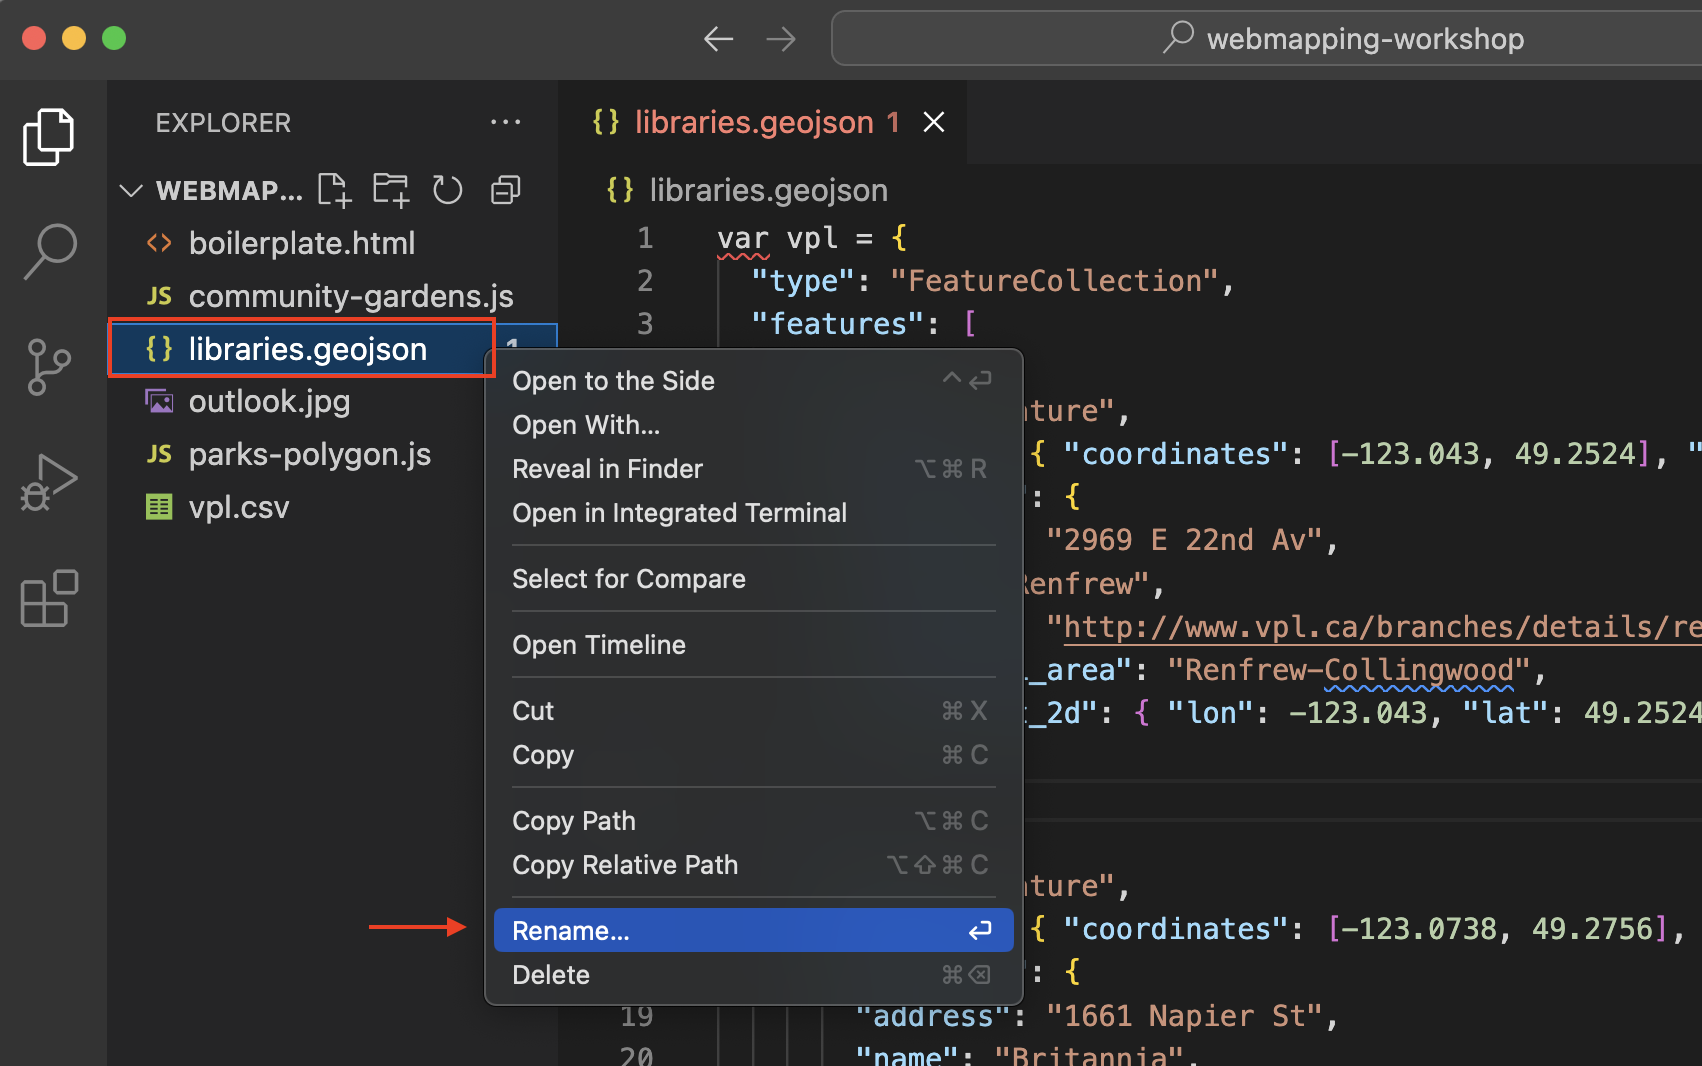
You’ll notice the name of the document becomes red, signifying there’s a syntax error somewhere in the document. There isn’t. Rather, you have formatted the document as JavaScript, but the file extension is still GeoJSON. Rename the file with the proper extension:
vpl.js. You can do this by simply right-clicking the file in VSCode and choosing to rename it. Then simply replace the extension geojson with js.
-
Return to VSCode and open the new dataset,
vpl.js. Everything should be in order now with no warnings. - Now, return to your
boilerplate.htmldocument in VS Code. In the<head>tag, add a line beneath your current data sources that directs your map to your libraries data:
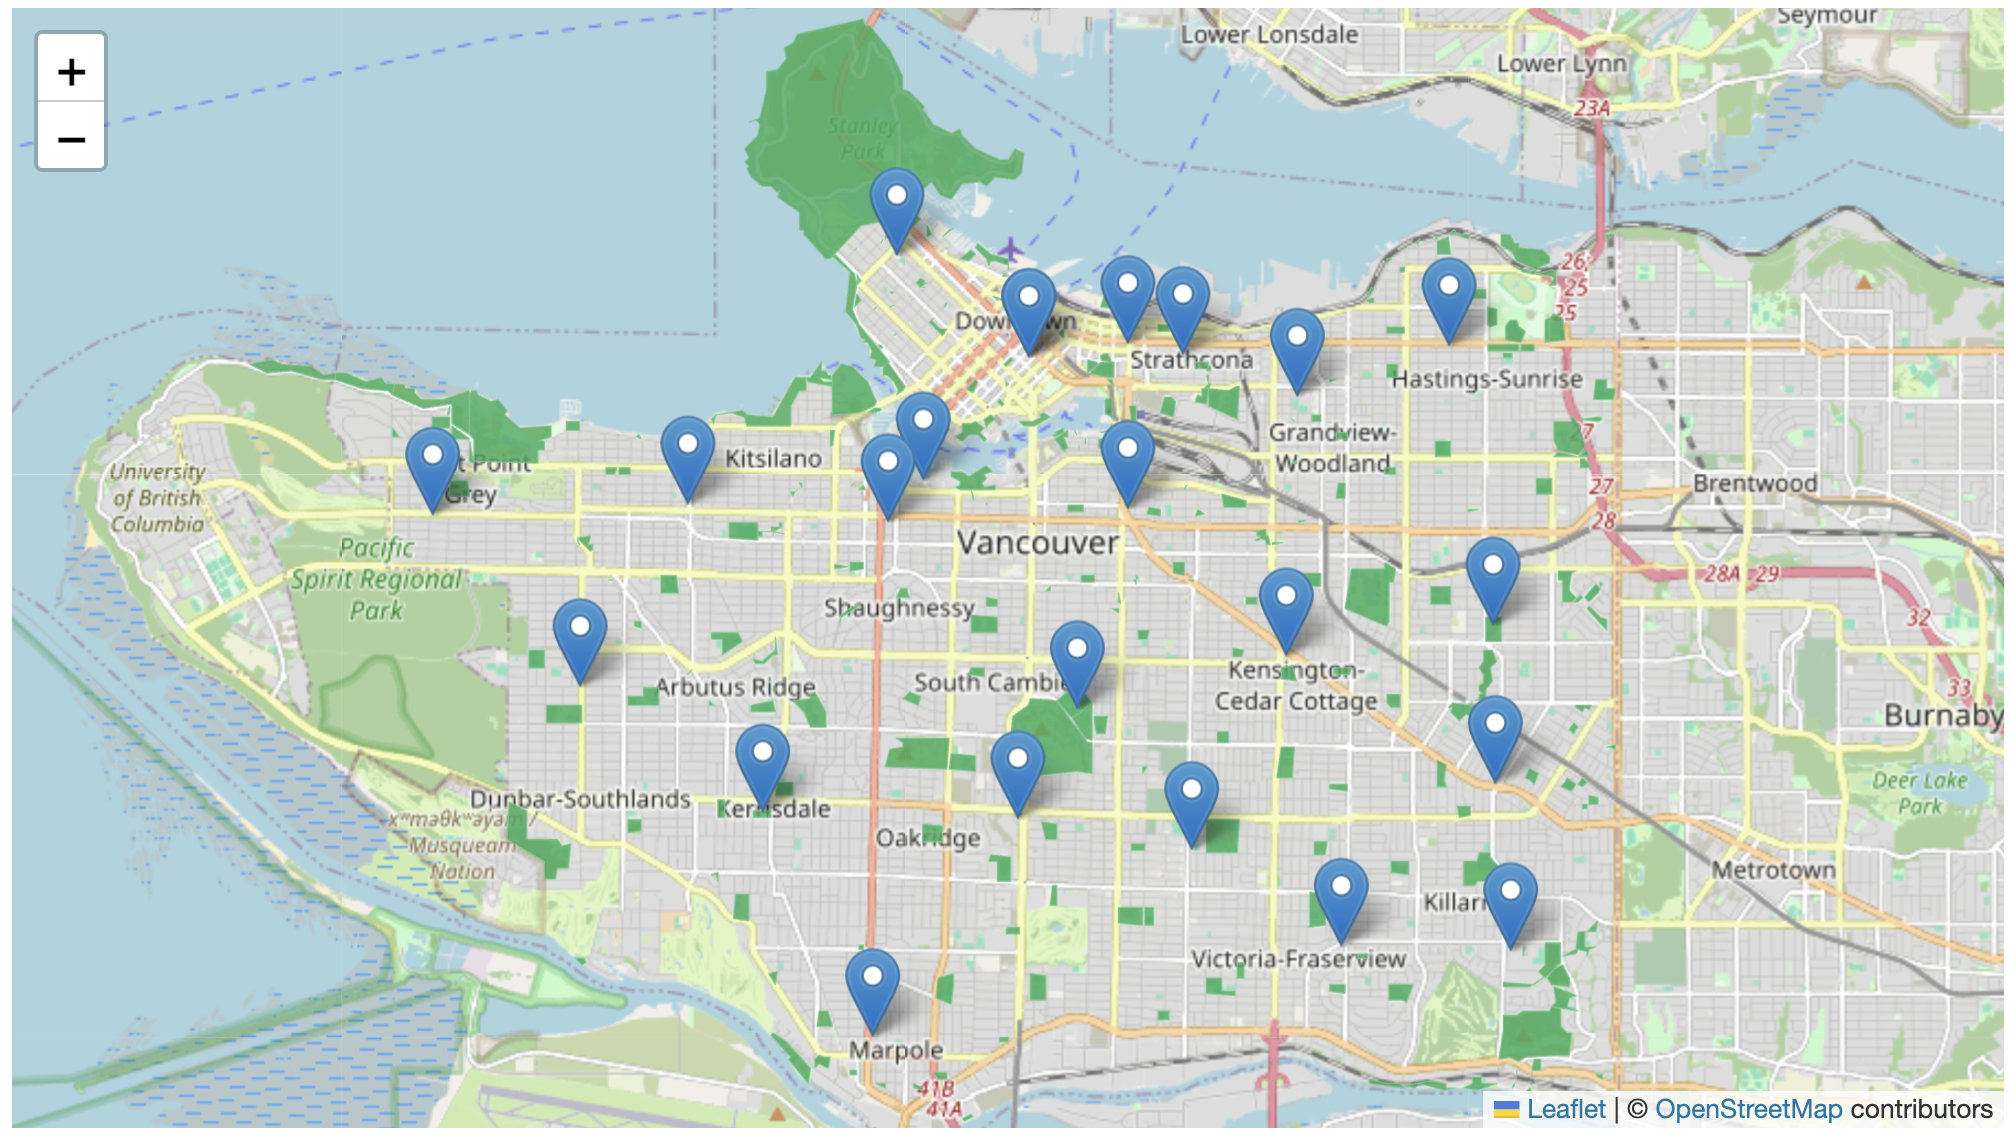
<script src="./libraries.js" charset="utf-8"></script> - Then, in the
<script>tag of the body element, add a function to add your second data source as a layer:
L.geoJSON(vpl).addTo(mymap); - Save your HTML file and go to your Live Server. You should see your data layer added to the map.
You can now experiment with adding pop-ups for the libraries. Remember though, you might need to move all your code for libraries into a new script tag if you want your other data layers to maintain their interactivity as well.
View workshop content in GitHub
Loading last updated date...