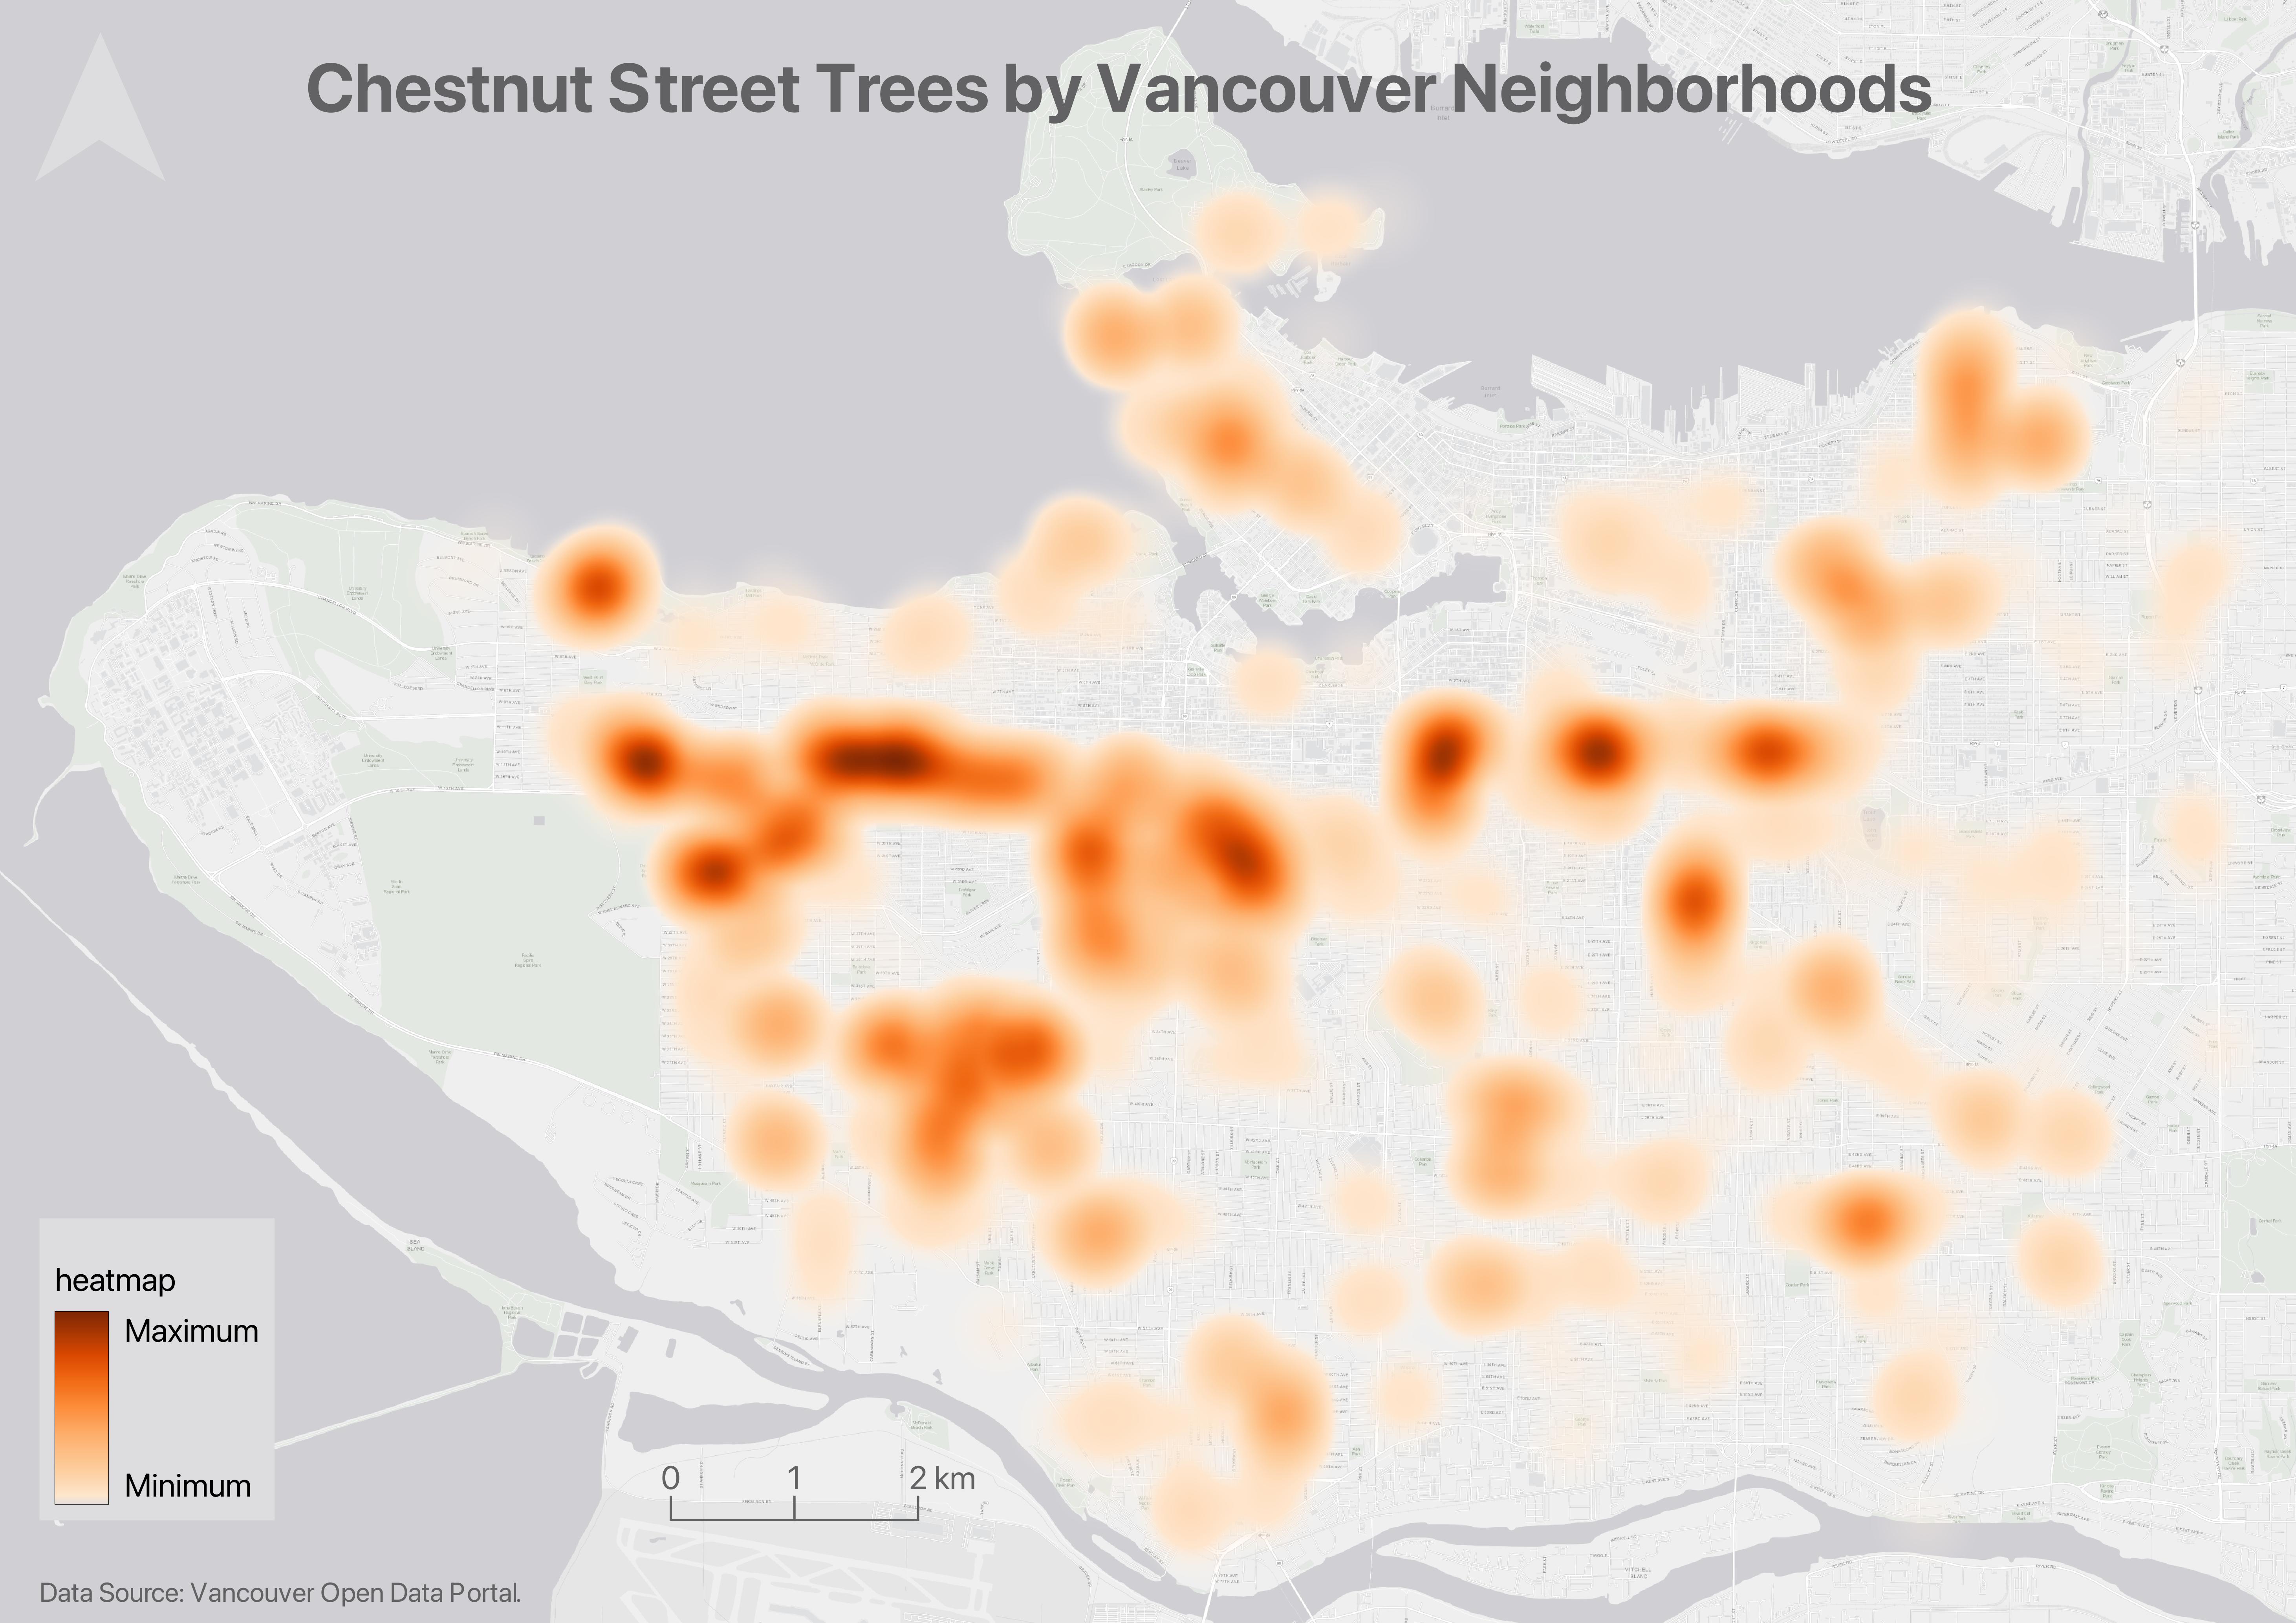
Heatmaps
Heatmaps are useful to show intensity or frequency of occurrence. Heatmaps can be thought about as generalized dot density maps.
If you haven’t already, please download and unzip the workshop folder. Remember to download it to a location on your physical computer, like Desktop or Downloads. Do not download it to OneDrive. The data for the Additional Content exercises (such as this one) will be in the thematic-mapping subfolder.
Making a heatmap
1 Add the layer chestnut-trees.geojson from the thematic mapping subfolder to your QGIS project.
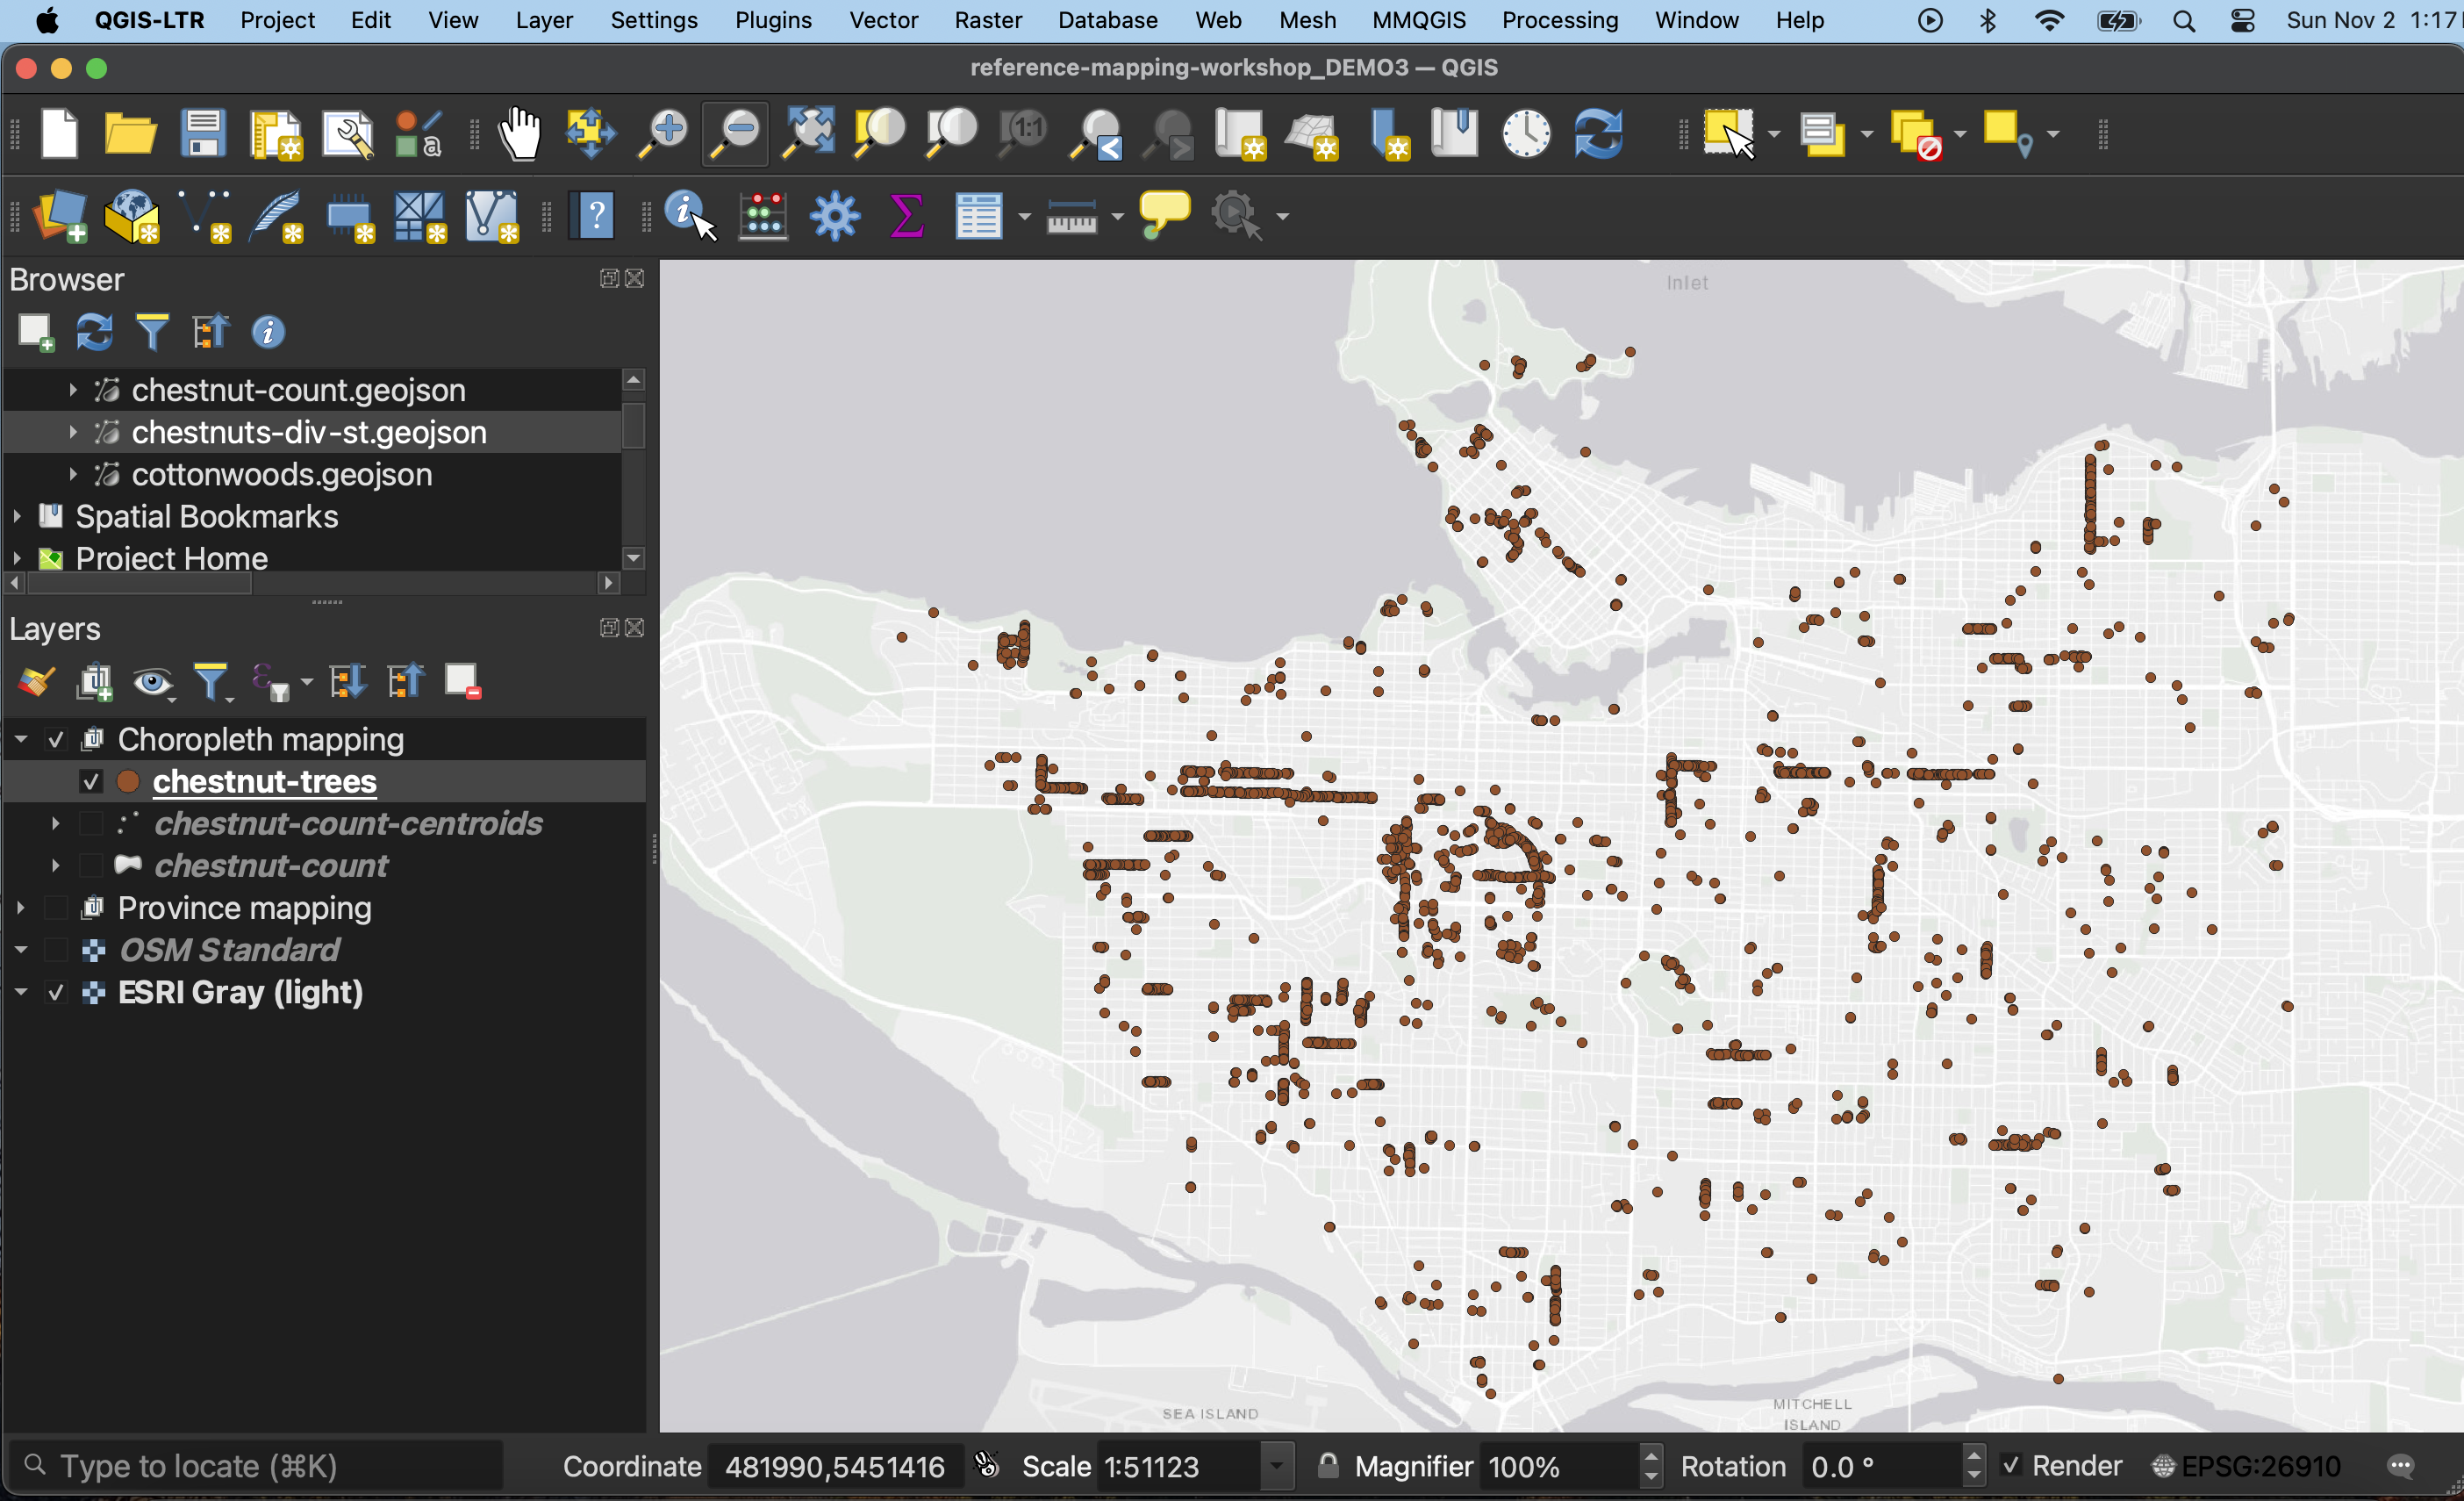
As it is, this is a dot density map. Now let’s make it into a heatmap to accentuate areas where there are more chestnut street trees.
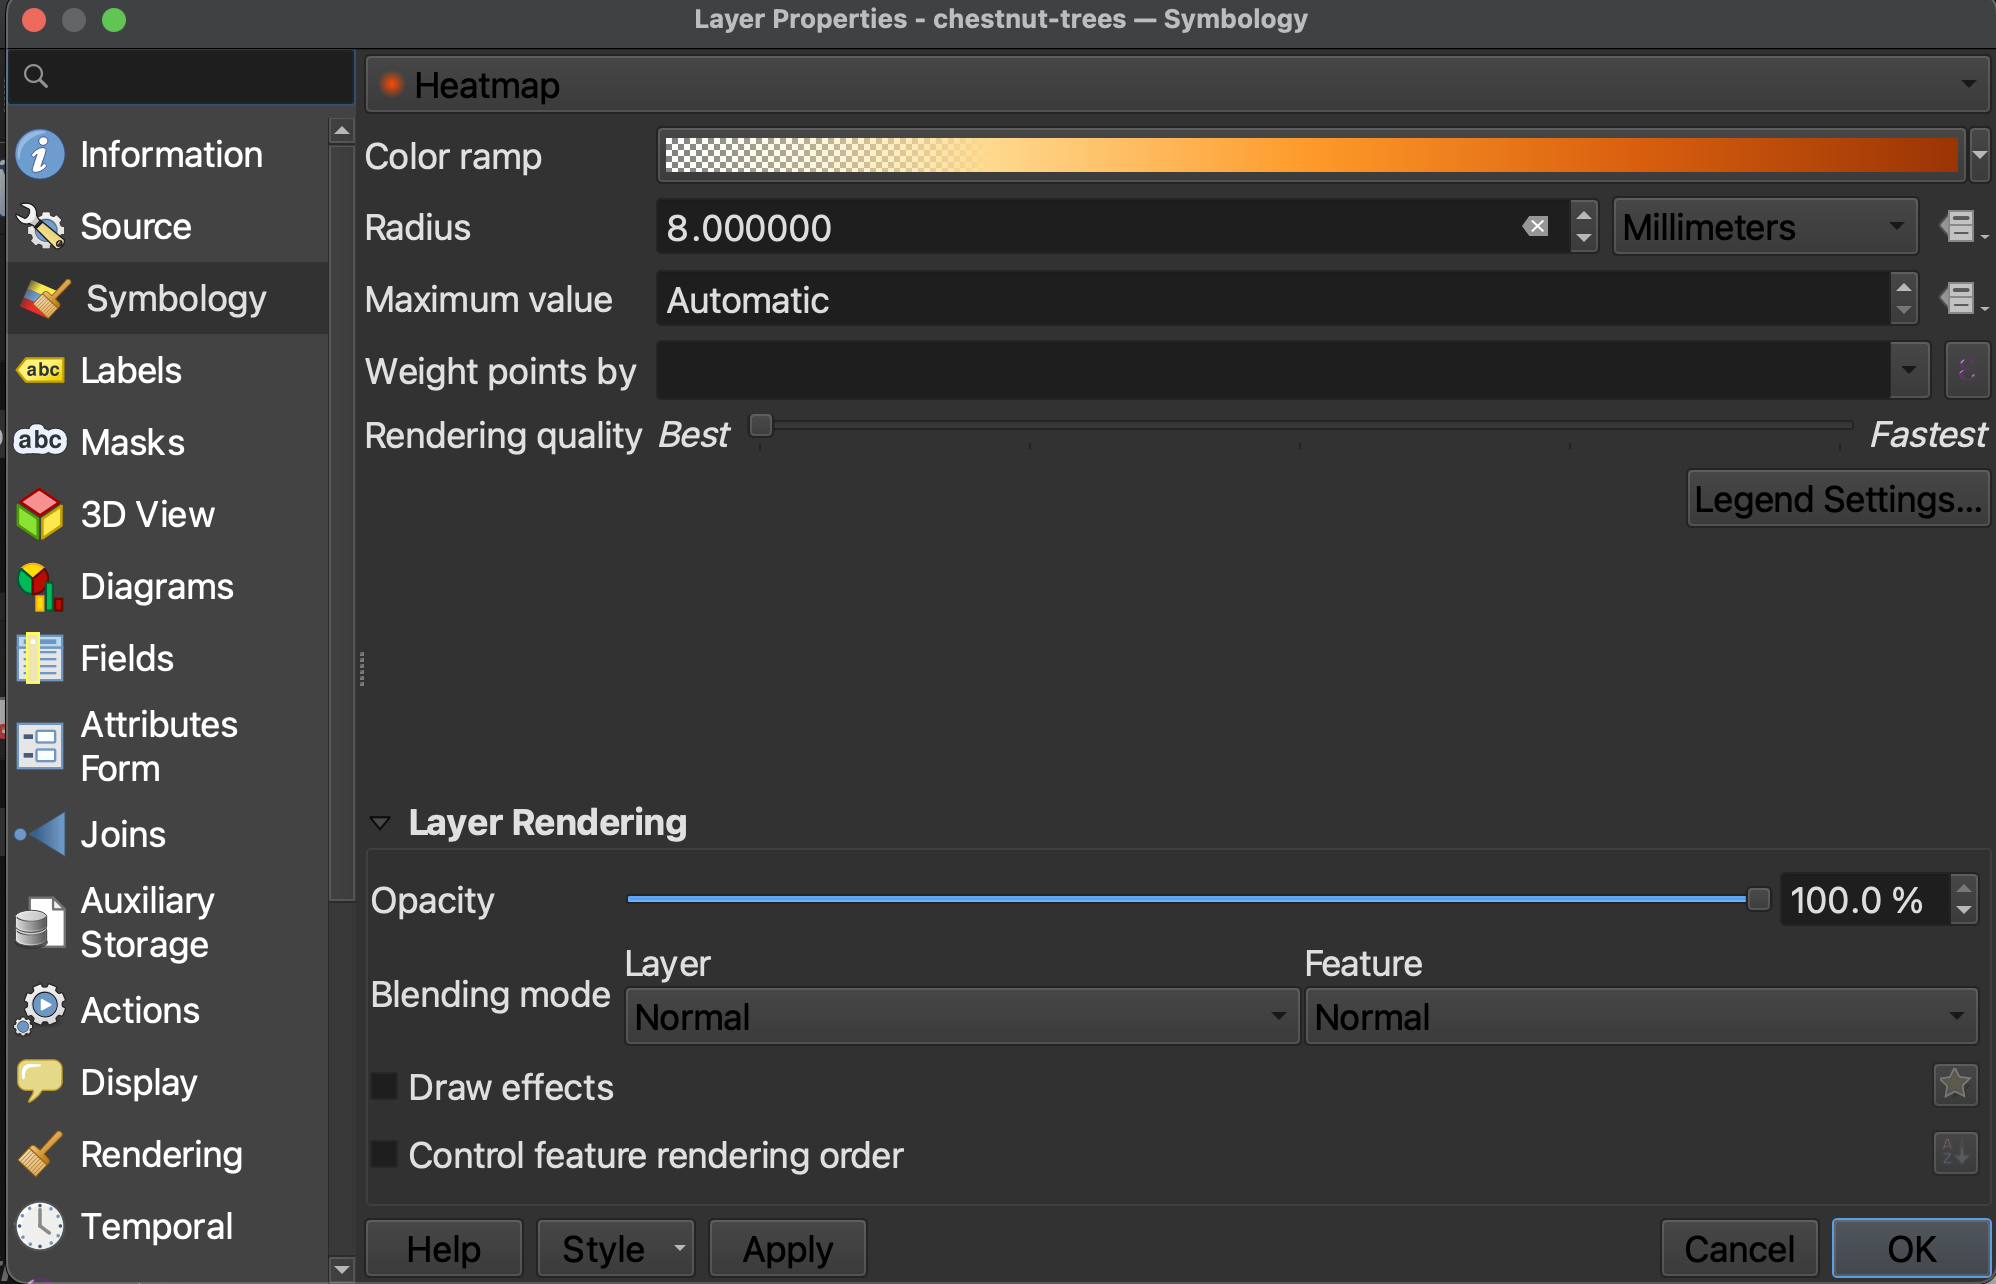
2 Open the Layer Properties and go to Symbology. Change the symbolization to Heatmap.
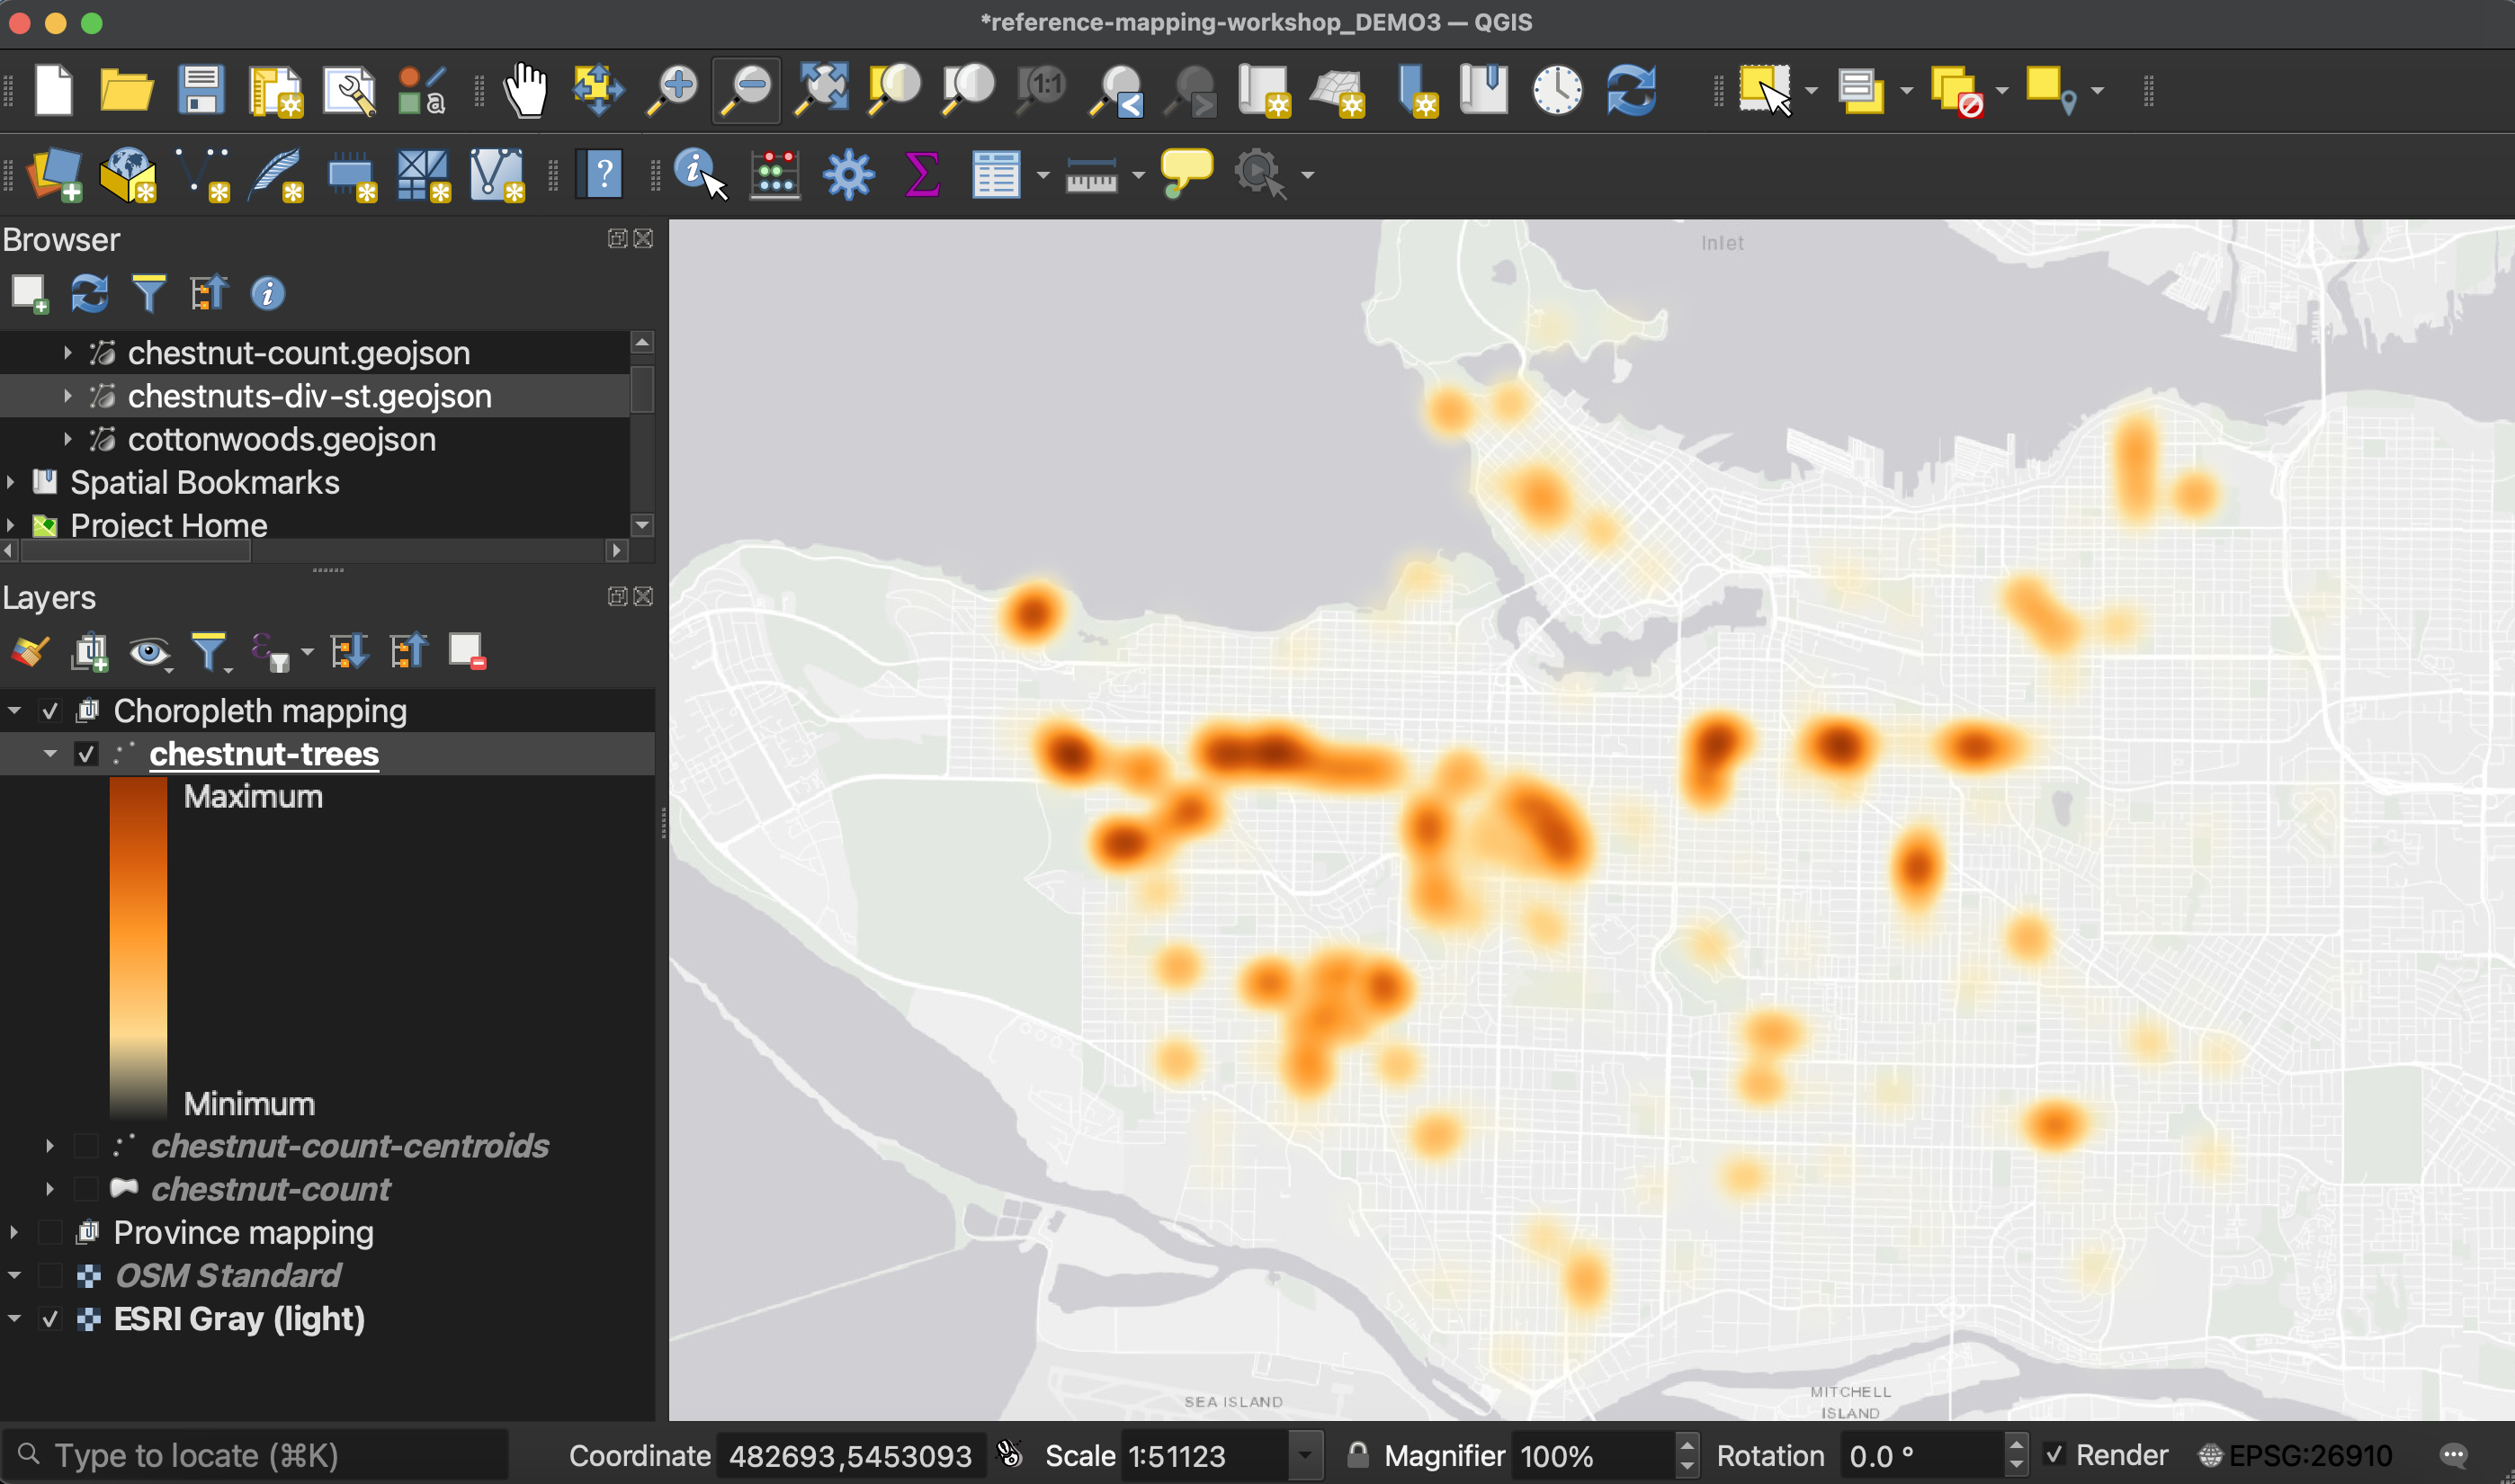
3 Choose an appropriate color ramp. Then, click on the color ramp itself in order to adjust Color 1. Set the Opacity of Color 1 to be 0. In other words, make the lighter/lower end of the color ramp totally transparent. This will ensure that areas that have no value are see-through, and don’t hide the map.

3 Radius has to do with how far around the points the color blurs. 8-12 works well. I also recommend adjusting the Rendering Quality all the way to Best, otherwise, the heatmap becomes quite pixelated.
Loading last updated date...