Thematic Mapping
The following pages will guide you through how to adjust your symbology in QGIS to make a thematic map. The data is already prepared for you in the thematic-mapping subfolder of your workshop data folder. Before you begin,
- Be sure to remove or hide all global layers, and
- Change the project’s CRS to
NAD83 / UTM zone 10N. - Having a web-based basemap for reference can be helpful as well.
- If you haven’t already, please download and unzip the workshop folder. Remember to download it to a location on your physical computer, like Desktop or Downloads. Do not download it to OneDrive. The data for the Additional Content exercises (such as this one) will be in the
thematic-mappingsubfolder.
Choropleth maps
Choropleth maps are useful to show and compare the density, frequency, or quantity of a value generalized across standardized geographic areas (such as zip-codes, provinces, or countries). Unless you specifically want to emphasize differences in total number of events/data points, it is best practice to normalize your data when choropleth mapping. Normalization is when you divide the values for each geographic area by something like the area in square kilometers or total population of that area. For instance, mapping winter flu cases across census tracts in British Columbia, you’d want to normalize the total cases in each census tract by that tract’s total population. Normalization enables better comparison across multiple geographic areas.
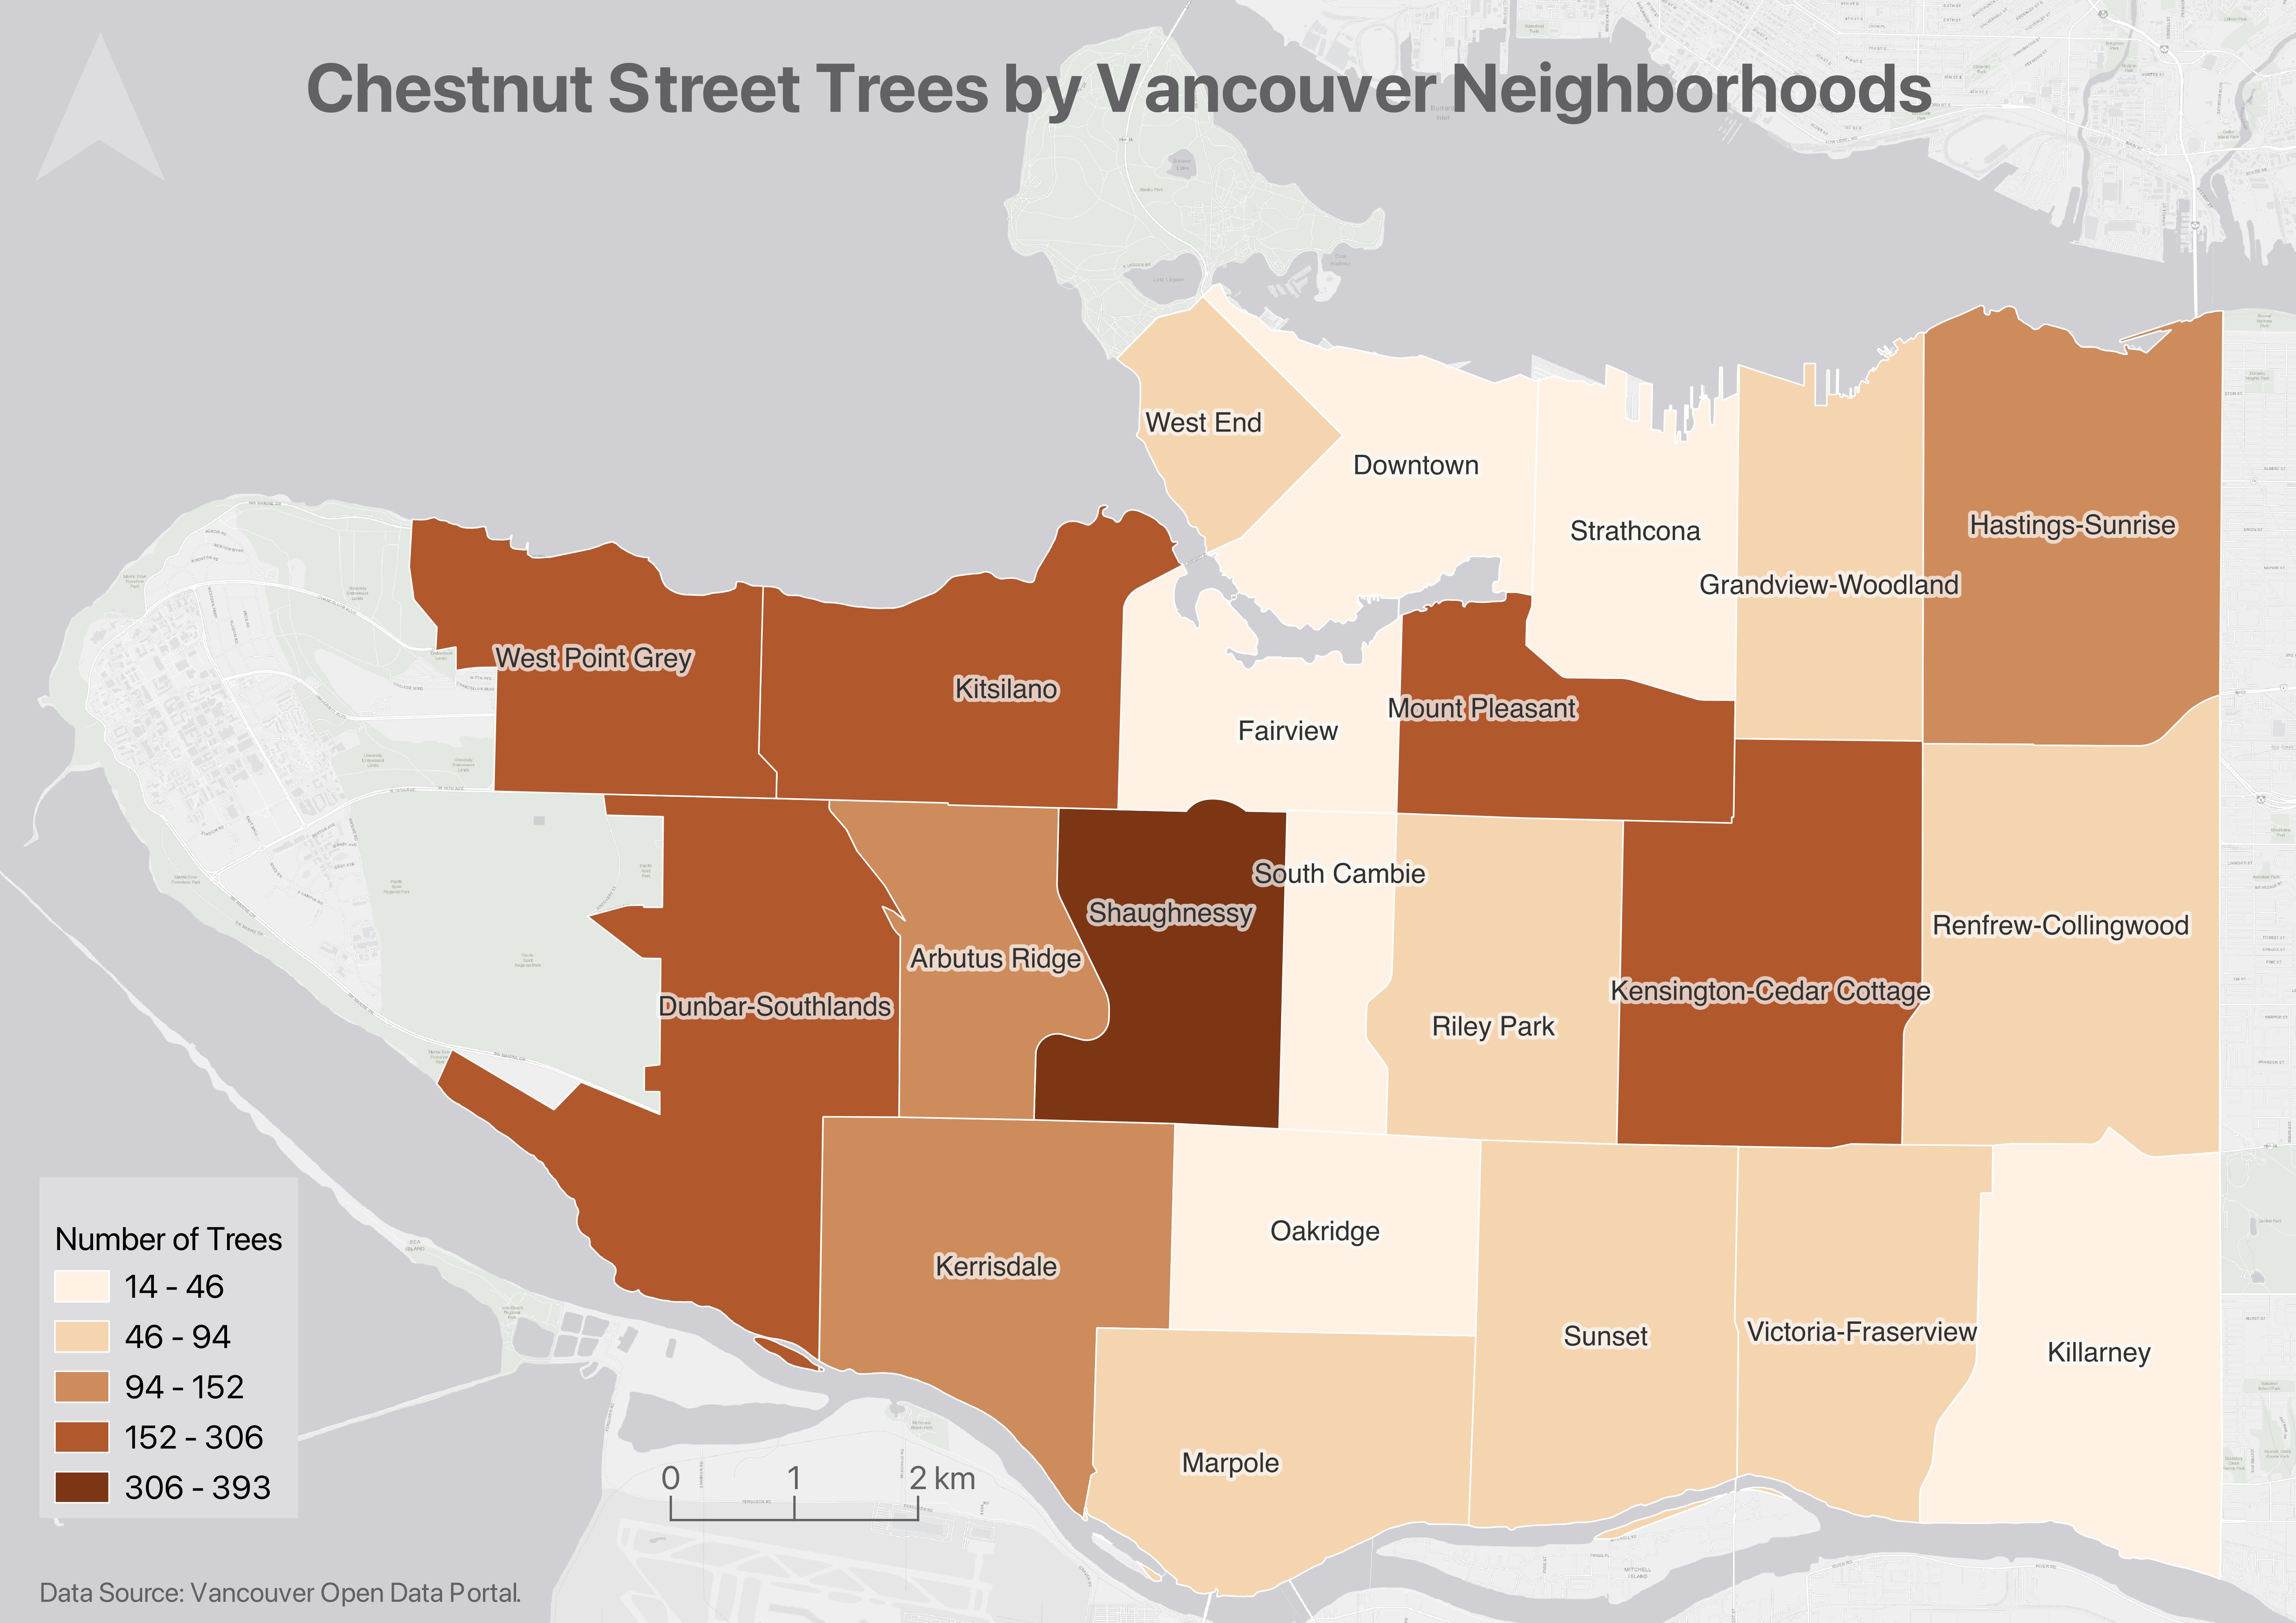
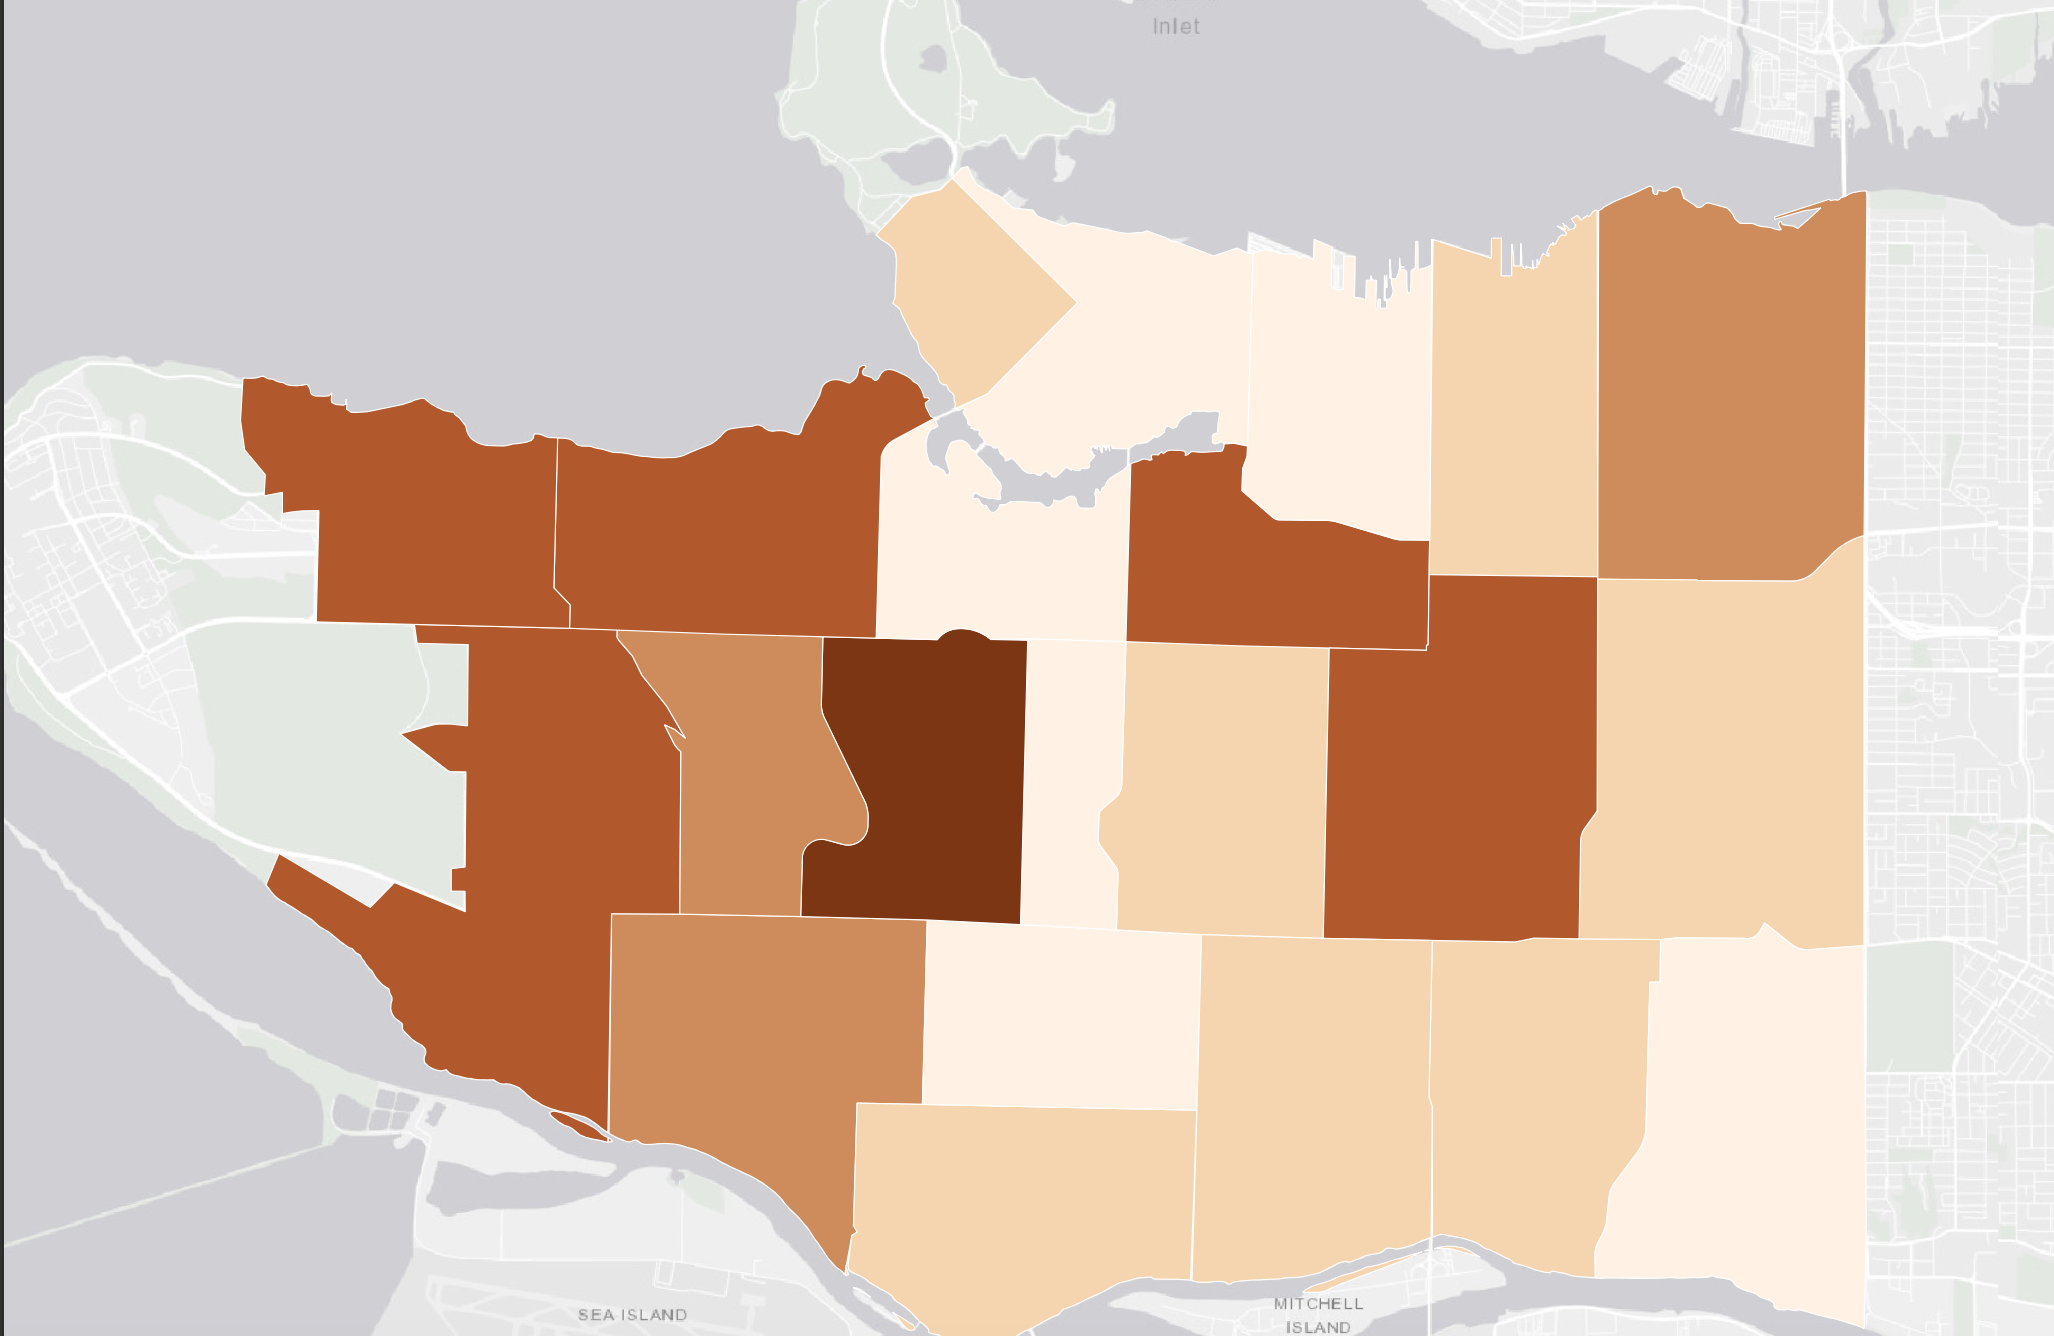
The map below shows total chestnut street trees per Vancouver neighborhood.
Making a choropleth map
1 Add the file chestnut-count.geojson from within the thematic-mapping subfolder of your workshop data folder. Zoom-to the layer. (If your map looks wonky, be sure you’ve set the project CRS to NAD83 / UTM zone 10N from Project menu –> Properties –> CRS.)
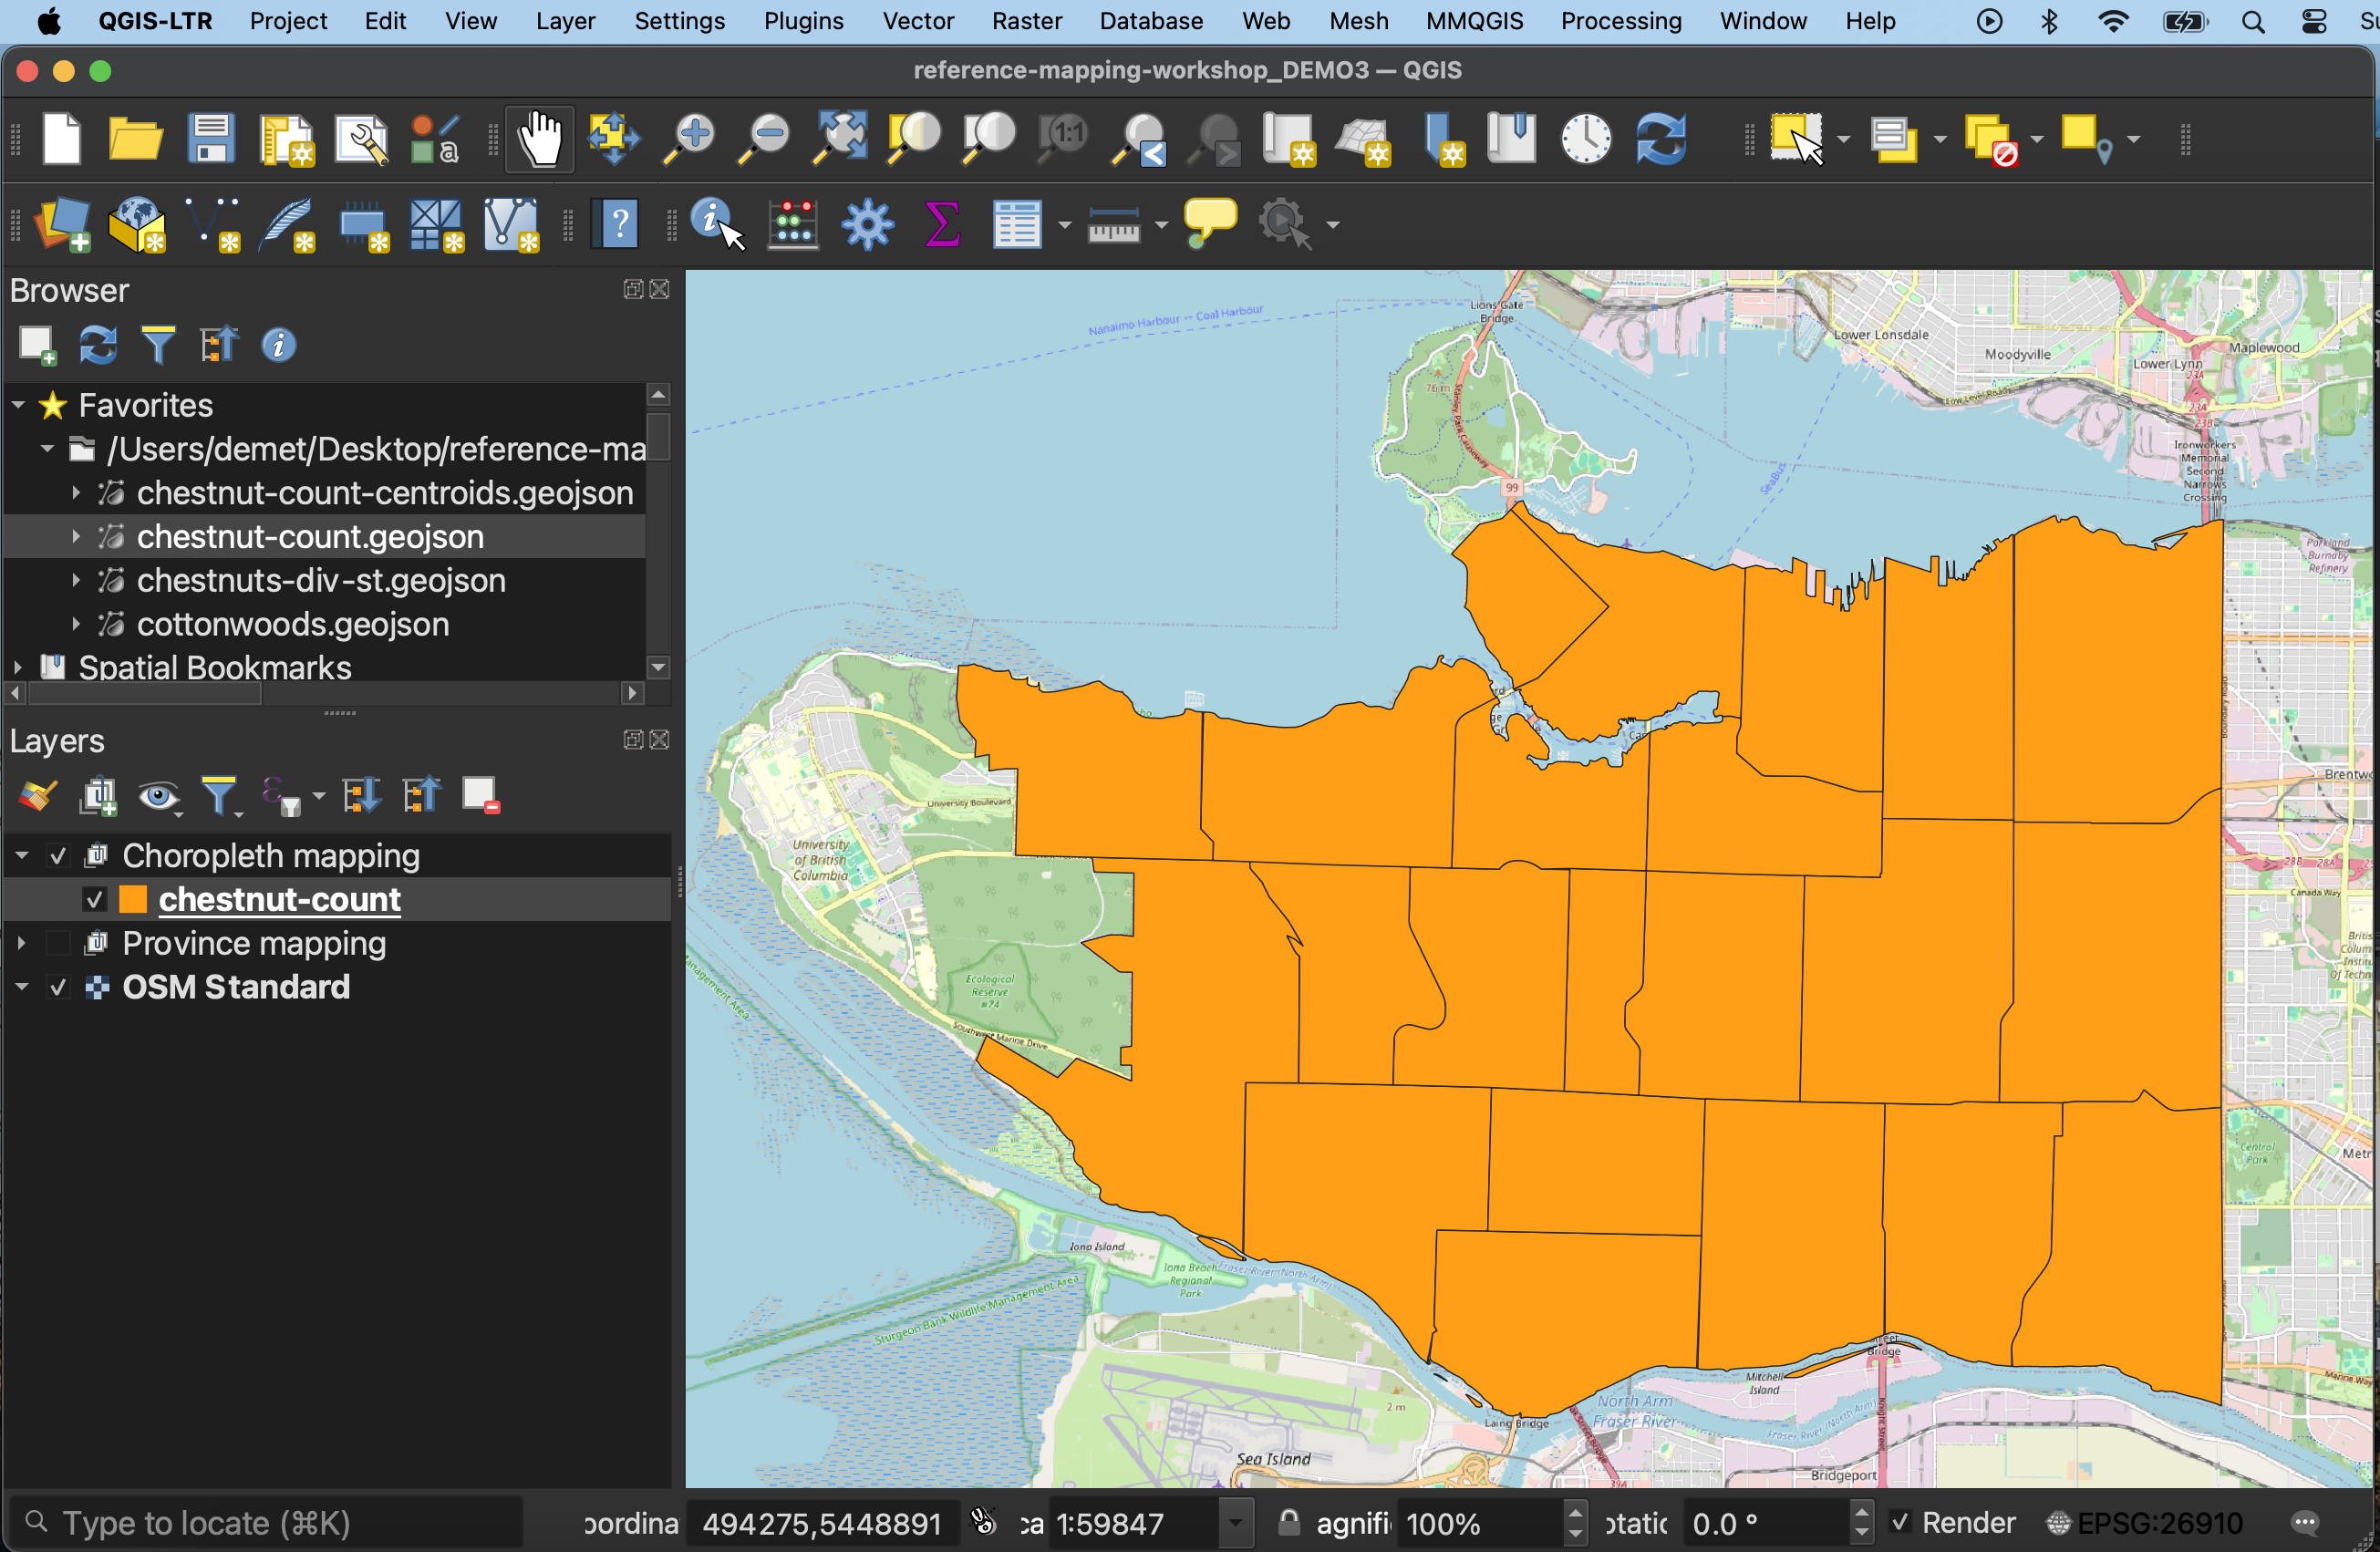
2 The default color may differ in your QGIS project, but once loaded, your layer will something like this. The layer shows Vancouver neighborhoods, but just by looking at it, we can’t tell much more. Open the Attribute Table of the newly added chestnut-count layer.
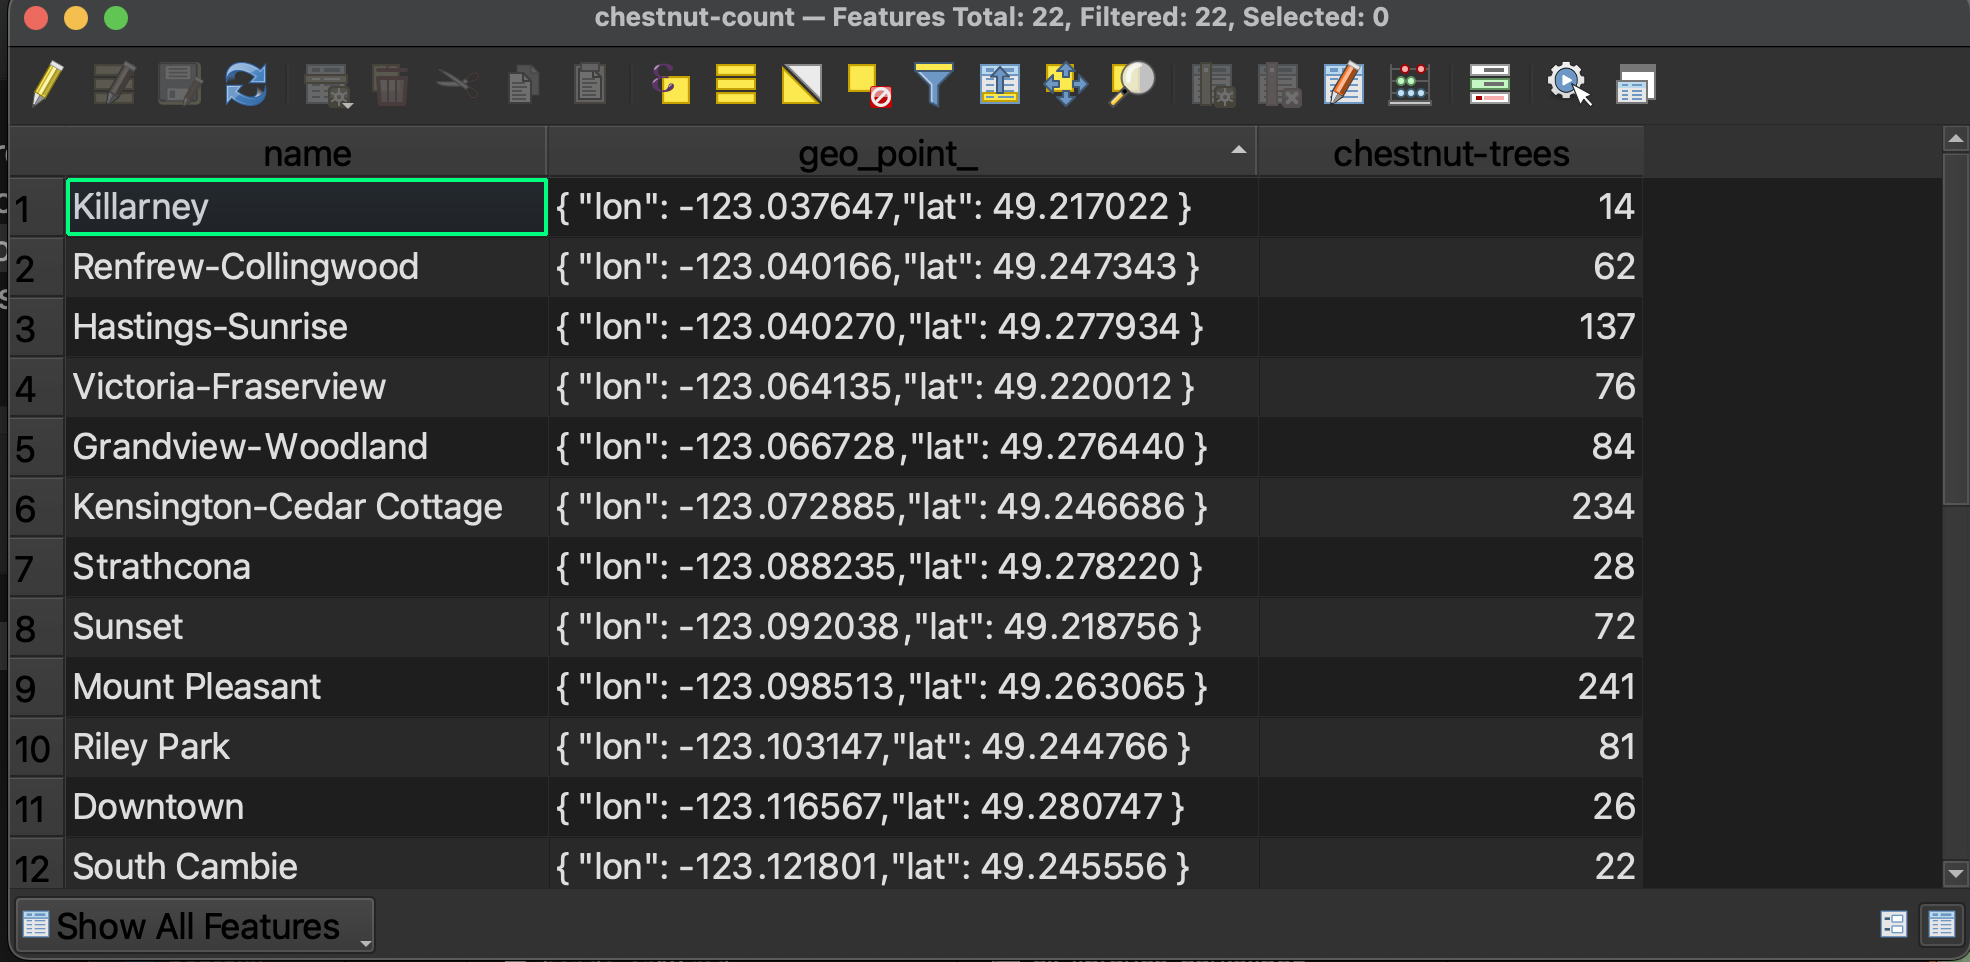
Here we can see there are three Fields, one for the neighborhood name, one for its geometry, and a final column storing the number of total chestnut street trees in each neighborhood. We know this is stored as a number because the contents of this column are right justified.
If you are interested in how these counts were calculated, see our Introduction to QGIS which will take you step-by-step through creating this dataset.
3 Remember, a choropleth map visualizes different values across standard geographic areas through gradations in color. So, what we need to do is change the Symbology of the chestnut-count layer to render visible values in the chestnut-trees column.
-
Open the layer Symbology of
chestnut-count(Right-click the layer in the Layers Panel –> Properties –> Symbology). -
At the top of the Layer Properties - Symbology window, we can see the layer
chestnut-countis currently being symbolized by a Single Symbol. Click Single Symbol to change this. From the drop-down options that appear, select Graduated.
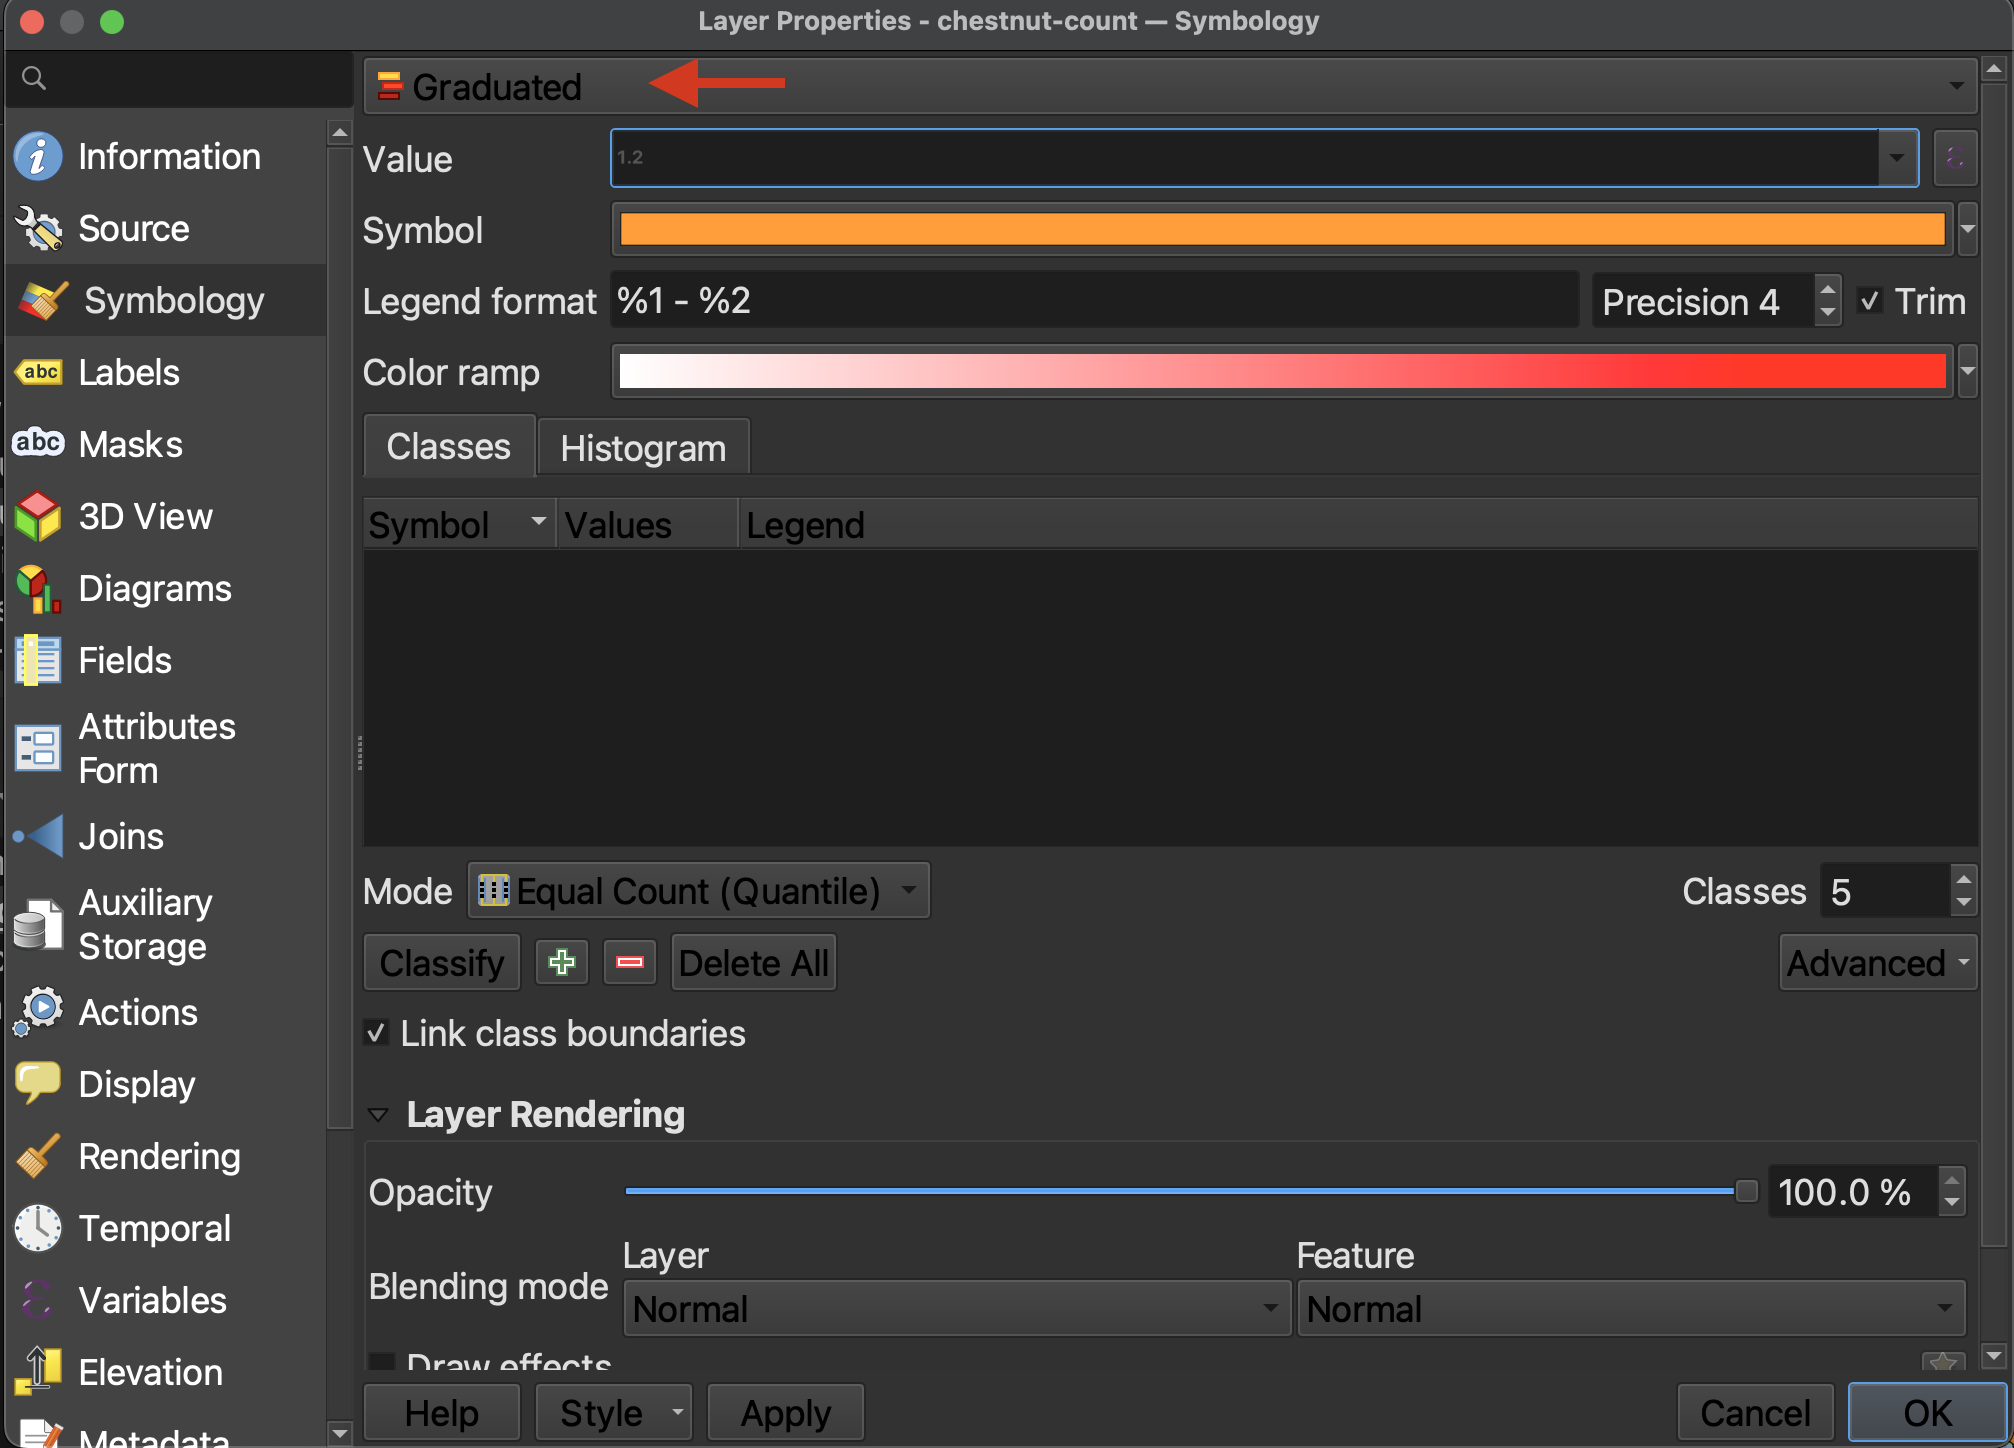
4 Now we have to indicate what value the layer should be used to build the symbology gradient. Because chestnut-trees is the only numerical field in the Attribute Table, when you click the drop-down options for Value, chestnut-trees is the only value you can choose. Choose it.
5 Precision refers to how many decimals you want to include, and checking the Trim box removes trailing zeros from the legend. Because we are dealing with whole numbers of trees, so long as Trim is checked it doesn’t matter the precision.
6 You can select a color ramp from the given options, or design your own. Hover over “All Color Ramps” to see all options. For now, change the color ramp to oranges from All Color Ramps.
7 So far, we’ve set up the symbology but we have to apply it to our values. Click Classify to classify the chestnut-trees values. (If nothing shows up, make sure you’ve set the Value to the numerical field chestnut-count.)
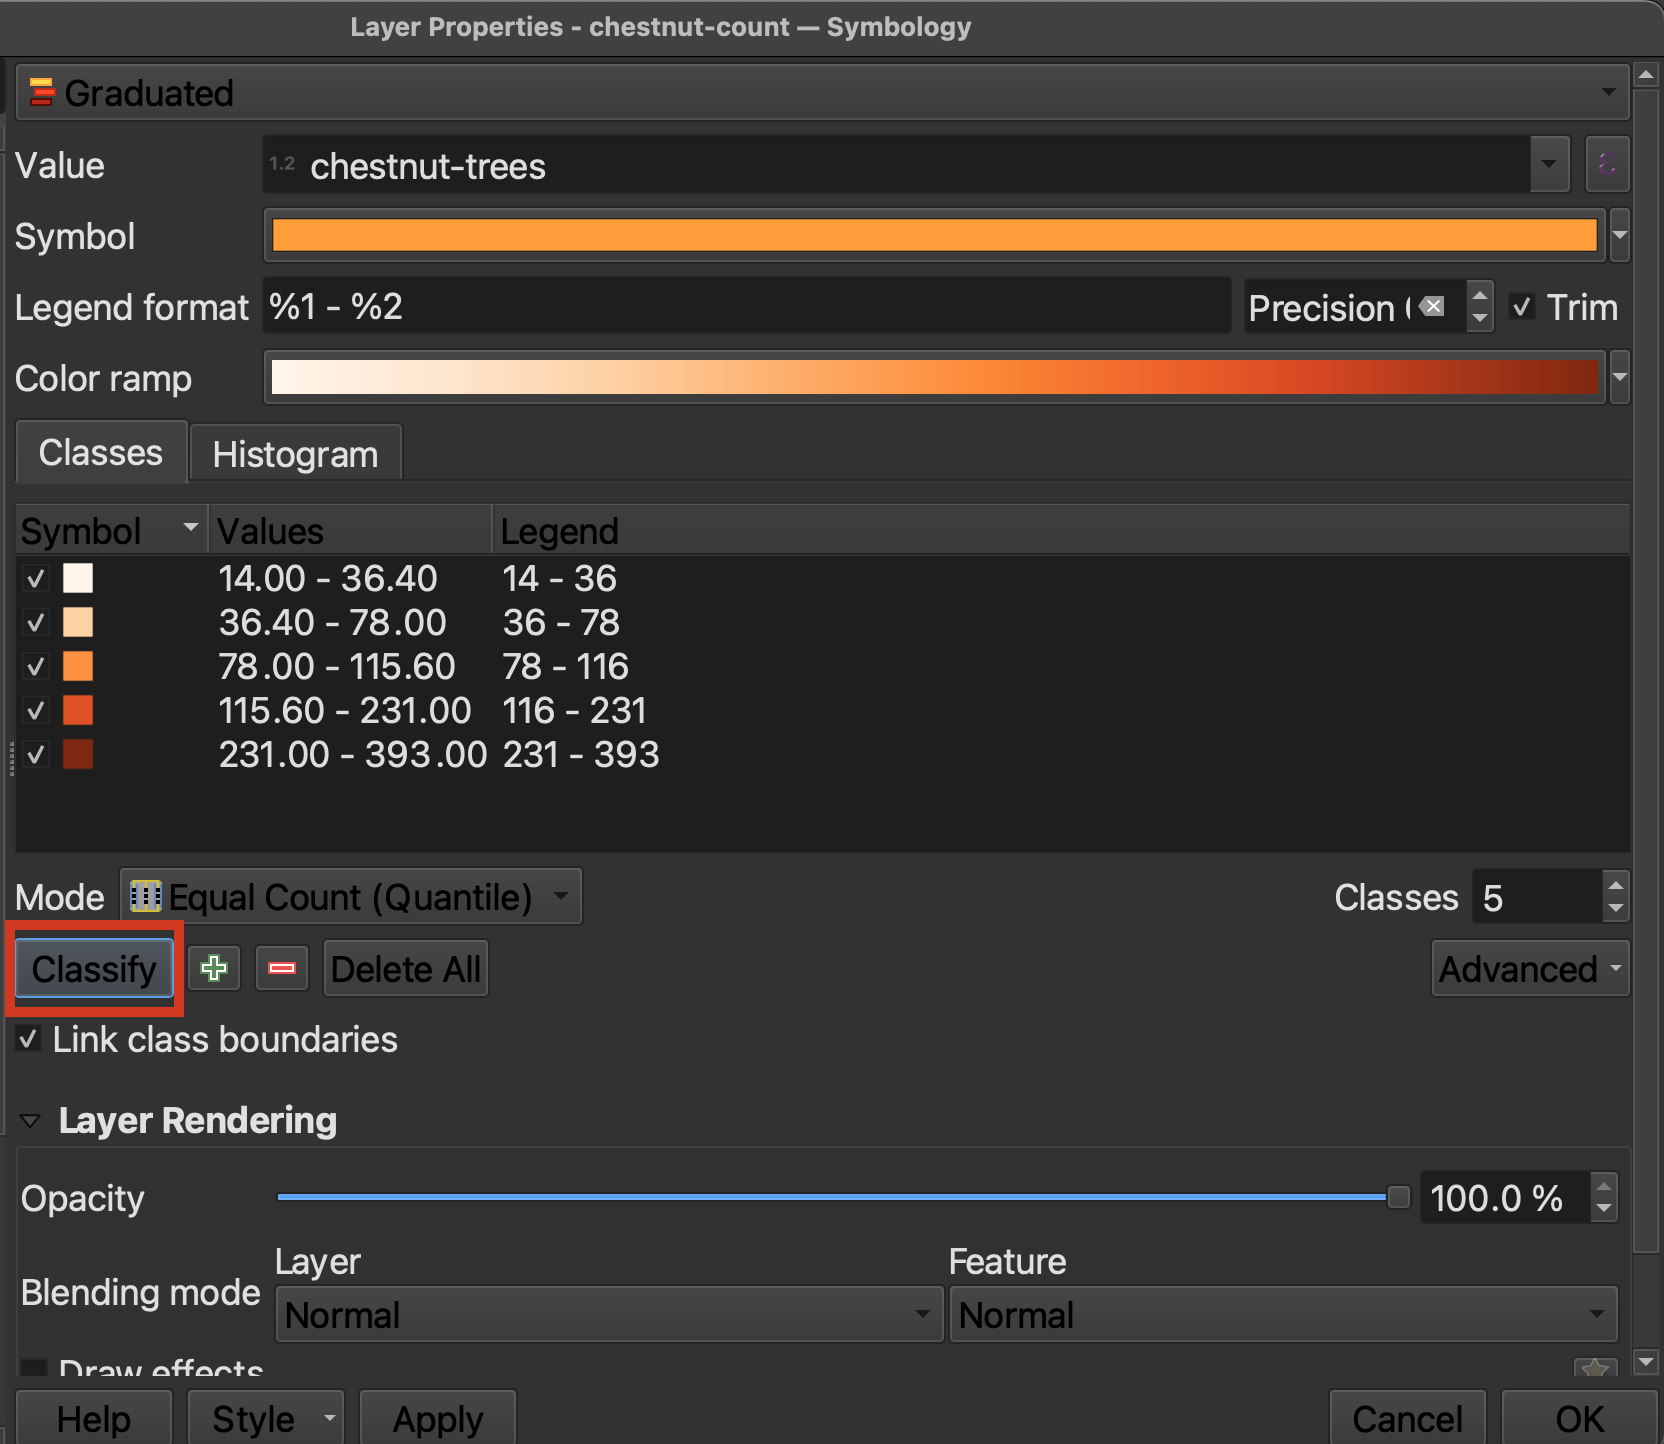
Hit Apply to see you map change.
While the default classification mode is set to Equal Count (Quantile), you can choose amongst different classification modes. Classification modes determine how the distribution of data are grouped or “classified”, and therefore which values are associated with which colors. You can also increase or decrease the number of classes. Between 5 and 7 is best practice. Read more about different classification modes here.
If you toggle to the Histogram tab, you can Load Values to see the distribution of chestnut-trees values. The X-axis indicates number of chestnut trees whereas the Y-axis, “Count”, refers to the number of neighborhoods with this number of chestnut trees. The number of bins refers to how granularly the number line is broken down. Currently there are 30 bins—from 0 to 400—meaning any neighborhood with a count that isn’t a multiple of 5 will be split.
Play around with different classification modes. You can also create your own intervals manually by simply double clicking the values and editing the number bounds. Or, you can adjust a given classification mode by dragging the class lines in the histogram.
Styling your choropleth map
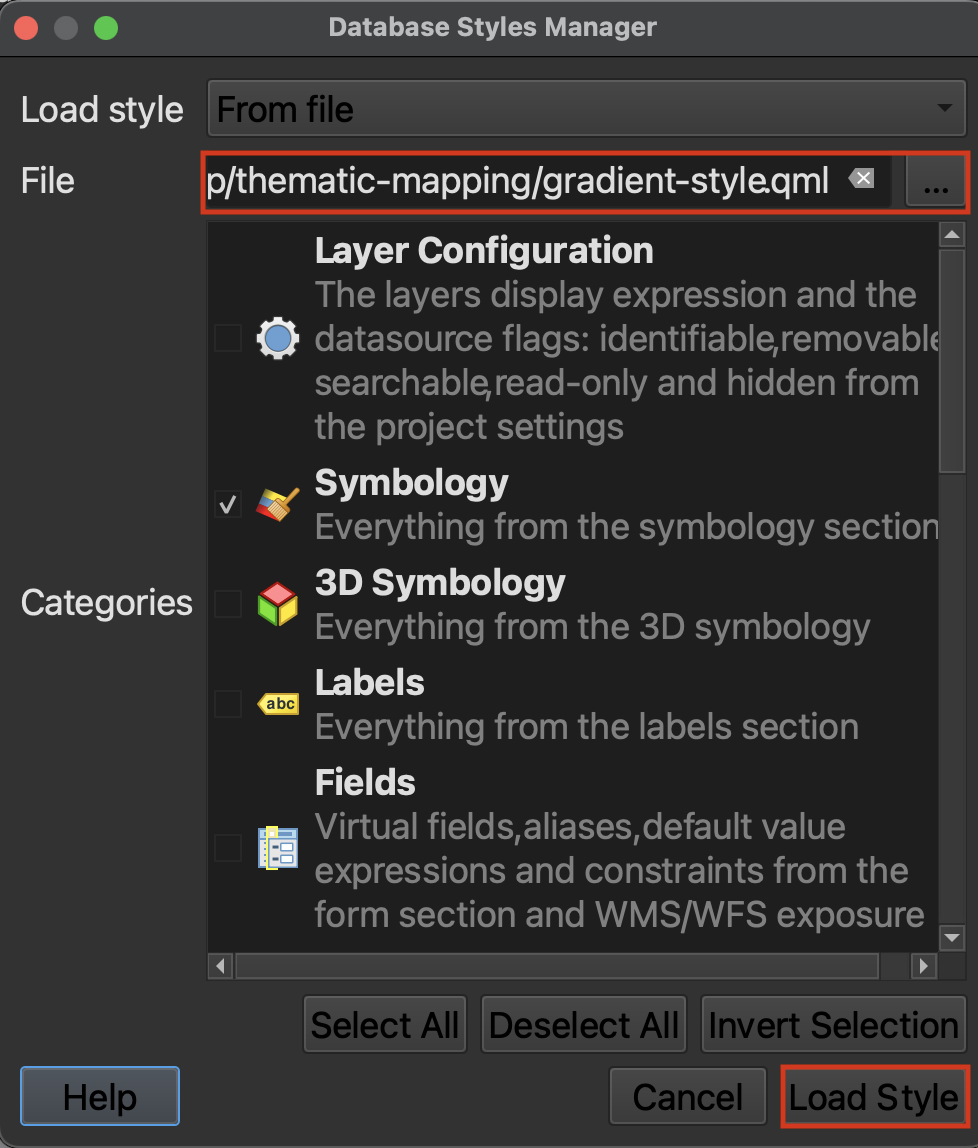
You can save and load symbology styles. Try loading the symbology style, stored in the thematic-mapping subfolder, called gradient-style.qmd.

Adding a Legend
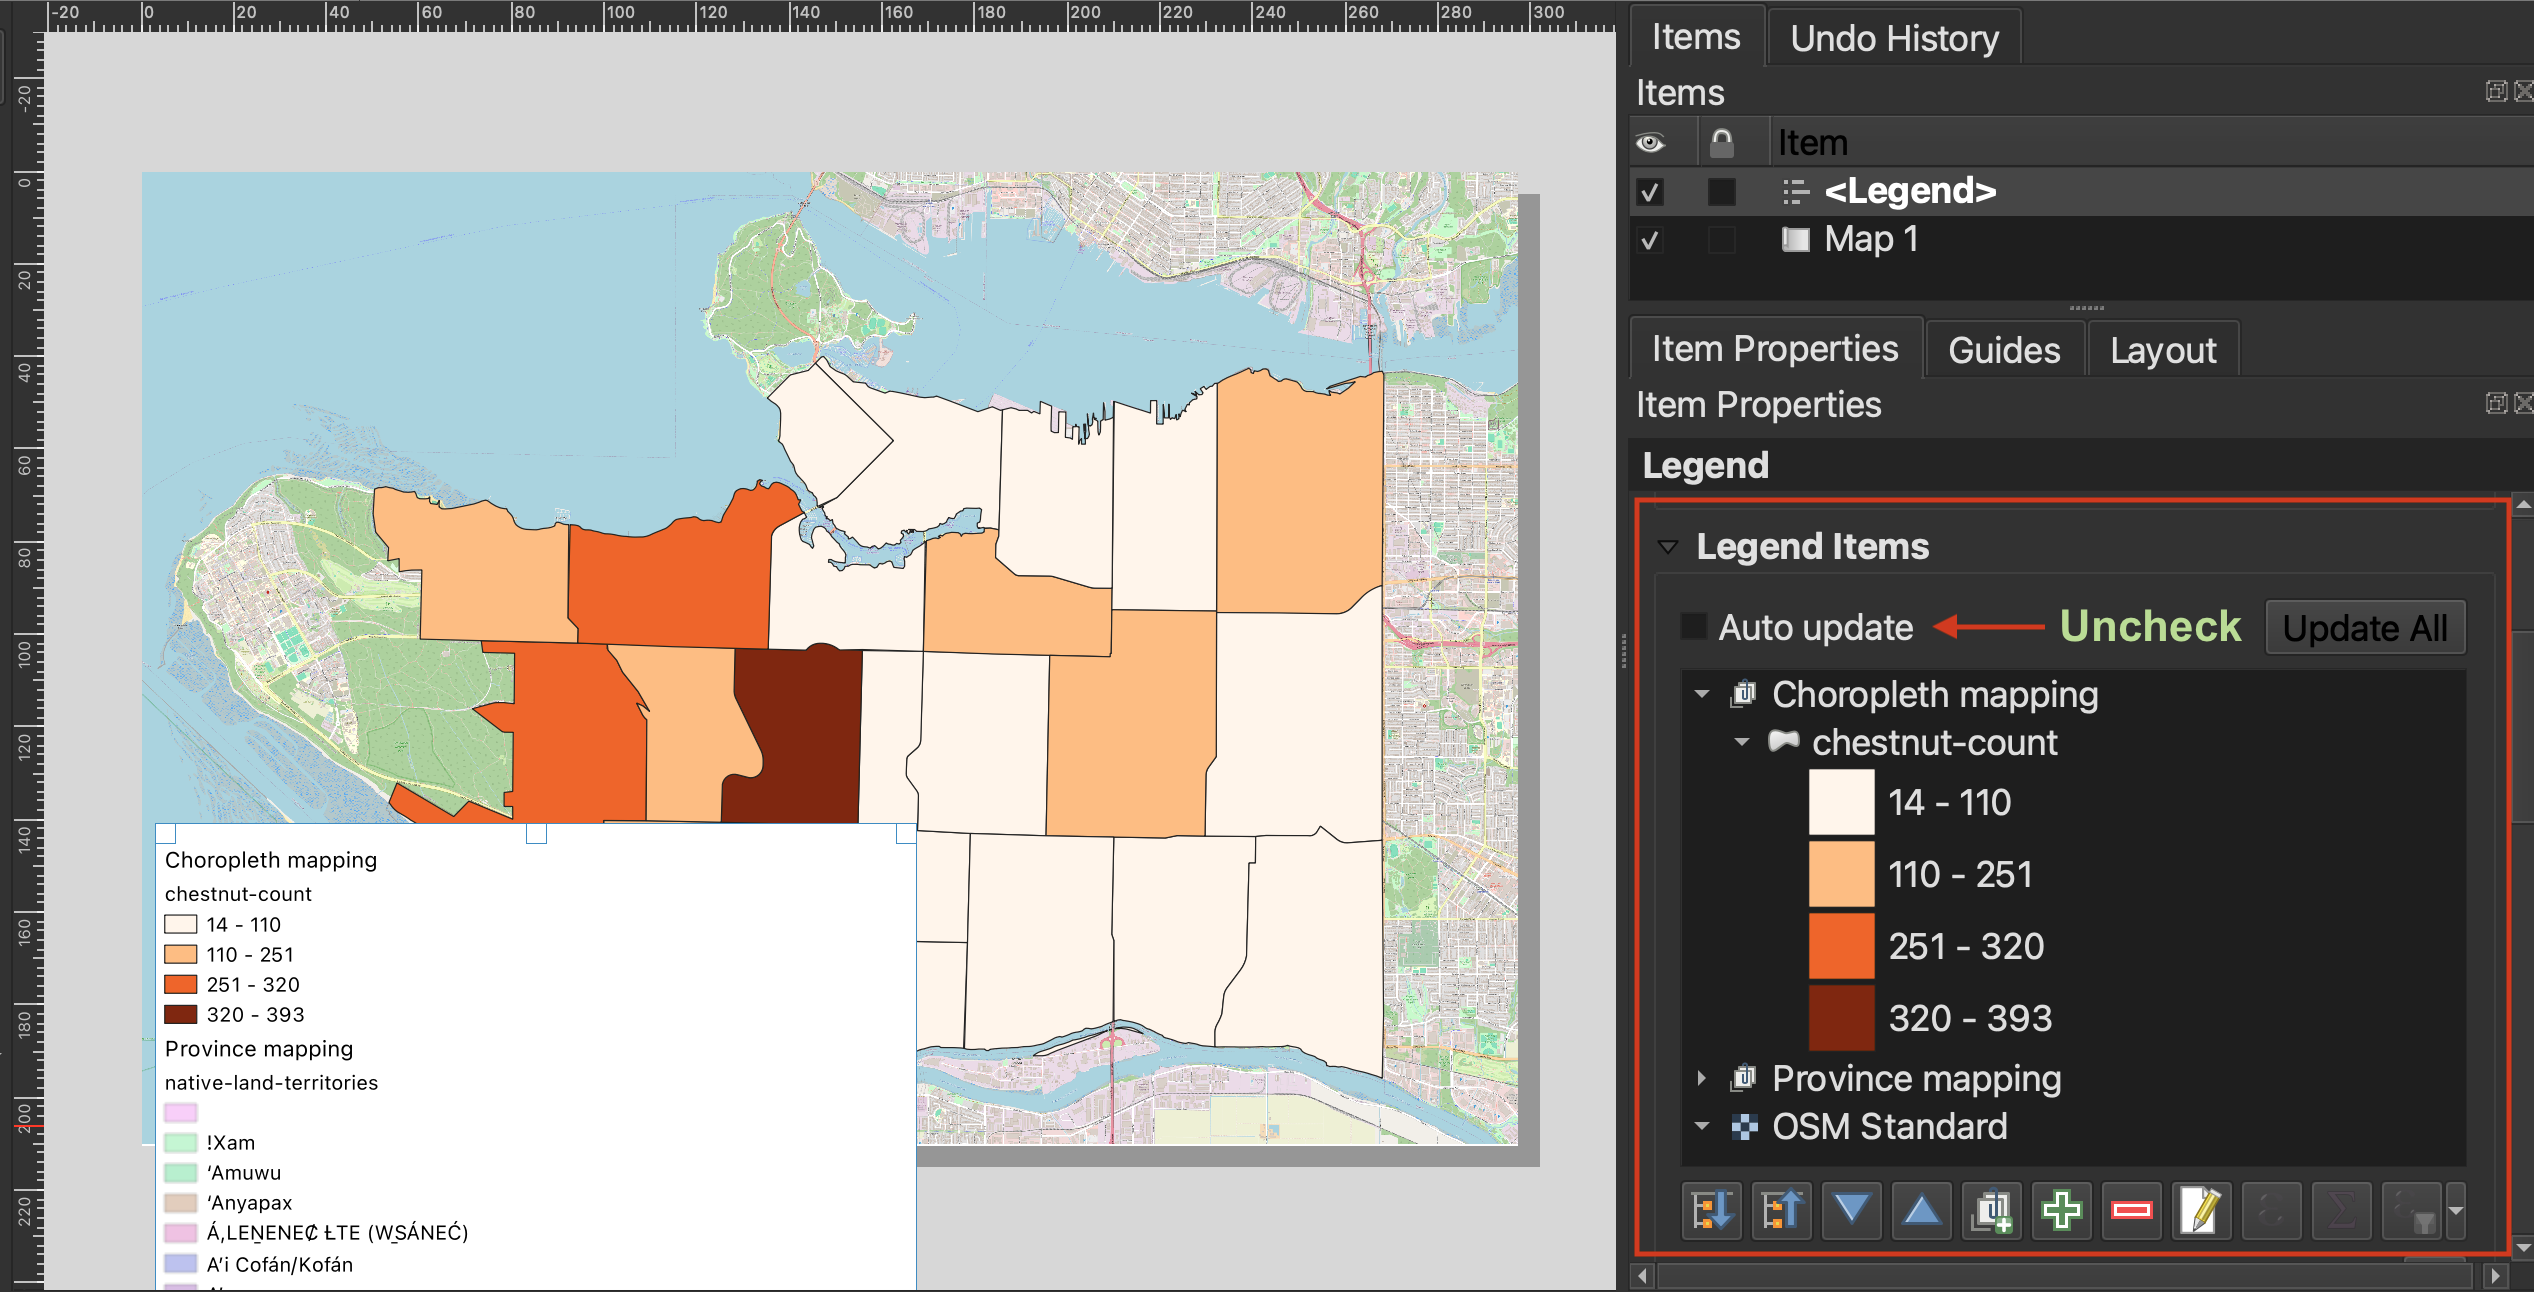
In a Print Layout, add a legend from the *Add Items** menu at the top of your screen. Only features symbolized by your map should be included in your legend. To remove extraneous layers and rename existing layers, first uncheck the ‘Auto update’ box. Now select a layer you want to remove from your legend and click the red –– button at the bottom. To rename a layer, simply double click it. Click the < back arrow to return to Legend Item Properties
You can add a Background or Frame to your Legend by scrolling down in the Item properties. Note that a legend does not need a title “Legend”.
Note: If you have many layers you don’t want to include in your legend because they aren’t part of your map, but aren’t ready to remove from your project, you can create a group in the Layers Panel and add them there. That way, when it’s time to edit the legend, you can remove the entire group.
Loading last updated date...