Spatial Data
A Geographic Information System (GIS) works with data that is tied to a location on Earth. This type of data is often referred to as “spatial data”, “geospatial data”, or even “GIS data”, and is spatially referenced using location information — most commonly geographic coordinates. A GIS uses this location information to project a geospatial file into a virtual geographic space where it can then be visualized and manipulated. If your data’s locative information is in the form of text - for example, country/city names or street addresses - this can be made legible to a GIS with a few extra steps (see geocoding). You may have to create new columns and populate them with coordinate information.
Raster vs. Vector
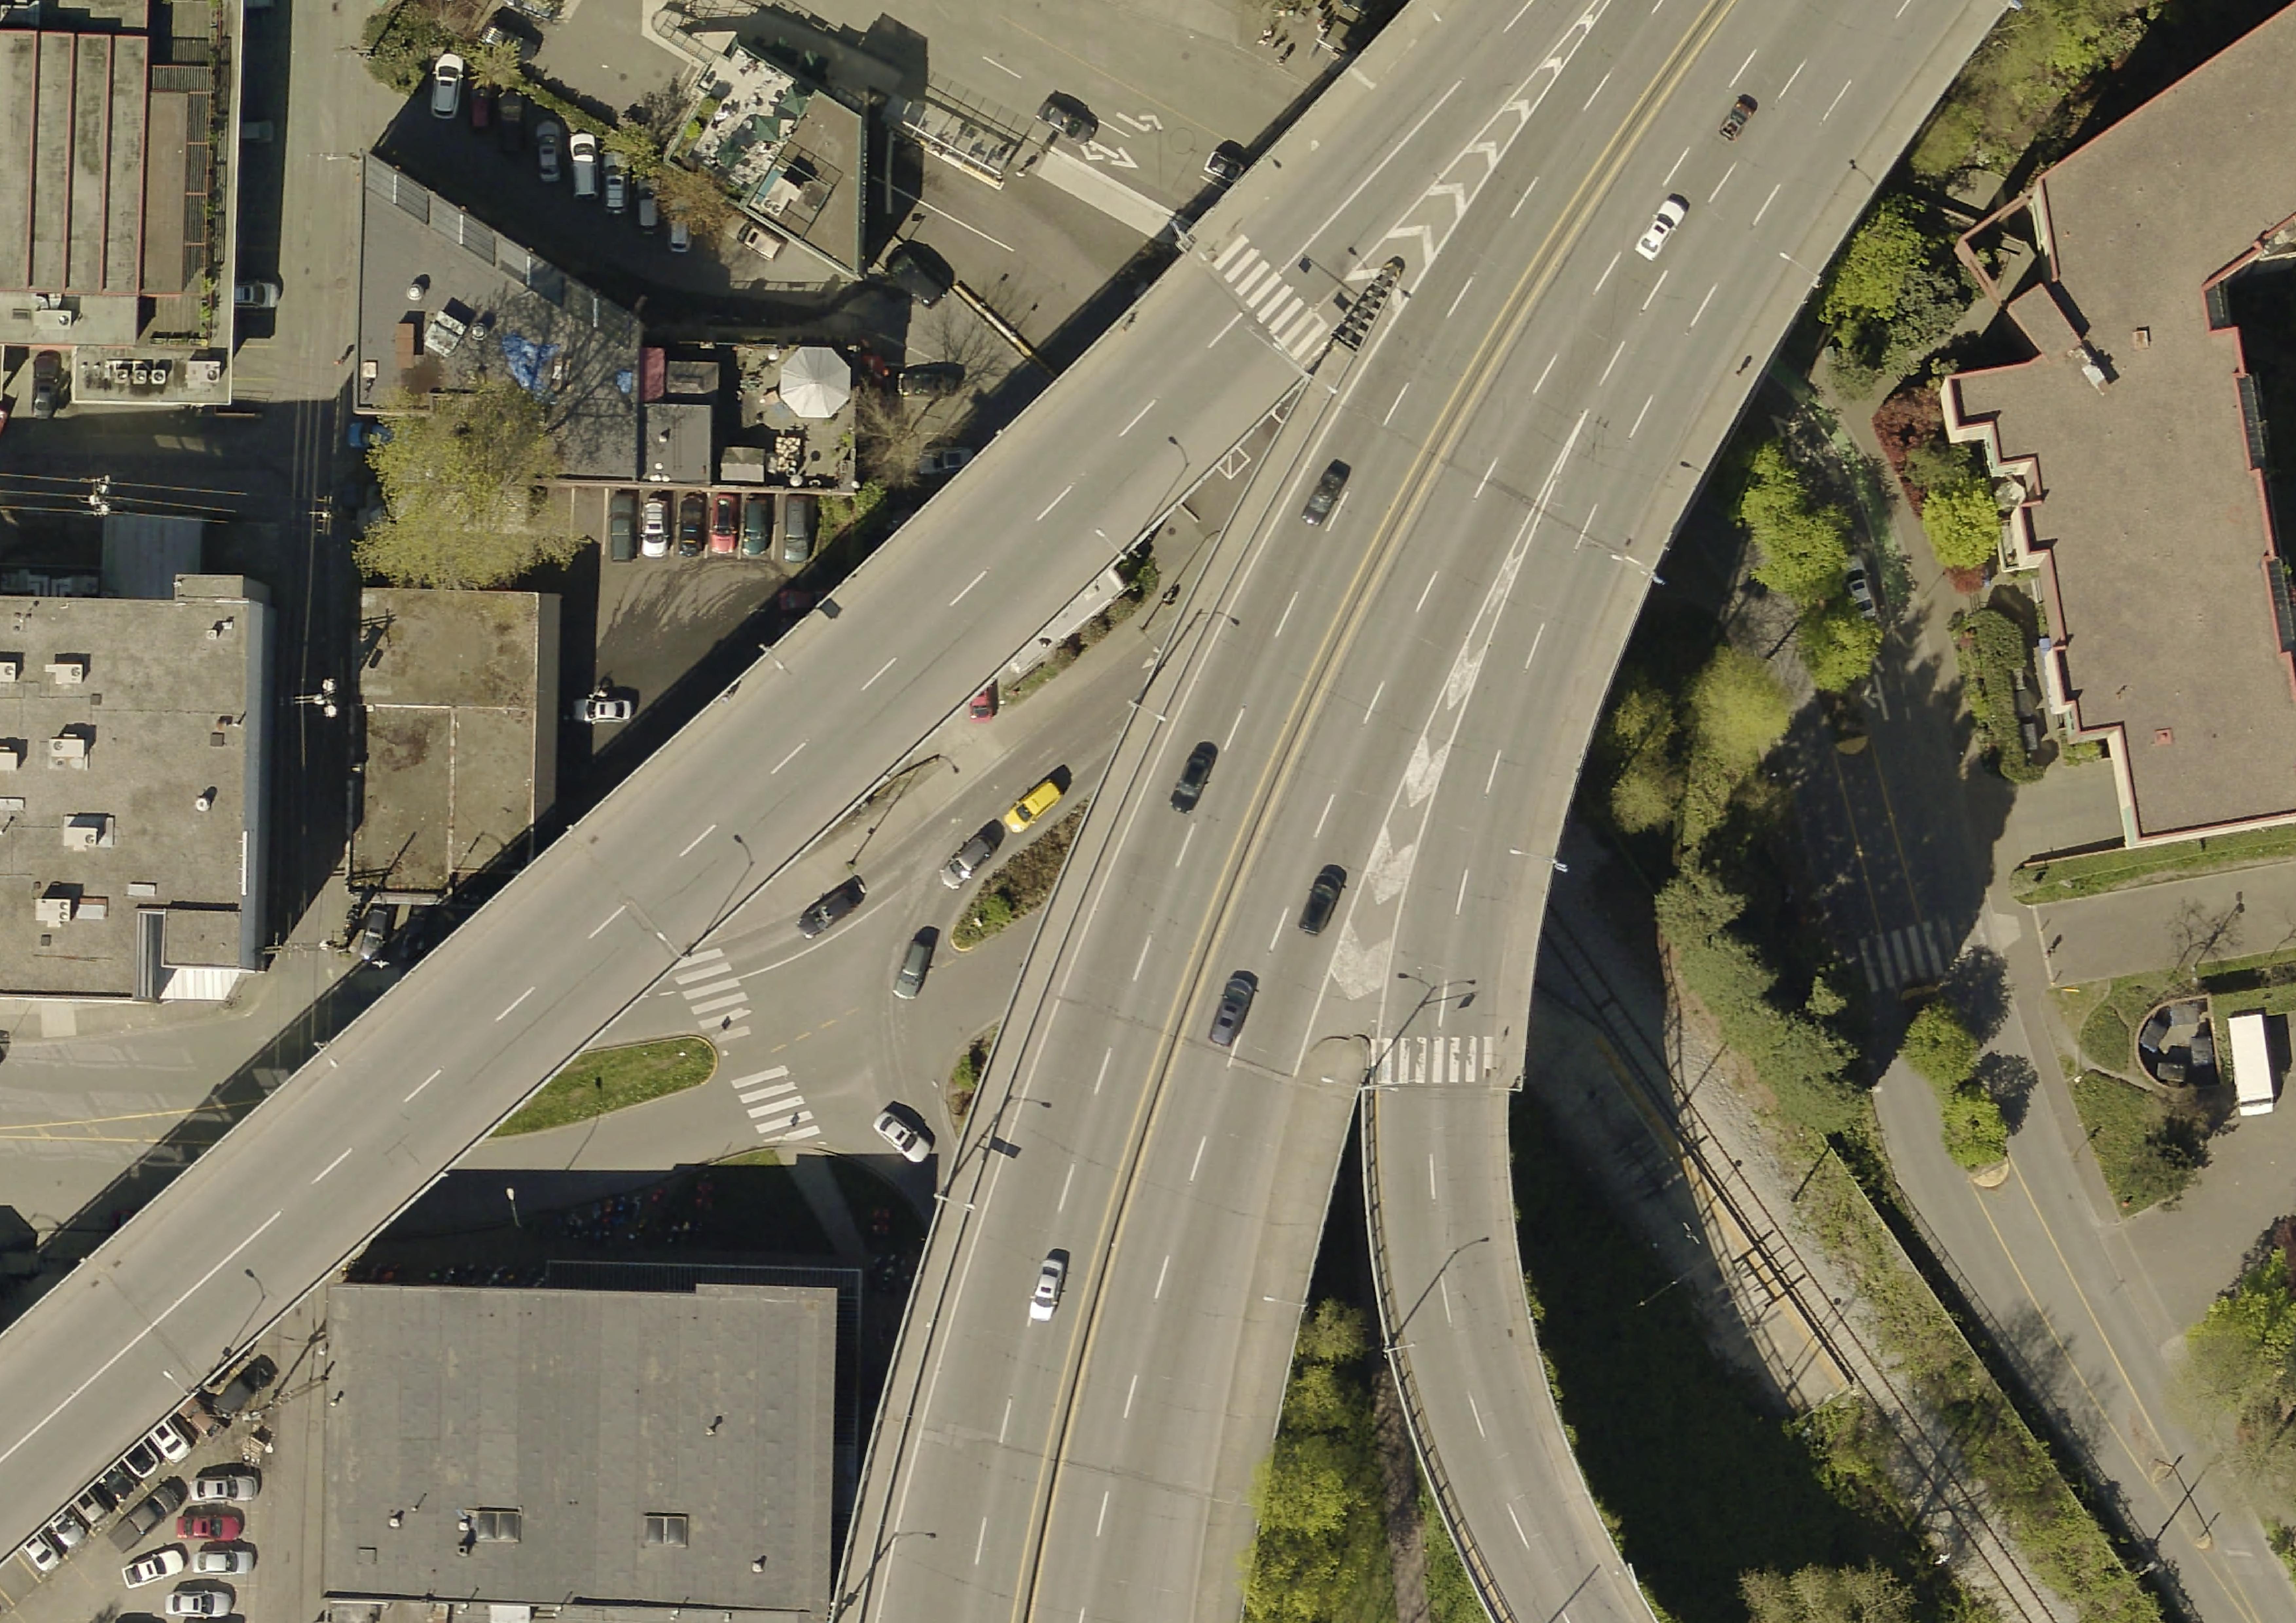
There are 2 main types of geospatial data: vector and raster. Raster data is data which is made up of pixels arranged in a grid, whereas vector data is made up of vertices and the paths between them that create geometries representing real-world features. If you’re working with continuous geospatial phenomena such as satellite imagery, topography, or climatic data (like rainfall or temperature), you’re likely using raster data. If you’re working with points, lines, or polygons, that’s likely vector data.
Below is a map consisting of three layers of vector data: cities (points), major roads (lines), and land/water (polygons). 
Note: Each vector dataset can only be lines, points, or polygons. However, a dataset can include multiple features, such as polygons representing all the provinces of Canada. For each feature (in this example, each province), various information may be stored such as a unique identifier, the area in square kilometers, the name, the population, etc. These attributes can be explored from within a GIS by opening what’s called the Attribute Table.
Rasters, on the other hand, can generally only store one value per pixel. This value could be a color representing different kinds of topography (think of the whites, greens,and browns representing different elevations in the image below) or the quantity of something like rainfall or temperature. Multiple rasters can be overlaid to generate a multi-part raster, but generally, each pixel of a single raster can store one value meaning your raster is showing one variable. You can also do math between raster layers, or run boolean operations to isolate all pixels that do or do not meet a certain criteria. An example of this is Suitability Analysis.


Tabular Data
Finally, there’s tabular data. Tabular data is simply data formatted into a table by rows and columns. All vector data has associated tabular data that can be opened and viewed inside a GIS. Your tabular data may have a spatial component, like coordinates, or it may not. If a spatial component is present, you can simply load it into a GIS and tell the GIS to create a spatial layer by referencing the stored latitude and longitude (you will need to ensure lat and long are in separate columns, and the GIS is reading latitude as y and longitude as x). If your tabular data does not have locative information, you can still load it into GIS and join it with a spatial layer that already exists based on a key value. However, your tabular data must be in .csv format, so be sure to export any excel sheets as .csvs (comma separated values) before attempting to load them into a GIS.
File Extensions
Spatial data have different file extensions that you may be used to. Raster data will often be TIF (aka TIFF) file and have the extention .tif or .tiff. Vector data come in more diverse file formats. The Shapefile is an industry standard format with the extension .shp (and a host of “sidecar files” — be sure to keep them all together). Shapefiles store data in binary, and it is therefore not legible to human eyes and can only be opened and visualized in a GIS. GeoJSON, on the other hand, stores vector data in .geojson files that can be opened in a code editor or online in geojson.io. From there, they can easily be parsed with human eyes. See here for an exhaustive list of formats spatial data can take. Although the nuance of file formats might seem too detail oriented for an introduction to reference mapping, being aware of different spatial data types and formats will help you know what to download and troubleshoot why something may not be opening/working. If you have no prior experience with spatial data, this may be quite overwhelming right now. However, with a little bit of practical experience under your belt this will quickly all become common sense to you.
More resources
Loading last updated date...