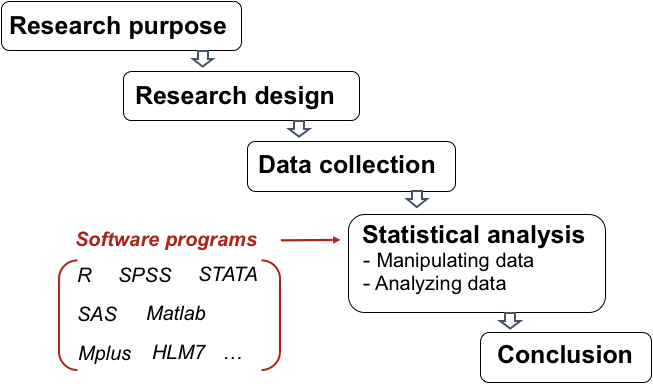
Overview of quantitative research
Consider the different stages of research, usually software programs assist on data analysis
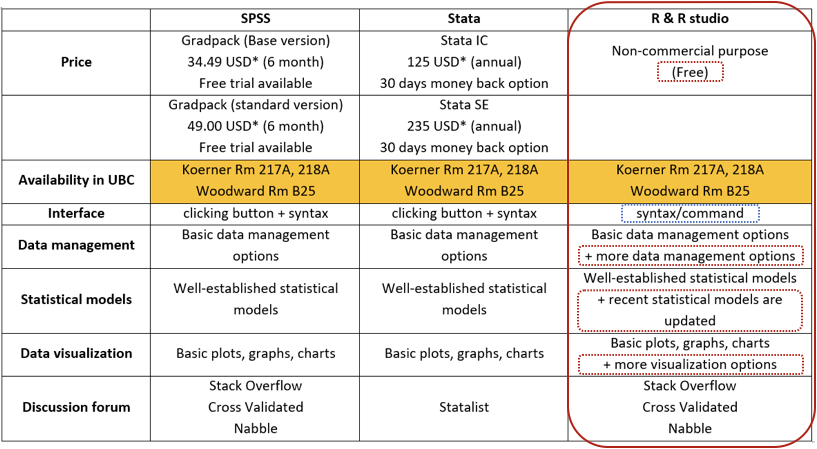
There are many tool for data analysis, here are some appealing factors to choose R
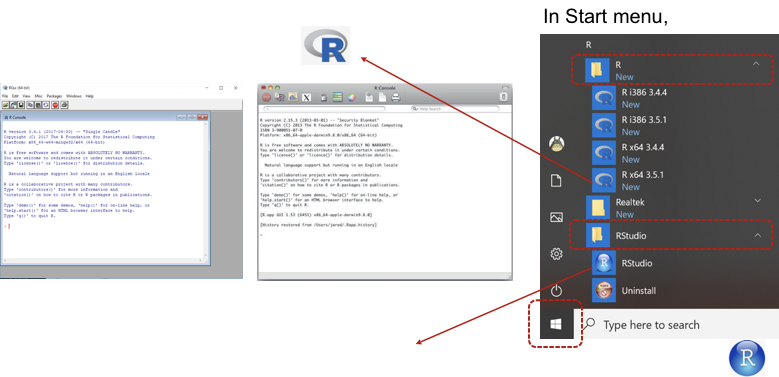
R environment
R works basically as a terminal where you type commands and see their output.
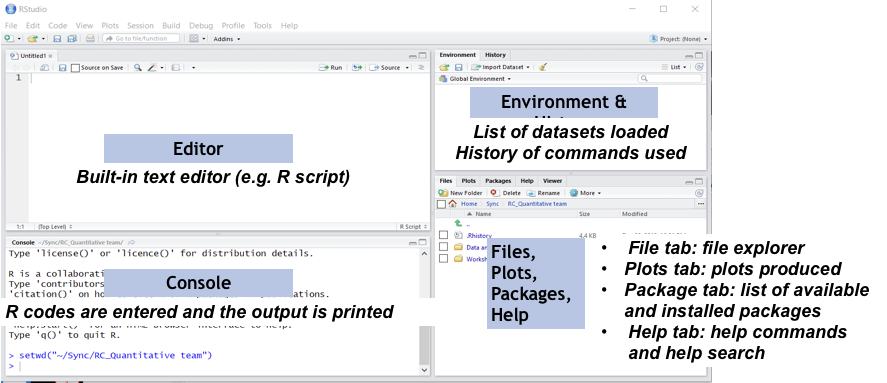
Since the R terminal is very limited, we will use RStudio
Open RStudio
Create a new R script
File > New file > R Script
Basic Commands
R packages
R package is a library of prewritten code designed for a particular task or a collection of tasks

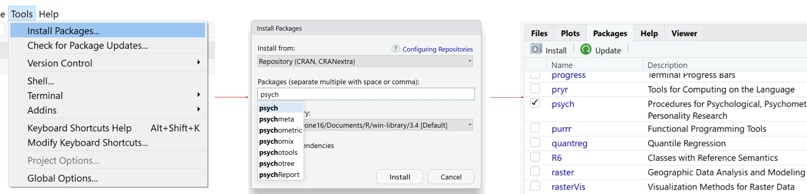
Installing a new package (2 options)
1 Under Tools -> Packages tab -> Search for “psych” and “dplyr”
2 Using code: install.packages( )
Input
install.packages(c("ggplot2", "dplyr", "readr", "psych"))
Loading installed packages
Use the library command to load any installed packages
Input
library("ggplot2")
library("dplyr")
library("readr")
library("psych")
Changing your working directory
Set up a folder/path where data are located as a working directory

Trick: If you have saved the R script in the same directory as the workshop dataset, the command below will set the working directory automatically
Input
setwd(dirname(rstudioapi::getActiveDocumentContext()$path))