Data Manipulation
Please make sure you have downloaded the workshop dataset. See Setup for instructions.
Our data
We will use data about global warming. Our overall research hypothesis (merely for didactics) are:
-
H01 the earth average temperature has not dramatically increased since the advent of electronics
-
H02 the emission of carbon dioxide does not influence the earth average temperature

Importing data from text
We will assign the data from GlobalLandTemperaturesByCountry.csv to a variable called mydata
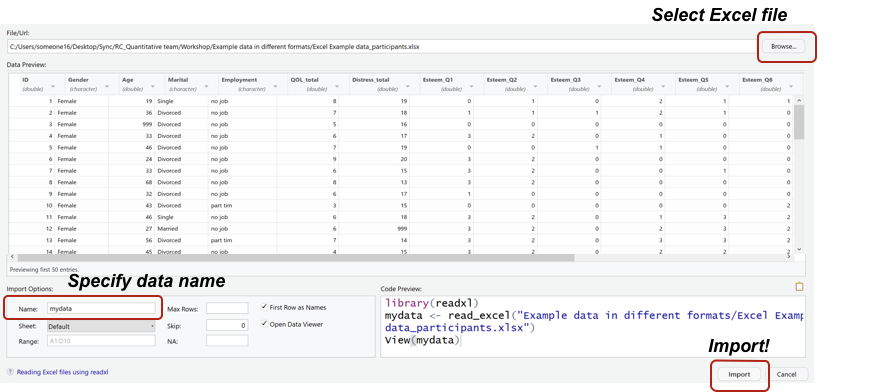
Import dataset > From text (base)

Preview data and give it a nice name

You can also load your data with the read_csv command
Input
mydata <- read.csv("GlobalLandTemperaturesByCountry.csv")
You can inspect the first few lines of mydata with head
Input
head(mydata, 5)
Basic data commands
names( ): check variable names
Input
names(mydata)
head( ): View first n lines of the table
Input
head(mydata, n = 10)
table( ): check variable values and frequency
Input
table(mydata$Country)
Basic data management commands
is.factor( ): check if the variable is defined as categorical
Input
is.factor(mydata$Country)
as.factor( ): changes variable to categorical format
Input
mydata$Country <- as.factor(mydata$Country)
Input
is.factor(mydata$Country)
numeric( ): check if the variable is defined as numerical
Input
is.numeric(mydata$AverageTemperature)
Data management with “dplyr” package
Removing empty cells/rows
You might have noticed NA in some rows of the dataset, what are they?
Input
head(mydata, n = 10)
We can remove NAs with na.omit
Input
mydata <- na.omit(mydata)
Input
head(mydata, n = 10)
select ( ): selects columns based on columns names
Useful when your data has many columns and you only need a subset of them
Input
select(mydata, dt, Country)
filter ( ): selects cases based on conditions
Input
filter(mydata, Country=="Canada")
filter may accept more than one condition
Pipe | filter any row that matches either condition
Input
filter(mydata, Country=="Canada" | Country == "China")
Ampersand & filter any row that matches both conditions
Input
filter(mydata, Country=="Canada" & AverageTemperature > 12)
Adding new columns with mutate( )
We might need new columns representing operations on previously existing data. This is required if, for instance, we want to create a numeric variable named year or to create a categorical variable named era, which represents if the measurement was from the electronic or gas & oil era.
Adding column representing the year
Input
mydata <- mutate(mydata, year = as.numeric(format(as.Date(dt), "%Y")))
There are multiple commands packed in the mutate operation. Take a look at each transformation, step by step:
Input
format(as.Date(mydata$dt), "%Y")
as.numeric(format(as.Date(mydata$dt), "%Y"))
mutate(mydata, year = as.numeric(format(as.Date(dt), "%Y")))
mydata <- mutate(mydata, year = as.numeric(format(as.Date(dt), "%Y")))
Input
head(mydata)

is.numeric(mydata$year)
Adding column representing the industrial era
We use a if_else comparison. If year is less or equal to 1969, we assign the value gas & oil. Otherwise, we assign the value electronic.
Input
mydata <- mutate(mydata, era=if_else(
    year <= 1969, "gas & oil", "electronic",
))

head(mydata, n=5)