Inference Statistics (cont.)
Did we do the correct analysis?
Both T-test and Pearson assume Normality. What if the data is not normally distributed?
Let us test for normality using the Shapiro-Wilk test:
shapiro.test( ): tests whether the data is normally distributed
Normality can be assumed only if p > 0.05.
Input
shapiro.test(carbon$AverageTemperature)
Output
Shapiro-Wilk normality test

data:  carbon$AverageTemperature
W = 0.94052, p-value = 0.008176
p-value < 0.05So we reject the null hypothesis and our data is skewed
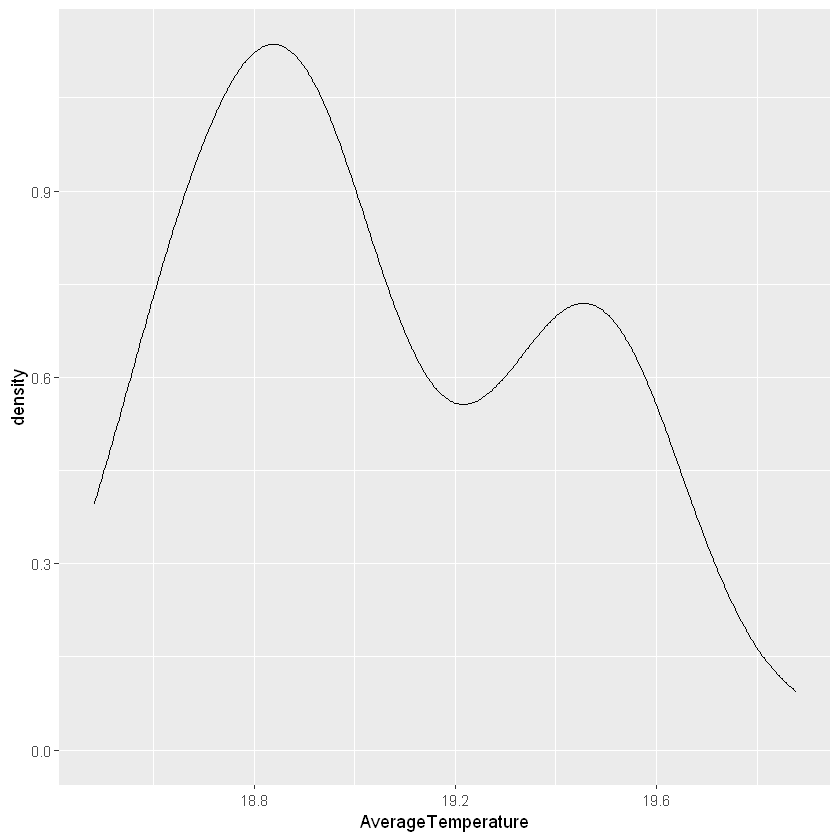
We can also check normality visually with geom_density()
Input
ggplot(carbon, aes(x=AverageTemperature)) +
  geom_density()

Notice that the curve is not the normal curve that we presented before.
So what tests should we run?
Whenever data is normal, we run a parametric test. Most parametric tests have a non-parametric sibling. For instance:
| Parametric test | R | Non-parametric test | R |
|---|---|---|---|
| Independent t-test | t.test(y~x) | Mann-Whitney test | wilcox.test(y~x) |
| Paired t-test | t.test(y1, y2, paired=TRUE) | Wilcoxon signed rank test | wilcox.test(y1, y2, paired=TRUE) |
| One-way ANOVA | aov(y ~ x, data = my_data) | Kruskal-Wallis test | kruskal.test(y~x) |
| Pearson’s correlation | cor.test(x, y, method=c("pearson") | Spearman’s correlation | cor.test(x, y, method=c("spearman") |
If we are on track, try to run the proper non-parametric tests for our data/analysis: