Connecting to data
Understanding your data
The sample data is a .zip with two .csv files from the Novel Coronavirus (COVID-19) Cases Data compiled by the Johns Hopkins University Center for Systems Science and Engineering (JHU CCSE). The second header line was removed from each file to simplify import into Tableau.
- time_series_covid19_confirmed_global_narrow.csv - confirmed cases by day and country
- time_series_covid19_deaths_global_narrow.csv - deaths by day and country
Both files are structured the same way. Every day there is one row for each geographic area, and the Value column contains the cumulative total count up to that date.

For some countries data is available at the Province/State level. In these cases there are multiple rows per day, one for each province/state.
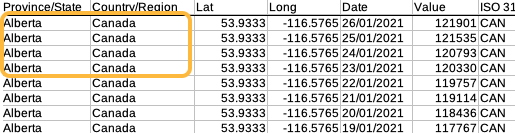
Where province/state information is available, the total count for a country is the sum of the Value column on a particular date.
“Narrow” data is preferable to “wide” data in visualization software. This data is narrow: all counts appear in the same column.
Connecting to multiple data files
Our sample dataset is in two files. Tableau has several options for bringing data from multiple files into the same workbook. The recommended method in most cases is to use Relationships to link files or tables (for more information see the Tableau help article Relate Your Data).
1 Connect the files with a relationship
The video below illustrates how to add and connect the two files.
- Open Tableau and select Text file in the Connect to Data menu
- Select
time_series_covid19_confirmed_global_narrow.csv - Once loaded, other text files in the same directory are listed on the left; drag
time_series_covid19_deaths...to the top-middle pane to create a relationship - In the Edit relationships pop-up add one row linking the tables by Country/Region and a second row linking them by Date
- Close the pop-up window and rename the files to
cases tableanddeaths table - Rename the data source to
covid data
Renaming tables and data sources is not strictly necessary but makes it easier to navigate the Tableau interface and identify your measures and dimensions.
Once both files are added click the Sheet 1 tab near the bottom of the screen to start working with the data.
Loading last updated date...