Calculations: part 1
Orientation and setup
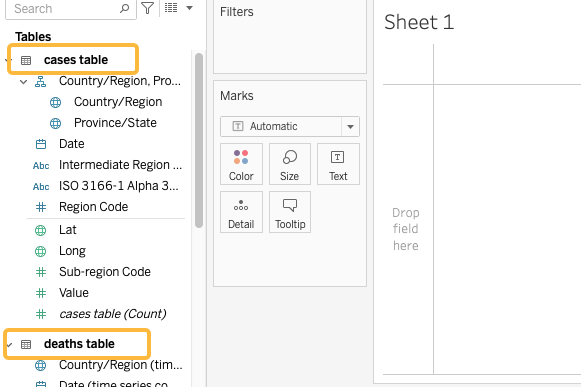
The measures and dimensions from both tables will appear along the left of the Tableau sheet. Under the heading for each table, dimensions are listed near the top followed by measures below the horizontal line.
Checking your work
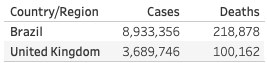
As you work with any visualization or analysis software it’s important to check your work to make sure calculations behave as you intend. This table shows two countries’ case and death totals as of January 26, 2021. As you create new tables and graphs, check your work against these totals.
1 Rename Value to avoid confusion
The measure we will use in the sample dashboard is named Value in both tables. It contains the cumulative number of deaths or cases, depending on the table.
In the cases table, right-click Value rename it to Cases. Move to the deaths table and rename Value to Deaths.
Create summary table
To experiment with calculations we’ll create a summary table listing total cases, deaths, and the death rate for each country.
2 Add dimensions and measures
- Drag Country/Region to the Rows shelf
- Double-click the Cases measure and the Deaths measure to add them to the table

Exercise 1: fixing the totals
Compare the totals in your table to the verification table. (Hint: add a filter for Country/Region to make this easier)
Do they match? If not, try to find a solution.
Click for hints
The data for each day is the *total* number of cases and deaths, not the number of new cases recorded on that particular date. Make sure the table shows only the most recent total.
Using Calculated Fields to create a new measure
You can perform calculations and manipulate data in Tableau, then save the output as a new dimension or measure to use in charts or in other calculations. These Calculated Fields can take advantage of many functions, analogous to formulas in Excel. We will introduce the concept with a simple mathematical function; for a full list of available functions see this Tableau help article.
3 Create a measure for death rate
- In the list of measures and dimensions, right-click Cases and select Create -> Calculated Field
- Name the calculation Death rate
- Enter this formula in the calculation window:
MAX([Deaths])/MAX([Cases]), then click OK

Locate the new Death rate measure in the list, then double-click it add it to the table.
Exercise 2: number formats
The Death rate is a percentage but is not formatted as one by default. There are several ways to control how numbers appear in Tableau. Explore right-click menus for a way to display the Death rate as a percentage.
Loading last updated date...