Geospatial Data
A Geographic Information System (GIS) works with data that is tied to a location on Earth. This type of data is often referred to as GIS data, or geospatial data, and is spatially referenced to Earth using location information – most commonly geographic coordinates. A GIS uses this location information to project a geospatial file into a virtual geographic space where it can then be visualized and analyzed.
Types of Geospatial Data
Geospatial data is often referred to as having two main types: raster and vector. These two data types, while both geospatial, are very different from one another. Raster data is data which is made up of pixels arranged in a grid, whereas vector data is made up of vertices and the paths between them – creating geometries that represent real-world features or phenomena.
Vector Data: Points, Lines, Polygons
Vector data is made up of vertices and the paths between them – creating geometries that represent real-world features (such as a lake or street intersection) or phenomena (like a contour line indicating an elevation). There are 3 kinds of vector geometries in GIS: points, lines, and polygons.
Points
A geometry that is made of a single vertex (a point) is used to represent a single location, such as a city, tree, or address location. Point geometry consists of an x and y vertex, often a lat/long coordinate pair. (Note that the x value would be longitude and the y value would be latitude in this case.)
Lines
Two or more points connected by a path are lines. Lines are used to represent things like street centerlines, administrative boundaries, rivers, etc.
Polygons
Polygons are three or more points connected by a path and closed to form an area. Polygons are used to represent areas like lakes, building footprints, provinces, or parks.
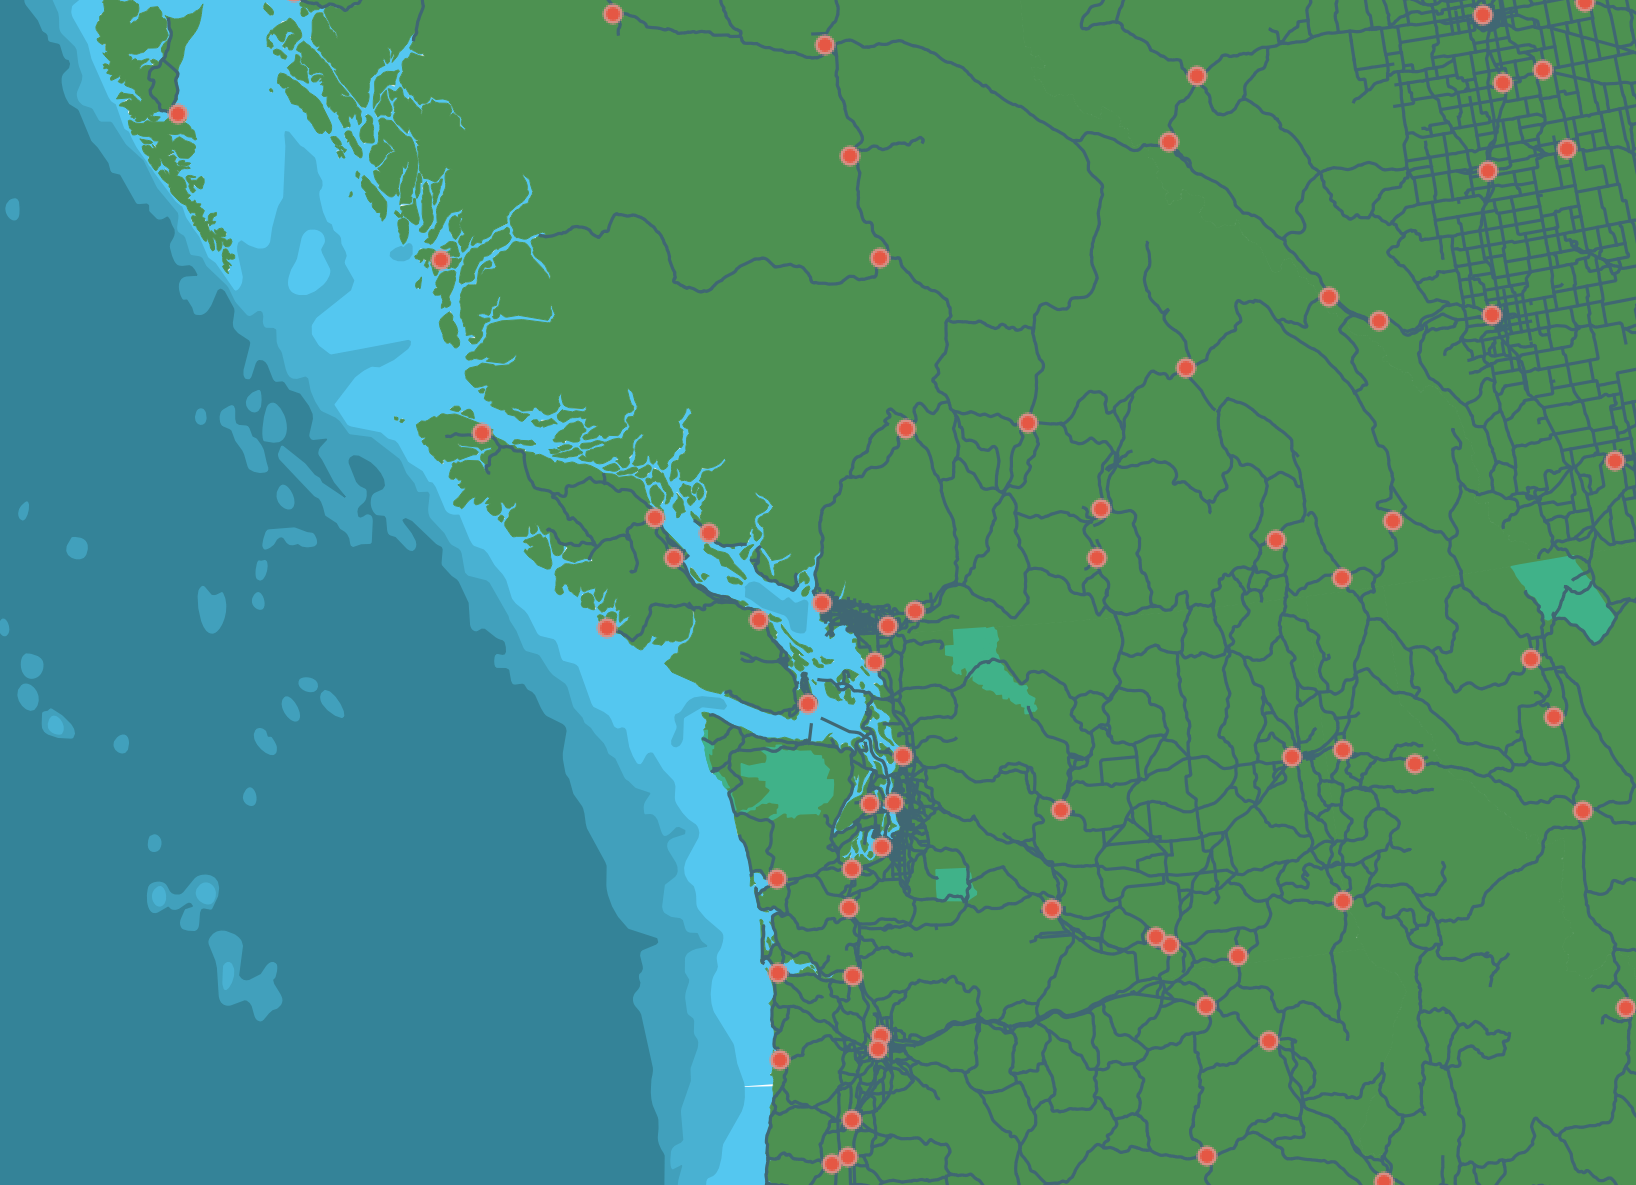
Below is a map consisting of vector data, with cities (points), major roads (lines), land/water (polygons), and parks (polygons).
Raster Data: pixel grids
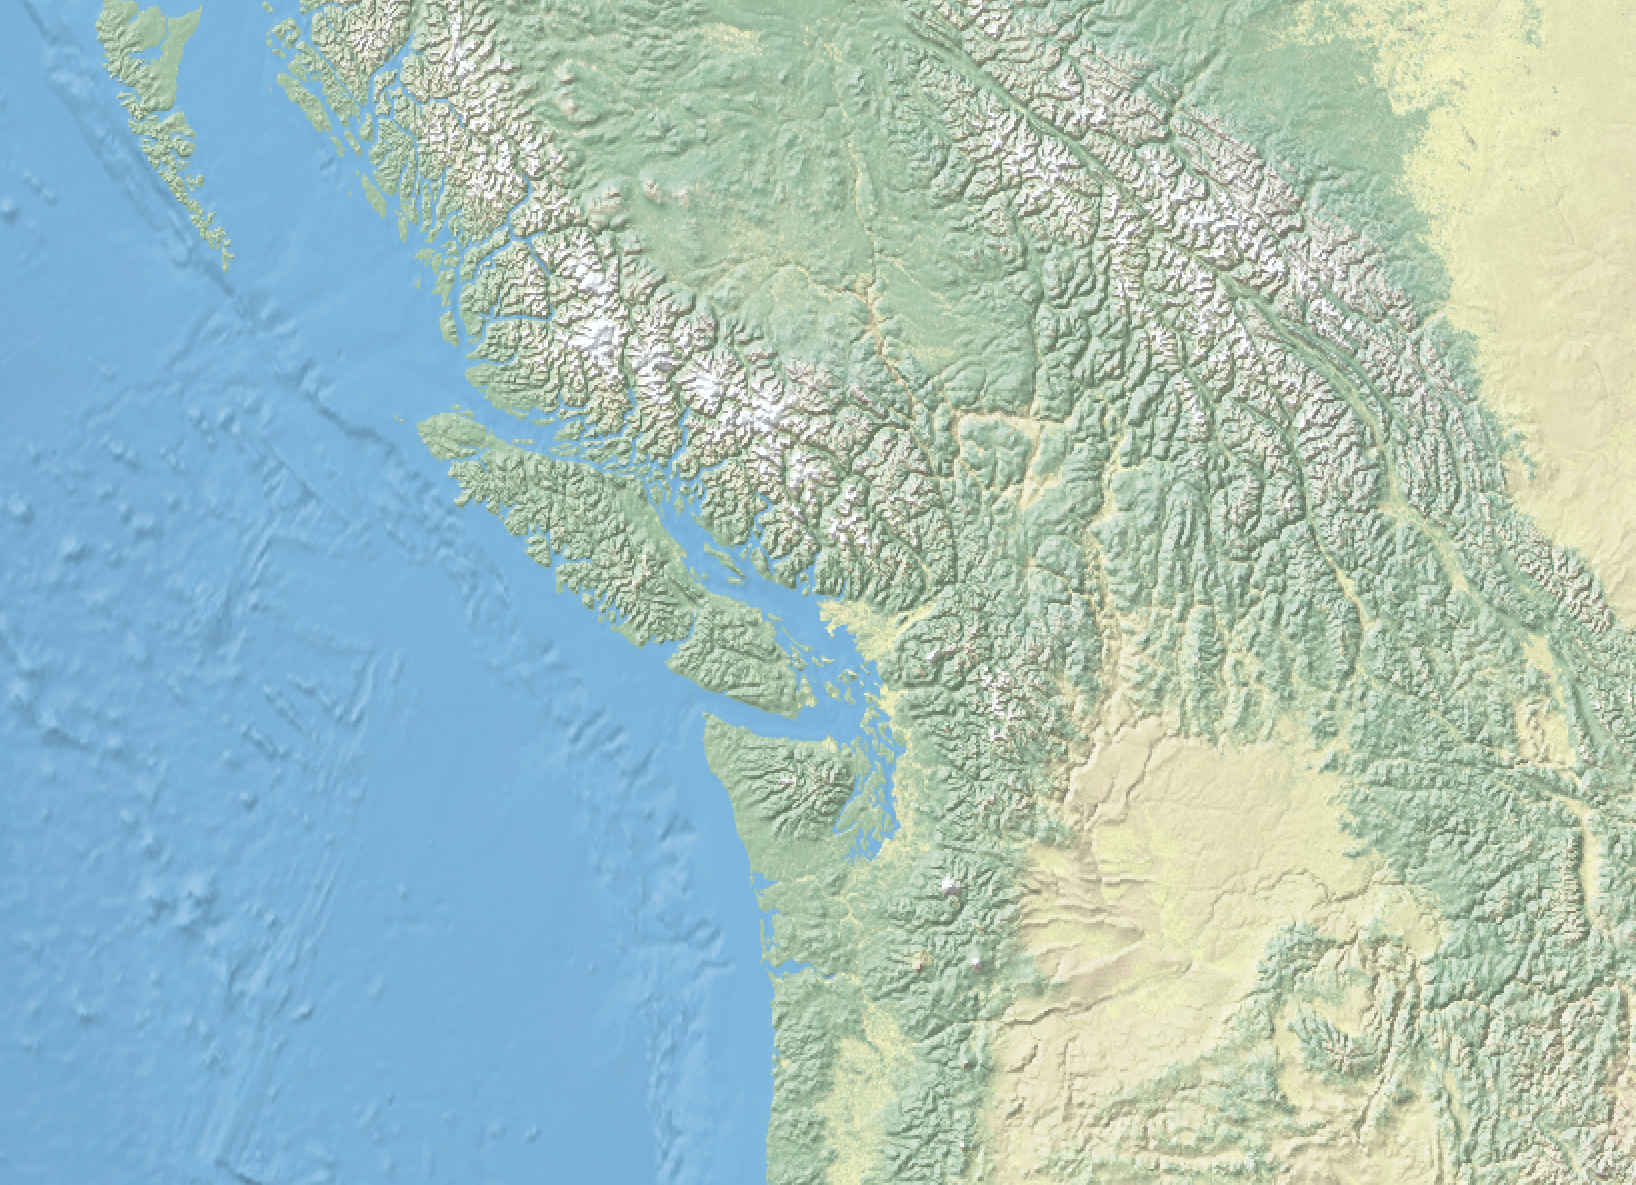
Raster data are stored as a grid of values which are rendered by a GIS as coloured pixels. Continuous geospatial features such as satellite imagery, topography, or the results of spatial calculations are raster data.
Tabular Data in GIS
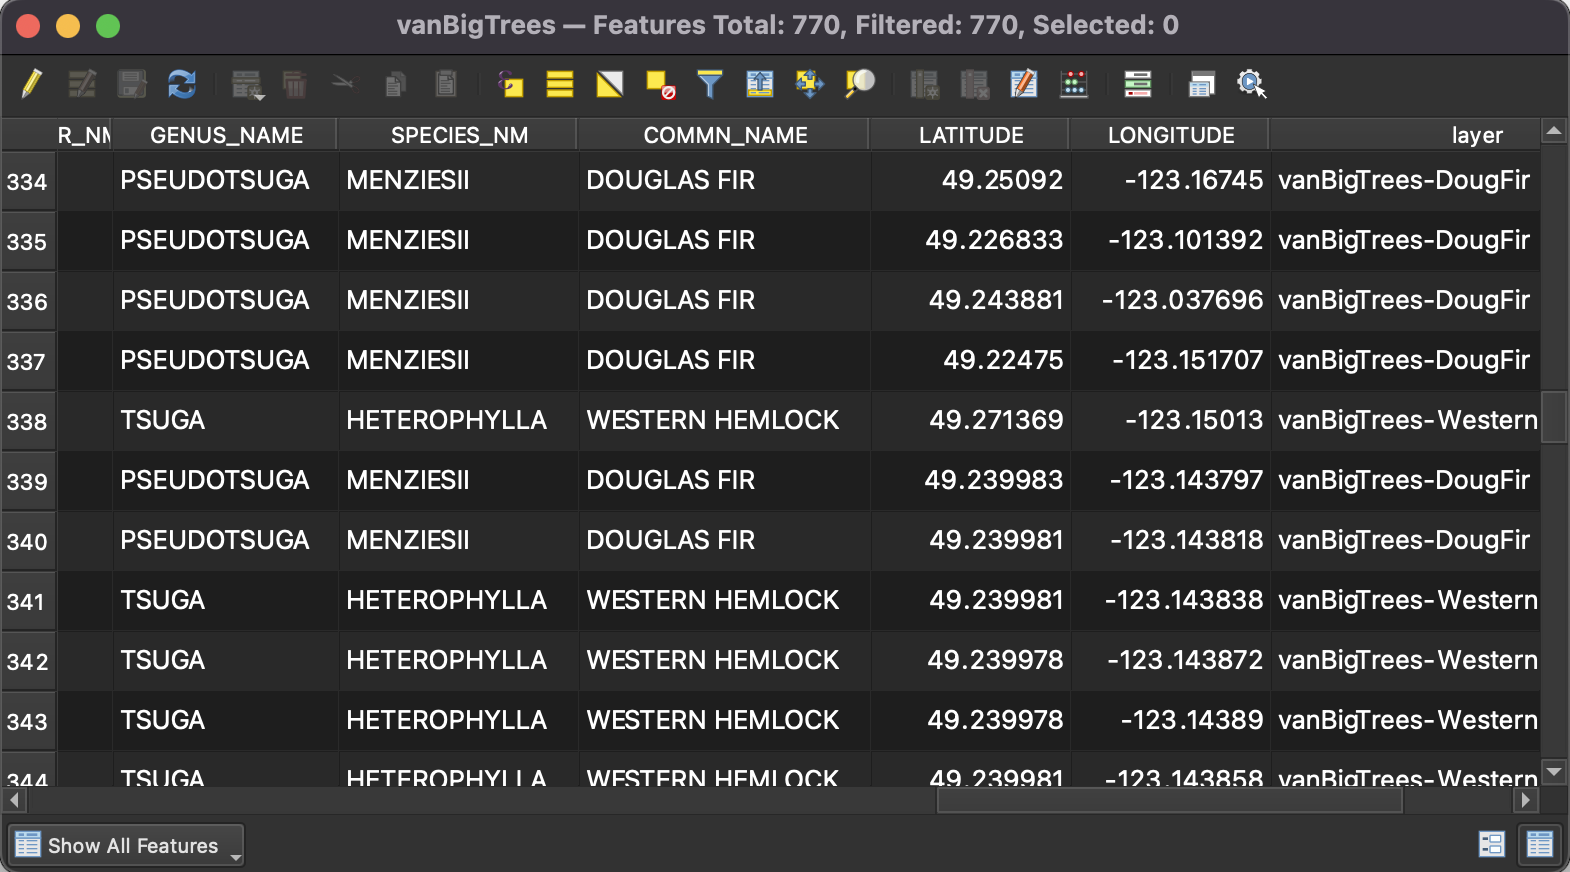
Tabular data are data formatted into a table by rows and columns. The attribute table of a shapefile is an example of tabular data. You can also add a tabular dataset, such as a .csv (commma separated value) file, directly to a GIS and A) join it with a shapefile based on a matching column, or B) project it given coordinate pairs are present.
View workshop content in GitHub
Loading last updated date...