Terminology
We quote Manuel Gimond’s definitions for GIS and spatial analysis.
A Geographic Information System is a multi-component environment used to create, manage, visualize and analyze data and its spatial counterpart.
Spatial analysis focuses on the statistical analysis of patterns and underlying processes. It’s an exploratory process whereby we attempt to quantify the observed pattern then explore the processes that may have generated the pattern.
For example, Census data collects information about the average income of different ethnicities, age groups, etc for every borough of a city. We also have information about the location of public schools, health centres, and recreation zones. Are the services equally distributed across neighborhoods? Are rapid transit lines concentrated in regions of lower income where people use public transit? Those are questions that are addressed in spatial analysis using quantitative and statistical techniques.
R vs Python for Spatial Analysis
Every programming language has a purpose and benefit in certain situations.
Python
Python is great when you need to process bulks of data, fetch data from social networks (e.g., Twitter or Facebook), etc. ArcGIS, QGIS, and GRASS GIS also incorporate Python as part of their tooling, thus Python can be compared to as the swiss army knife for GIS. However, having too many options might be too intimidating if you have a simple and well defined tasks.
R
R is a language for statistical computing, graphics, data science, and geospatial analysis. ESRI provides support for R in their ArcGIS suite and QGIS also supports the programming language. R is specially well suited for statistical tests, multiple regression analysis, or graphics, and, as the language has a well-defined purpose, it can be simpler for certain tasks.
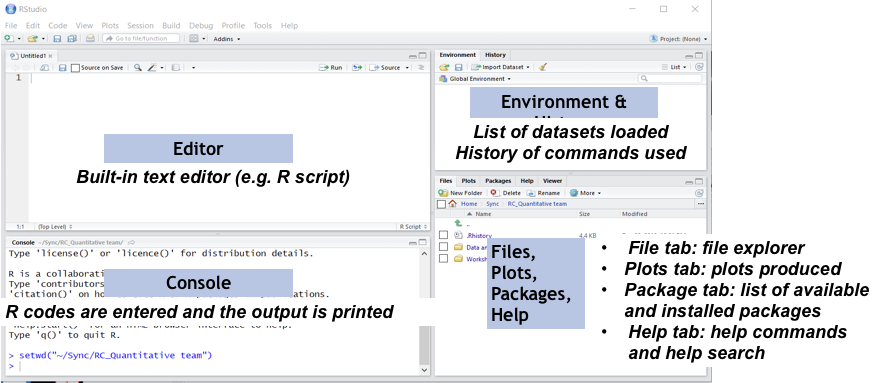
RStudio
Is a integrated development environment that facilitates several tasks for R. We will make use of RStudio in this workshop.
Setup
File > new File > R Script- Save the script into the location where you downloaded the data for this workshop!
File > Save As... - Set working directory
R Code
# set working directory
setwd(dirname(rstudioapi::getActiveDocumentContext()$path))
Packages
Several of the tasks that we will perform are actually embedded into code wrote by some really intelligent people. This code is wrapped up in what we call packages and, instead of writing everything from scratch, we can just download and use these packages!
R Code
# elegant way to install all packages
list.of.packages <- c(
  "dplyr", "ggplot2", "raster", "rgdal", "rasterVis", "sf", "tmap", "spatstat",
  "maptools", "spdep", "classInt", "RColorBrewer", "maptools"
)
new.packages <- list.of.packages[!(list.of.packages %in% installed.packages()[,"Package"])]
if(length(new.packages)) install.packages(new.packages)
R Code
# Loading the packages needed for this workshop
library(dplyr)
library(ggplot2)
library(raster)
library(rgdal)
library(rasterVis)
library(sf)
library(tmap)
library(spatstat)
library(maptools)
library(classInt)
library(RColorBrewer)