Outline
Problem Statement
Students want to write a petition asking for the construction of schools, community centres, and other recreation facilities for certain neighbourhoods. They want support from the local news and, instead of anedoctal data, they come armed with science and knowledge!!!
- What is the density of services in Vancouver’s neighbourhoods?
- Are services concentrated in accessible regions?
- Does income of citizens in a neighbourhood influece service density?
Approach
To address this problem, we follow one or more steps from Ben Fry’s data visualization pipeline:
- Acquire Obtain the data, whether from a file on a disk or a source over a network.
- Parse Provide some structure for the data’s meaning, and order it into categories.
- Filter Remove all but the data of interest.
- Mine Apply methods from statistics or data mining as a way to discern patterns or place the data in mathematical context.
- Represent Choose a basic visual model, such as a bar graph, list, or tree.
- Refine Improve the basic representation to make it clearer and more visually engaging.
- Interact Add methods for manipulating the data or controlling what features are visible.
Schedule
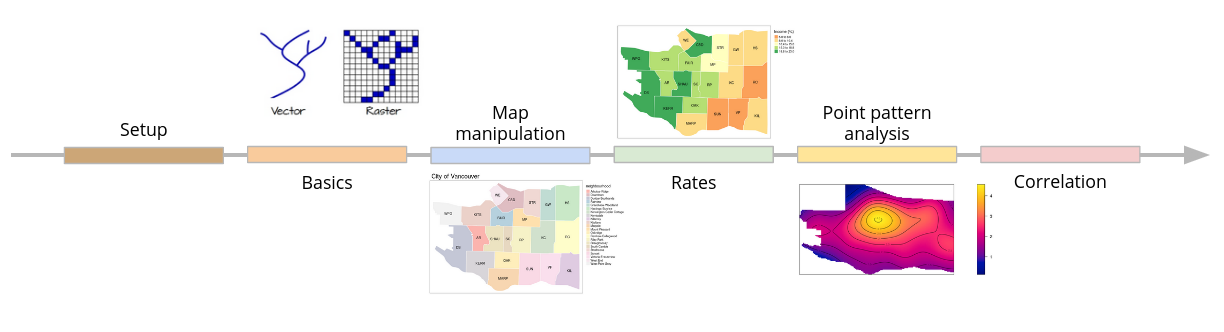
Content
Actual schedule may vary depending on group needs
This is your session. If you have a question or feel we are going too fast, please let the instructor know. We can decide as a group what to cover.