dplyr
Quadrat density did not make use of the polygons representing each neighbourhood. Can we count the number of services for a given neighbourhood?
R Code
head(vancouver_boundaries$mapid)
Output
[1] AR   CBD  FAIR GW   HS   MARP
Levels: AR CBD DS FAIR GW HS KC KERR KIL KITS MARP MP OAK RC RP SC SHAU STR SUN VF WE WPG
1-2 Finding points within a polygon with filter and st_intersects
The dplyr package provides several functionalities for manipulating data, e.g., filtering rows, selecting certain columns, aggregating results, etc. In this workshop, we use the very minimum of the package and we encourage readers to look for more resources for using the package.
First, we can find the polygon of a single neighborhood with filter
R Code
filtered <- vancouver_boundaries %>% filter(mapid == "MP")
Then, we can find all points that are within the boundaries of that polygon using st_intersects
R Code
st_intersects(filtered, schools)
lengths(st_intersects(filtered, schools))
Finding points for all polygons
We can repeat this process for every neighborhood. However, this could require a lot of coding. We can avoid that with a loop over each neighborhood, i.e.: for (neighbourhood in vancouver_boundaries$mapid)
R Code
lst_cnt <- c()
for (neighbourhood in vancouver_boundaries$mapid) {
  neighbourhood_polygon <- vancouver_boundaries %>%
    filter(mapid == neighbourhood)

  cnt <- lengths(st_intersects(neighbourhood_polygon, schools))
  lst_cnt <- c(cnt, lst_cnt)
}
lst_cnt
Any code inside the curly braces will be repeated for each neighborhood. At the end, lst_cnt will have the number of schools for all our data.
R Code
vancouver_boundaries$schools <- lst_cnt
vancouver_boundaries %>%
  pull(mapid, schools)
Output
> vancouver_boundaries %>%
+   pull(mapid, schools)
   7    9   21    7    8   17   10    8   11    8    5    8    3    4
  AR  CBD FAIR   GW   HS MARP   RP SHAU  STR   WE   DS KERR  KIL KITS
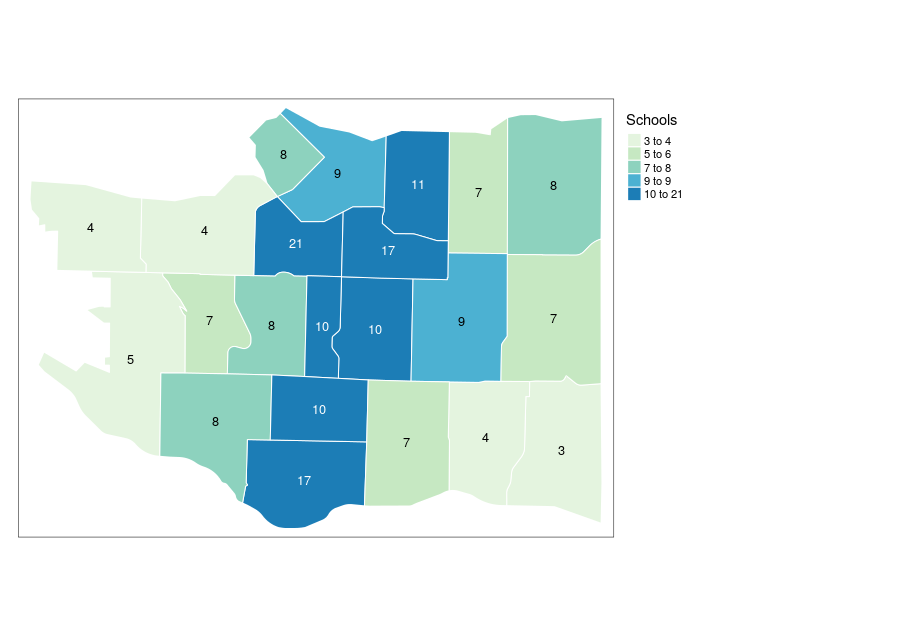
Plotting schools per neighborhood
R Code
brks <- classIntervals(vancouver_boundaries$schools, n = 5, style = "quantile")
tm_shape(vancouver_boundaries) +
  tm_polygons("schools",
              breaks= brks$brks, title="Seervices",
              border.col = "white", palette = "GnBu") +
  tm_text("schools", just = "center", size = 0.8) +
  tm_legend(outside=TRUE)
Output
Exercise
- Count the number of community centres
Encapsulating everything in a function
Doing the above for schools, community centres, etc. is quite verbose. Once again, we can wrap everything inside a function:
R Code
cnt_services <- function(point_data) {
  lst_cnt <- c()
  for (neighbourhood in vancouver_boundaries$mapid) {
    neighbourhood_polygon <- vancouver_boundaries %>% filter(mapid == neighbourhood)
    cnt <- lengths(st_intersects(neighbourhood_polygon, point_data))
    lst_cnt <- c(cnt, lst_cnt)
  }

  return(lst_cnt)
}
The function takes a set of points as input, and it goes over our data finding all points that intersect each neighborhood. Handy, eh?
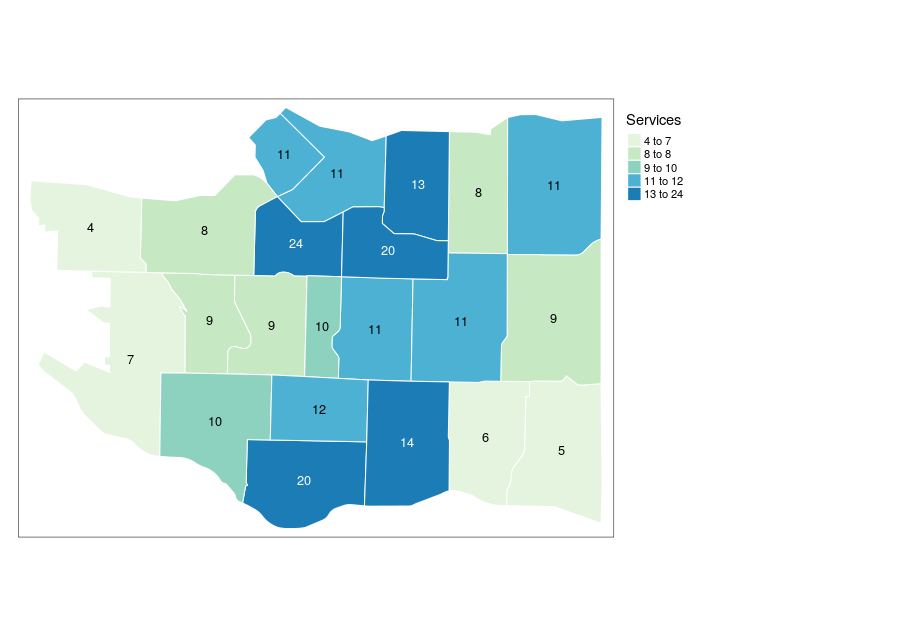
Now, we can cound schools, libraries, and community centres. We can also sum them in a single variable called all_services
R Code
vancouver_boundaries$schools <- cnt_services(schools)
vancouver_boundaries$libraries <- cnt_services(libraries)
vancouver_boundaries$community_centres <- cnt_services(community_centres)


vancouver_boundaries$all_services <- vancouver_boundaries$schools +
  vancouver_boundaries$libraries +
  vancouver_boundaries$community_centres
R Code
brks <- classIntervals(vancouver_boundaries$all_services, n = 5, style = "quantile")
tm_shape(vancouver_boundaries) +
  tm_polygons("all_services",
        breaks= brks$brks, title="Services",
        border.col = "white", palette = "GnBu") +
  tm_text("all_services", just = "center", size = 0.8) +
  tm_legend(outside=TRUE)
Output
Recap
filterfilter a dataset based on some conditionst_intersectsbinds a polygon area to a set of points