1-2 Plotting a Basic Map
We can plot vectorial data with tm_shape and tm_polygons
R Code
tm_shape(vancouver_boundaries) +
  tm_polygons(col="grey", border.col = "white")
tm_shape selects a dataset for plotting
tm_polygons plots any polygons for thtat dataset
Adding Meta-Data
What data is available?
R Code
colnames(vancouver_boundaries)
colnames inspects the columns of our data, either its crs or metadata, e.g. name of neighbourhoods.
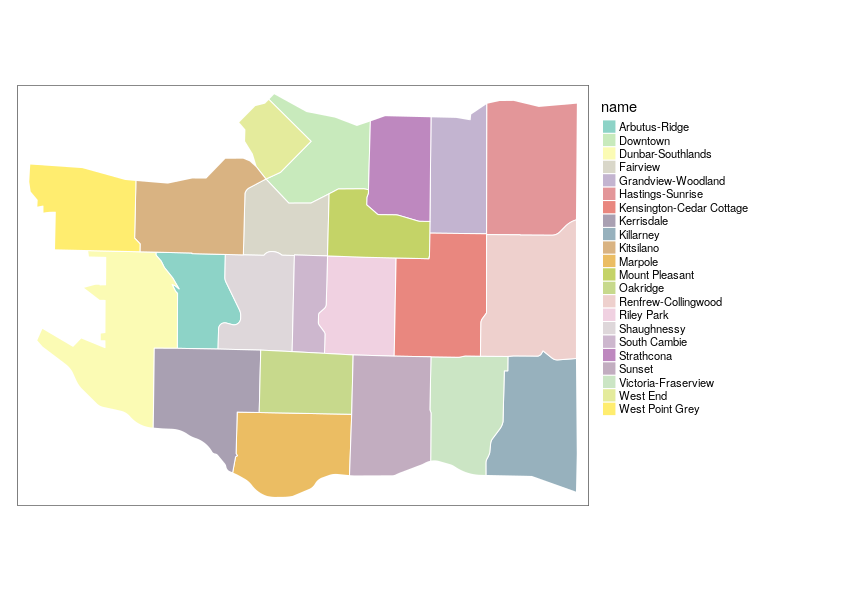
R Code
tm_shape(vancouver_boundaries) +
  tm_polygons(col="name", border.col = "white") +
  tm_legend(outside=TRUE)
Output
Improving Aesthetics
Step-by-step:
First, let’s improve the legend position and add a name to our mape
R Code
# adding meaningfull names
tm_shape(vancouver_boundaries) +
  tm_polygons(col="name", border.col = "white", title="neighbourhood") +
  tm_legend(outside=TRUE) +
  tm_layout(main.title="City of Vancouver", main.title.position = "left")
Then, let’s improve the color palette. Pastel1 is one of many available palettes. Later we will check what palettes are available
R Code
# changing the colour palette
tm_shape(vancouver_boundaries) +
  tm_polygons(col="name", border.col = "white", title="neighbourhood", palette = "Pastel1") +
  tm_legend(outside=TRUE) +
  tm_layout(main.title="City of Vancouver", main.title.position = "left")
3 Adding text for neighborhood IDs with tm_text
We ca use tm_text and one of the columns of our data to add extra information to our plot.
R Code
tm_shape(vancouver_boundaries) +
  tm_polygons(col="name", border.col = "white", title="neighbourhood", palette = "Pastel1") +
  tm_text("mapid", just = "center", size = 0.8) +
  tm_legend(outside=TRUE) +
  tm_layout(main.title="City of Vancouver", main.title.position = "left")
Combining Layers
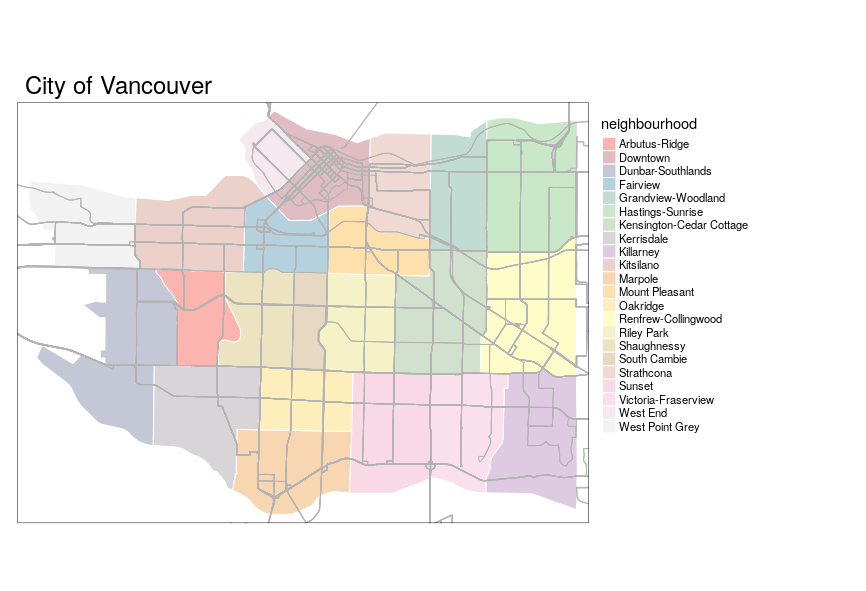
4 Combining polygons and lines with tm_lines
For every dataset that we want to use for plotting, we must append it with tm_shape + some function, e.g. tm_lines, tm_polygons, etc.
R Code
tm_shape(vancouver_boundaries) +
  tm_polygons(col="name", border.col = "white", title="neighbourhood", palette = "Pastel1") +
tm_shape(transit_routes) +
  tm_lines(col="grey70", size=.1) +
  tm_legend(outside=TRUE) +
  tm_layout(main.title="City of Vancouver", main.title.position = "left")
Output
5-6 Combining polygons and dots with tm_dots
R Code
tm_shape(vancouver_boundaries) +
  tm_polygons(col="name", border.col = "white", title="neighbourhood", palette = "Pastel1") +
tm_shape(schools) +
  tm_dots(col="red", size=.1, shape=18) +
  tm_legend(outside=TRUE) +
  tm_add_legend(
    type = "symbol",
    shape=c(18),
    labels=c("Schools"),
    col=c("red")) +
  tm_layout(main.title="City of Vancouver", main.title.position = "left")
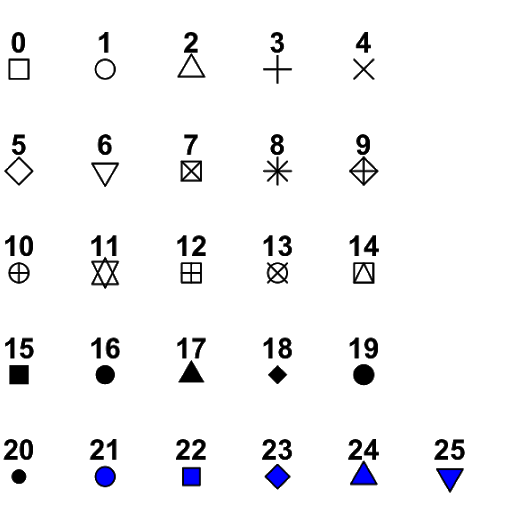
Note that each tm_dots has different shape codes and colors. We must use the same shape and color for our legend.
Available shape codes:
Shape codes
Exercise
- Make a map that has the city neighborhoods
- Add schools, libraries and community centres to the map
- Use different shapes and colors for each
- Change
shape,labelsandcolintm_add_legend- instead of
c(18), you can pass a list of values to these parameters, e.g.,shape=c(18, 16, 15, 17)
- instead of
Recap
1 tm_shape defines the dataset for plotting
2 tm_polygons draws polygon shapes based on the dataset provided
3 tm_text adds text in the map
4 tm_lines draws lines based on the dataset provided
5 tm_dots draws dot shapes based on the dataset provided
6 tm_add_legend manually add labels and text for the legend component of the map