Point Pattern Analysis
Point pattern analysis (PPA) is the study of the spatial arrangements of points in (usually 2-dimensional) space. For such analysis, we have to distinguish intensity, and density. source
Density
Density refers to point concentration in an area.
Intensity
Intensity is estimated from the observed point concentration over the given area.
 |  |
|---|---|
| Density | Intensity |
- What is an example of high density and low intensity?
1 Point Pattern Analysis with spatstat
spatstat package provides several functionalities for point pattern analysis. However, point pattern analysis does not benefit from the multiple polygons dividing the neighbourhoods and we will use the city boundary instead.
spatstat is also designed to work with points stored as ppp objects, so we will have to convert from sf to ppp. This requires multiple steps, such as reading the file, removing meta-data, etc. When multiple steps are required, it might be useful to make a function that will encapsulate all of these procedures:
R Code
convert2ppp <- function(input_file){
  x <- readShapeSpatial(input_file)
  y <- as.ppp(x)
  # Note that a ppp object may or may not have meta-data information (also referred to as marks).
  # We'll therefore remove all marks from the point object.
  marks(y) <- NULL
  return(y)
}
R Code
schools_ppp <- convert2ppp("schools.shp")
libraries_ppp <- convert2ppp("libraries.shp")
community_centres_ppp <- convert2ppp("community-centres.shp")
disability_parkings_ppp <- convert2ppp("disability-parking.shp")
For the city boundary, we need to convert from SpatialLinesDataFrame to polygonal boundary
R Code
aux <- readShapeSpatial("city-boundary.shp")
aux <- st_polygonize(st_as_sf(aux))
aux <- as(aux, "Spatial")
city <- as.owin(aux)
2 It might also be interesting to merge the points
superimpose.ppp takes any number of points for merging.
R Code
ppp_data <- superimpose.ppp(schools_ppp, libraries_ppp, community_centres_ppp, disability_parkings_ppp)
3 Finally, we bind the city boundary to the set of points
R Code
Window(ppp_data) <- city
We can plot the point layer to ensure everything is properly set:
R Code
plot(ppp_data, main=NULL, cols=rgb(0,0,0,.2), pch=20)
4 Quadrat density
A study area is divided into sub-regions (aka quadrats). Then, the point density is computed for each quadrat by dividing the number of points in each quadrat by the quadrat’s area. spatstat provides the quadratcount to obtain quadrats:
R Code
Q <- quadratcount(ppp_data, nx= 6, ny=2)
plot(ppp_data, pch=20, cols="grey70", main=NULL)
plot(Q, add=TRUE)
Output
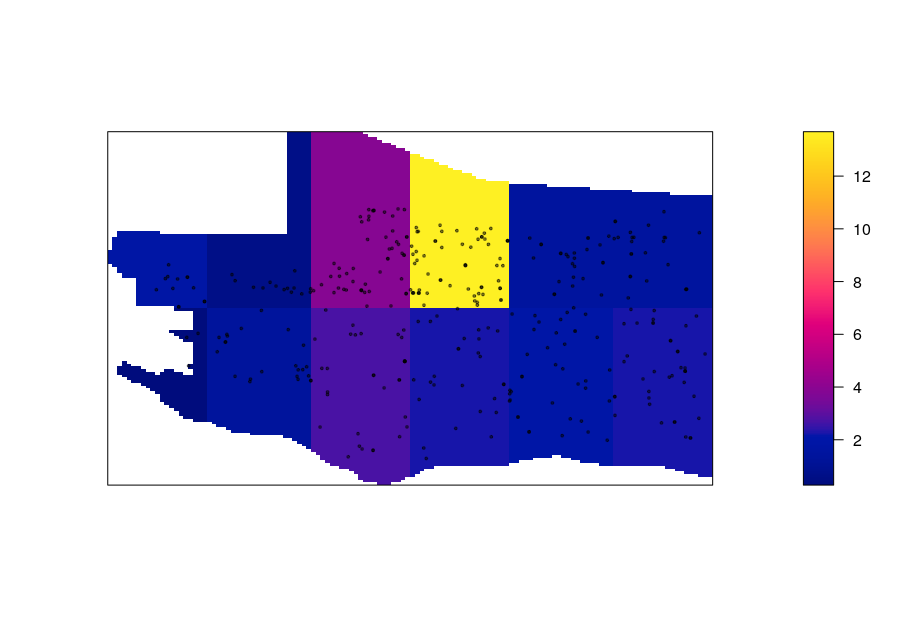
5 Quadrat intensity
Given quadrats, we obtain their itensity with intensity
R Code
ppp_data.scale <- rescale(ppp_data, .01, "log10")
Q   <- quadratcount(ppp_data.scale, nx= 6, ny=2)


plot(intensity(Q, image=TRUE), main=NULL, las=1)  # Plot density raster
plot(ppp_data.scale, pch=20, cex=0.6, col=rgb(0,0,0,.5), add=TRUE)  # Add points
Output
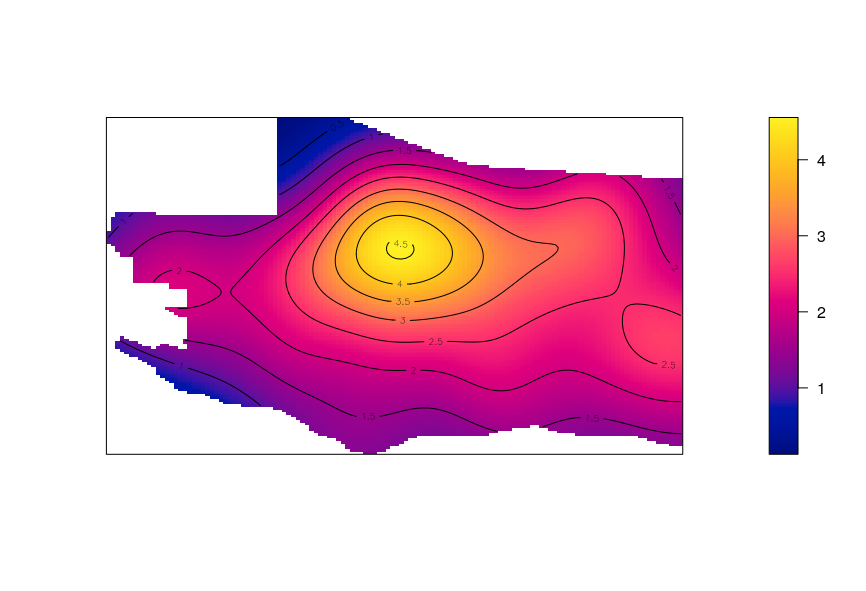
6 Kernel Density
Like the quadrat density, the kernel approach computes a localized density for subsets of the study area. Unlike its quadrat density counterpart, the sub-regions overlap, which produces a smoothly curved surface over each point.
spatstat provides the density to obtain the kernel density of a set of points:
R Code
K2 <- density(ppp_data.scale)
plot(K2, main=NULL, las=1)
contour(K2, add=TRUE)
Output
Exercise
- Use the chat to mention a potential dataset where point pattern analysis could be used to …
Recap
1 as.ppp and as.owin respectively convert points and polygons to the spatstat format (ppp)
2 superimpose.ppp merges different point variables
3 Window assigns a polygon area to a set of points
4 quadratcount counts the density of points in a given area
5 intensity computes the intensity of points in a given area
6 density computes the kernel density of a set of points